I'm bearish on $IKBR earning, but Gemini is bullishBased on the technical data for **Interactive Brokers Group, Inc. (IBKR)** as of October 15, 2025, here is a concise analysis:
### Wyckoff Phase: Re-accumulation in a Mark-Up Trend
The most probable Wyckoff phase for IBKR is **Phase D (Mark Up)**, currently undergoing a **re-accumulation** period.
Next report date
—
Report period
—
EPS estimate
—
Revenue estimate
—
1.78 EUR
729.31 M EUR
9.07 B EUR
430.50 M
About Interactive Brokers Group, Inc.
Sector
Industry
CEO
Milan Galik
Website
Headquarters
Greenwich
Founded
1977
ISIN
US45841N1072
FIGI
BBG000Q3YQM5
Interactive Brokers Group, Inc. is an investment holding company, which engages in broker or dealer and proprietary trading businesses. It offers custody and service accounts for hedge and mutual funds, exchange-traded funds, registered investment advisors, proprietary trading groups, introducing brokers, and individual investors. The company was founded by Thomas Pechy Peterffy in 1977 and is headquartered in Greenwich, CT.
Related stocks

IBKR watch $65-66: Key Resistance break-n-retest should RUNIBKR watch $65-66: Key Resistance break should RUN
IBKR launched from our Double Golden zone.
Now struggling with a semi-major resistance.
Look for a Break-n-Retest for next entry.
$ 65.46-66.10 is the current resistance
$ 57.42-58.19 below is major support
$ 69.93-70.22 is t he next barrier above

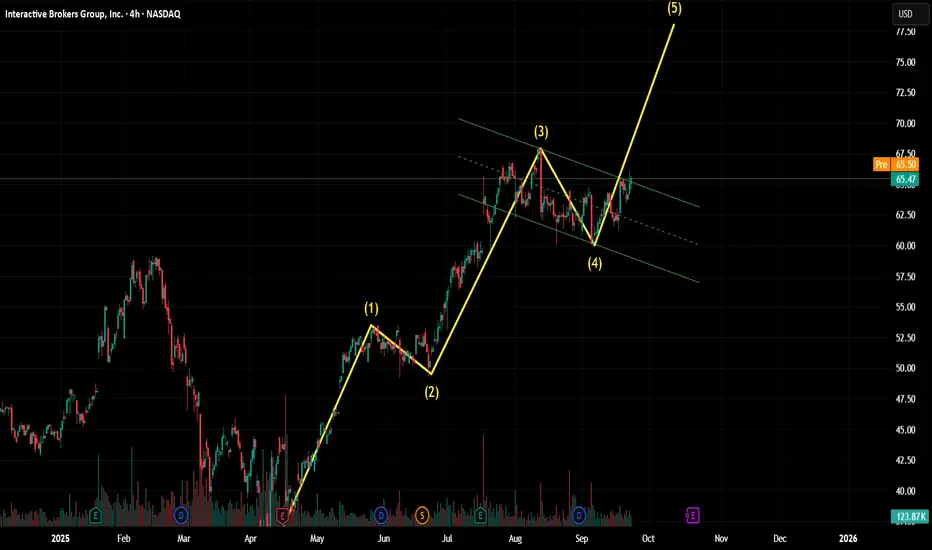
bull flag / eliots waveinteractive brokers has been forming a bull flag the past months and is ready to break out now for a rally before earnings according to the eliots wave and bullflag target we would hit 78 in the coming weeks.
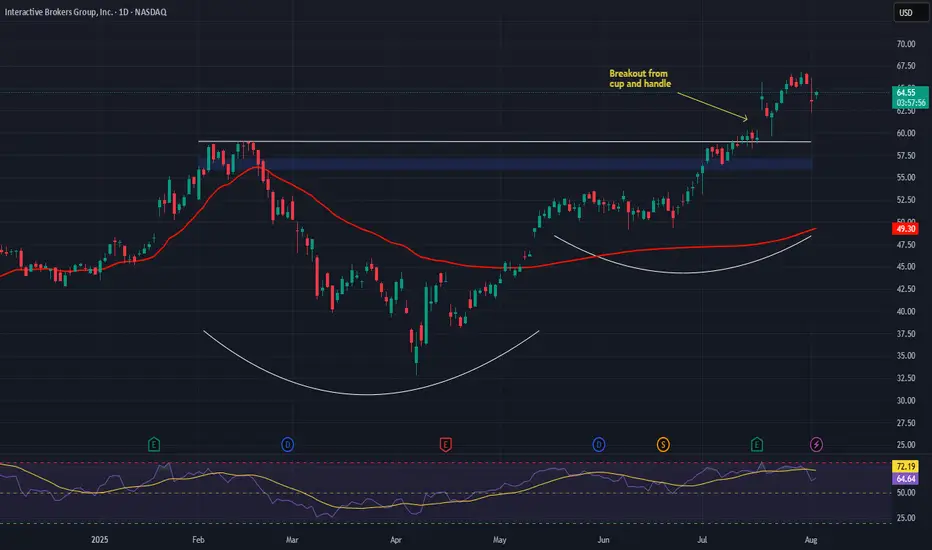
IBKR BUY OPPORTUNITYIBKR breaks out of a weekly triangle consolidation. Strong fundamentals and upcoming S&P 500 inclusion reinforce its investment appeal.
price target 80

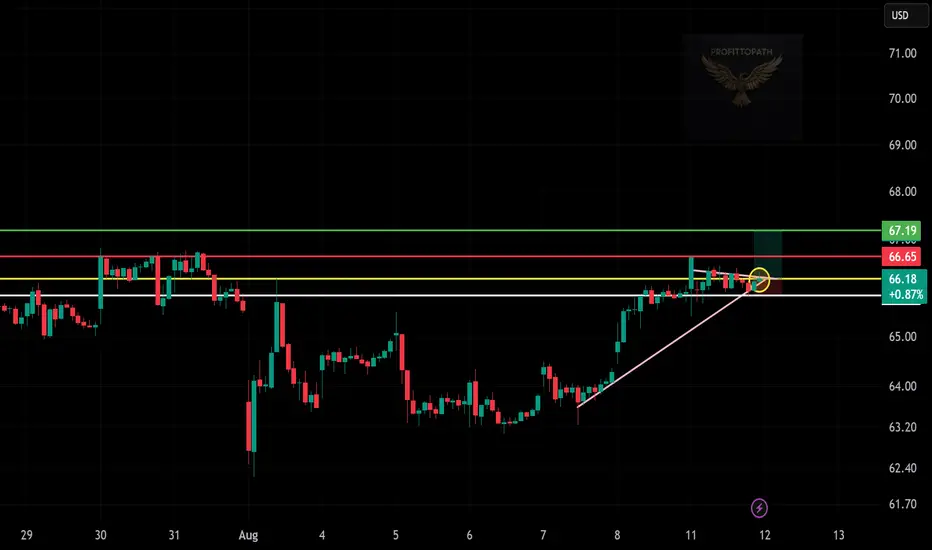
Broker’s Breakout Move!📍 Entry: Buy above $66.65 (confirmation breakout candle close).
🛑 Stop-Loss: $66.00 (below yellow zone & trendline for safety).
🎯 Target 1 (T1): $67.19 – first resistance zone.
🎯 Target 2 (T2): $68.00 – next resistance if momentum follows through.
IBKR – Scaling Globally with Automation, Innovation, and InflowsCompany Snapshot:
Interactive Brokers NASDAQ:IBKR is delivering explosive growth, driven by unmatched automation, deep market access, and strong global demand for low-cost, self-directed investing.
Key Catalysts:
Account Growth Surge 🚀
Q2 saw 250,000 new accounts, pushing 2024’s total to 528,00
IBKR watch $57.42-58:19: Double Golden Fib zone holding in OrbitIBKR has been in a strong uptrend but now consolidating.
Currently orbiting a Double Golden zone $57.42-58.19
This could be a TOP or a ReCharge zone for next leg.

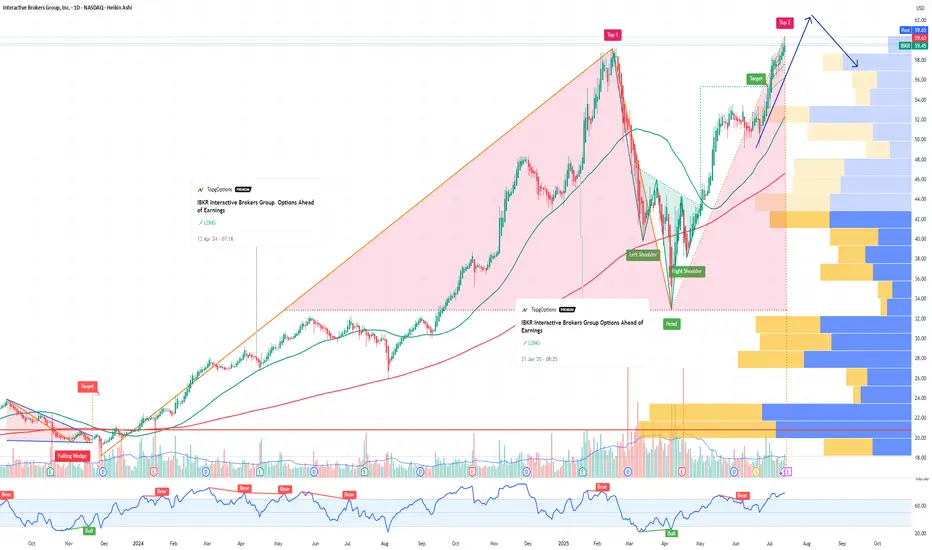
IBKR Interactive Brokers Group Options Ahead of EarningsIf you haven`t bought IBKR before the rally:
Now analyzing the options chain and the chart patterns of IBKR Interactive Brokers prior to the earnings report this week,
I would consider purchasing the 60usd strike price Calls with
an expiration date of 2025-9-19,
for a premium of approximately $3.9
IBKR watch $210: Major Resistance to the tariff Bounce may Dip IBKR coming back strong from the Tariff Tantrum.
Now testing a major resistance at $209.26-210.26
Looking for a dip to support zone at $198.88-200.42

INTERACTIVE BROKERS LONG-OPORTUNITYBUY
$172-182
PROFIT
$207-210
STOP LOSS
$150
The success of this operation can take between 2 and 4 weeks. It is a swing trade execution.

See all ideas
Summarizing what the indicators are suggesting.
Neutral
SellBuy
Strong sellStrong buy
Strong sellSellNeutralBuyStrong buy
Neutral
SellBuy
Strong sellStrong buy
Strong sellSellNeutralBuyStrong buy
Neutral
SellBuy
Strong sellStrong buy
Strong sellSellNeutralBuyStrong buy
An aggregate view of professional's ratings.
Neutral
SellBuy
Strong sellStrong buy
Strong sellSellNeutralBuyStrong buy
Neutral
SellBuy
Strong sellStrong buy
Strong sellSellNeutralBuyStrong buy
Neutral
SellBuy
Strong sellStrong buy
Strong sellSellNeutralBuyStrong buy
Displays a symbol's price movements over previous years to identify recurring trends.
Curated watchlists where KY6 is featured.

Frequently Asked Questions
The current price of KY6 is 57.02 EUR — it has decreased by −3.91% in the past 24 hours. Watch Interactive Brokers Group, Inc. Class A stock price performance more closely on the chart.
Depending on the exchange, the stock ticker may vary. For instance, on FWB exchange Interactive Brokers Group, Inc. Class A stocks are traded under the ticker KY6.
KY6 stock has fallen by −2.43% compared to the previous week, the month change is a −1.29% fall, over the last year Interactive Brokers Group, Inc. Class A has showed a 34.84% increase.
We've gathered analysts' opinions on Interactive Brokers Group, Inc. Class A future price: according to them, KY6 price has a max estimate of 80.74 EUR and a min estimate of 62.51 EUR. Watch KY6 chart and read a more detailed Interactive Brokers Group, Inc. Class A stock forecast: see what analysts think of Interactive Brokers Group, Inc. Class A and suggest that you do with its stocks.
KY6 stock is 4.38% volatile and has beta coefficient of 1.74. Track Interactive Brokers Group, Inc. Class A stock price on the chart and check out the list of the most volatile stocks — is Interactive Brokers Group, Inc. Class A there?
Today Interactive Brokers Group, Inc. Class A has the market capitalization of 27.84 B, it has increased by 3.65% over the last week.
Yes, you can track Interactive Brokers Group, Inc. Class A financials in yearly and quarterly reports right on TradingView.
Interactive Brokers Group, Inc. Class A is going to release the next earnings report on Jan 20, 2026. Keep track of upcoming events with our Earnings Calendar.
KY6 earnings for the last quarter are 0.49 EUR per share, whereas the estimation was 0.46 EUR resulting in a 5.12% surprise. The estimated earnings for the next quarter are 0.49 EUR per share. See more details about Interactive Brokers Group, Inc. Class A earnings.
Interactive Brokers Group, Inc. Class A revenue for the last quarter amounts to 1.41 B EUR, despite the estimated figure of 1.30 B EUR. In the next quarter, revenue is expected to reach 1.37 B EUR.
KY6 net income for the last quarter is 224.13 M EUR, while the quarter before that showed 190.15 M EUR of net income which accounts for 17.87% change. Track more Interactive Brokers Group, Inc. Class A financial stats to get the full picture.
Yes, KY6 dividends are paid quarterly. The last dividend per share was 0.07 EUR. As of today, Dividend Yield (TTM)% is 0.39%. Tracking Interactive Brokers Group, Inc. Class A dividends might help you take more informed decisions.
Interactive Brokers Group, Inc. Class A dividend yield was 0.48% in 2024, and payout ratio reached 12.27%. The year before the numbers were 0.48% and 7.06% correspondingly. See high-dividend stocks and find more opportunities for your portfolio.
As of Nov 14, 2025, the company has 3 K employees. See our rating of the largest employees — is Interactive Brokers Group, Inc. Class A on this list?
EBITDA measures a company's operating performance, its growth signifies an improvement in the efficiency of a company. Interactive Brokers Group, Inc. Class A EBITDA is 7.47 B EUR, and current EBITDA margin is 85.16%. See more stats in Interactive Brokers Group, Inc. Class A financial statements.
Like other stocks, KY6 shares are traded on stock exchanges, e.g. Nasdaq, Nyse, Euronext, and the easiest way to buy them is through an online stock broker. To do this, you need to open an account and follow a broker's procedures, then start trading. You can trade Interactive Brokers Group, Inc. Class A stock right from TradingView charts — choose your broker and connect to your account.
Investing in stocks requires a comprehensive research: you should carefully study all the available data, e.g. company's financials, related news, and its technical analysis. So Interactive Brokers Group, Inc. Class A technincal analysis shows the sell today, and its 1 week rating is buy. Since market conditions are prone to changes, it's worth looking a bit further into the future — according to the 1 month rating Interactive Brokers Group, Inc. Class A stock shows the buy signal. See more of Interactive Brokers Group, Inc. Class A technicals for a more comprehensive analysis.
If you're still not sure, try looking for inspiration in our curated watchlists.
If you're still not sure, try looking for inspiration in our curated watchlists.