“M&M Rides GST Tailwinds: Festive Demand Meets Policy Boost”📖 Crown Point Research – Social Market Update
1️⃣ Date & Time
Date: 5th September 2025
Time: 11:30 AM IST
2️⃣ Fundamental News
GST reform 2.0 cut taxes on vehicles, boosting consumer affordability and sentiment.
Festive demand season adds further momentum to auto majors.
No negative global auto sector headwinds today → rally supported by policy + demand.
3️⃣ Public Sentiment & Human Behaviour
Retail psychology: Traders are chasing auto names, calling them “safe GST winners.”
Institutions: Quietly accumulating near 3,450–3,500 zones, with no heavy distribution.
Social signal: Headlines say “Auto rally unstoppable,” but structure shows controlled continuation with pullback checks.
4️⃣ Current Structure
Macro :
Support: 3,400–3,450 zone.
Resistance: 3,600–3,720.
Micro :
Support: 3,500–3,520 intraday base.
Resistance: 3,580–3,600 ceiling.
Behaviour: Controlled pullbacks; shallow retracements acting as rebalancing fuel.
5️⃣ Projection
Primary Path (70%): Continuation higher → break of 3,600 may extend to 3,720.
Alternate Path (20%): Failure at 3,600 → retest of 3,480–3,500 zone before resuming upward.
Low Path (10%): Breakdown below 3,440 only possible with heavy institutional exit.
6️⃣ Pullback Levels - Mahindra & Mahindra (M&M)
🔹 Shallow Pullback (3,520–3,500)
Light retracement zone.
Represents healthy rebalancing where price cools before continuation.
Usually bought quickly by institutions.
🔹 Medium Pullback (3,480)
Deeper test of demand.
This level acts as a confirmation base → if held, it proves the trend is still intact.
Ideal for accumulation by stronger hands.
🔹 Deep Pullback (3,440)
Last line of defense.
A close below this level would invalidate bullish momentum.
Low probability unless heavy institutional selling appears.
7️⃣ Final View
Bias: Bullish until 3,440 breaks. Macro path open toward 3,720, but near-term consolidation around 3,500–3,600 is expected.
8️⃣ Essence (Philosophy Line)
“Macro runs strong on GST and festive demand, Micro pauses for breath. Pullbacks are gates to continuation, not collapse.”
9️⃣ Disclaimer
⚠️ This analysis is shared for educational and research purposes only. It is not financial advice, trading advice, or investment recommendation. Market decisions are entirely your own responsibility.
#crown_point_research
#trading_agi
#trading
#stock_market
#crypto
#mahindra&mahindra
MOM trade ideas

M&M - Rising Wedge ( BEAR )Disclaimer:
I am not a SEBI-registered investment advisor. The information provided here is for educational and informational purposes only and should not be construed as financial or investment advice. Please do your own research or consult with a SEBI-registered financial advisor before making any investment decisions. Investments in the securities market are subject to market risks. Read all the related documents carefully before investing.
Current Price: ₹3199.50
✅ RSI (Relative Strength Index)
RSI: 42.42 → Neutral to Slightly Bearish (RSI under 50 suggests weakening momentum, but not yet oversold)
✅ Support and Resistance
Supports:
S1: ₹3152.80
S2: ₹3153.70
S3: ₹3161.00
Price is hovering above strong support zone at ₹3150–3160. Holding this area is crucial to prevent deeper correction.
Resistances:
R1: ₹3203.00
R2: ₹3220.30
R3: ₹3221.00
Very tight resistance zone at ₹3200–3221. Breakout above this range could revive bullish trend, especially above short-term moving averages.
✅ Fibonacci Levels
23.6%: ₹1243.52
38.2%: ₹1661.74
50.0%: ₹1999.75
61.8%: ₹2337.76
78.6%: ₹2819.00
Current price (₹3199.50) is well above 78.6% retracement, suggesting the long-term uptrend is intact, although momentum is currently slowing.
✅ Moving Averages
Short-Term Averages:
EMA5 = ₹3288.57, SMA5 = ₹3311.06 → Price below both → indicates short-term weakness.
EMA9 = ₹3305.35, SMA9 = ₹3342.56 → Bearish short-term structure.
Medium-Term Averages:
EMA20 = ₹3288.10, SMA20 = ₹3279.55 → Price below EMA, but close to SMA → neutral to slightly bearish.
EMA50 = ₹3218.58, SMA50 = ₹3223.84 → Price just below → medium-term trend at risk of reversal.
Long-Term Averages:
EMA100 = ₹3127.36, SMA100 = ₹3090.93 → Price above both → long-term structure still strong.
EMA200 = ₹2993.02, SMA200 = ₹3001.16 → Price comfortably above → confirms overall bullish trend is intact.

RED RED ZONEufff , sorry to say guys , i do only chart analyse , this stock is in deep trouble , starting from almost now , look at prise and rsi on weekly frame, it is going big down ha ,

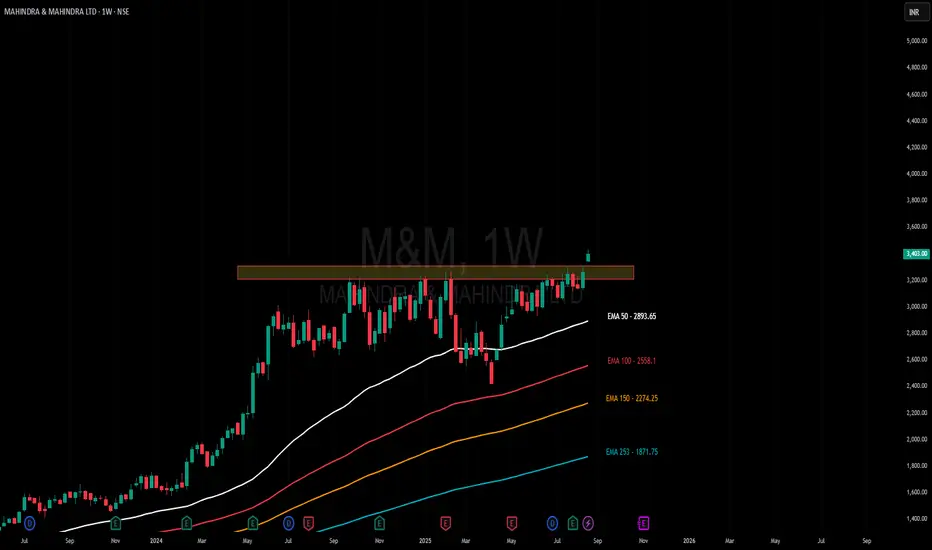
Amazing breakout on WEEKLY Timeframe - M&MCheckout an amazing breakout happened in the stock in Weekly timeframe, macroscopically seen in Daily timeframe. Having a great favor that the stock might be bullish expecting a staggering returns of minimum 25% TGT. IMPORTANT BREAKOUT LEVELS ARE ALWAYS RESPECTED!
NOTE for learners: Place the breakout levels as per the chart shared and track it yourself to get amazed!!
#No complicated chart patterns
#No big big indicators
#No Excel sheet or number magics
TRADE IDEA: WAIT FOR THE STOCK TO BREAKOUT IN WEEKLY TIMEFRAME ABOVE THIS LEVEL.
Checkout an amazing breakout happened in the stock in Weekly timeframe.
Breakouts happening in longer timeframe is way more powerful than the breakouts seen in Daily timeframe. You can blindly invest once the weekly candle closes above the breakout line and stay invested forever. Also these stocks breakouts are lifelong predictions, it means technically these breakouts happen giving more returns in the longer runs. Hence, even when the scrip makes a loss of 10% / 20% / 30% / 50%, the stock will regain and turn around. Once they again enter the same breakout level, they will flyyyyyyyyyyyy like a ROCKET if held in the portfolio in the longer run.
Time makes money, GREEDY & EGO will not make money.
Also, magically these breakouts tend to prove that the companies turn around and fundamentally becoming strong. Also the magic happens when more diversification is done in various sectors under various scripts with equal money invested in each N500 scripts.
The real deal is when to purchase and where to purchase the stock. That is where Breakout study comes into play.
Check this stock which has made an all time low and high chances that it makes a "V" shaped recovery.
> Taking support at last years support or breakout level
> High chances that it reverses from this point.
> Volume dried up badly in last few months / days.
> Very high suspicion based analysis and not based on chart patterns / candle patterns deeply.
> VALUABLE STOCK AVAILABLE AT A DISCOUNTED PRICE
> OPPURTUNITY TO ACCUMULATE ADEQUATE QUANTITY
> MARKET AFTER A CORRECTION / PANIC FALL TO MAKE GOOD INVESTMENT
DISCLAIMER : This is just for educational purpose. This type of analysis is equivalent to catching a falling knife. If you are a warrior, you throw all the knives back else you will be sorrow if it hits SL. Make sure to do your analysis well. This type of analysis only suits high risks investor and whose is willing to throw all the knives above irrespective of any sectoral rotation. BE VERY CAUTIOUS AS IT IS EXTREME BOTTOM FISHING.
HOWEVER, THIS IS HOW MULTIBAGGERS ARE CAUGHT !
STOCK IS AT RIGHT PE / RIGHT EVALUATION / MORE ROAD TO GROW / CORRECTED IV / EXCELLENT BOOKS / USING MARKET CRASH AS AN OPPURTUNITY / EPS AT SKY.
LET'S PUMP IN SOME MONEY AND REVOLUTIONIZE THE NATION'S ECONOMY!
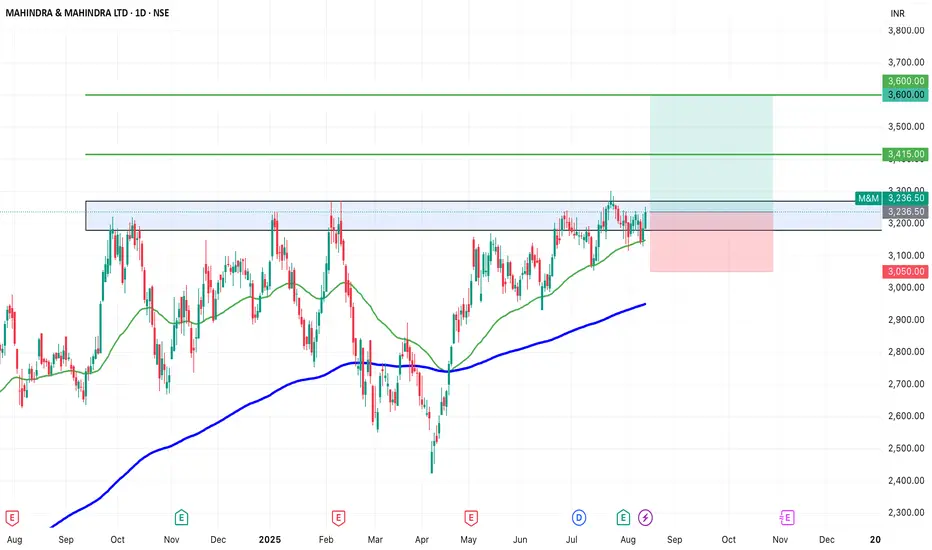
SWING IDEA - M&MM&M , a leading Indian automotive and farm equipment manufacturer, is showing signs of a potential breakout, making it a strong swing trading candidate.
Reasons are listed below :
3,200 resistance tested multiple times — now weakened and primed for a breakout
VCP (Volatility Contraction Pattern) forming, indicating accumulation
Trading above 50 & 200 EMA, confirming long-term trend strength
Inverse Head & Shoulders pattern forming, a bullish reversal setup
Target : 3415 // 3600
Stoploss : daily close below 3050
DISCLAIMER -
Decisions to buy, sell, hold or trade in securities, commodities and other investments involve risk and are best made based on the advice of qualified financial professionals. Any trading in securities or other investments involves a risk of substantial losses. The practice of "Day Trading" involves particularly high risks and can cause you to lose substantial sums of money. Before undertaking any trading program, you should consult a qualified financial professional. Please consider carefully whether such trading is suitable for you in light of your financial condition and ability to bear financial risks. Under no circumstances shall we be liable for any loss or damage you or anyone else incurs as a result of any trading or investment activity that you or anyone else engages in based on any information or material you receive through TradingView or our services.
@visionary.growth.insights
M&M | Buy @3280 | SL below 3100 | Target 3960Disclaimer:
This is not financial advice. Please do your own research or consult with a financial advisor before making any investment decisions. Investments in stocks can be risky and may result in loss of capital.
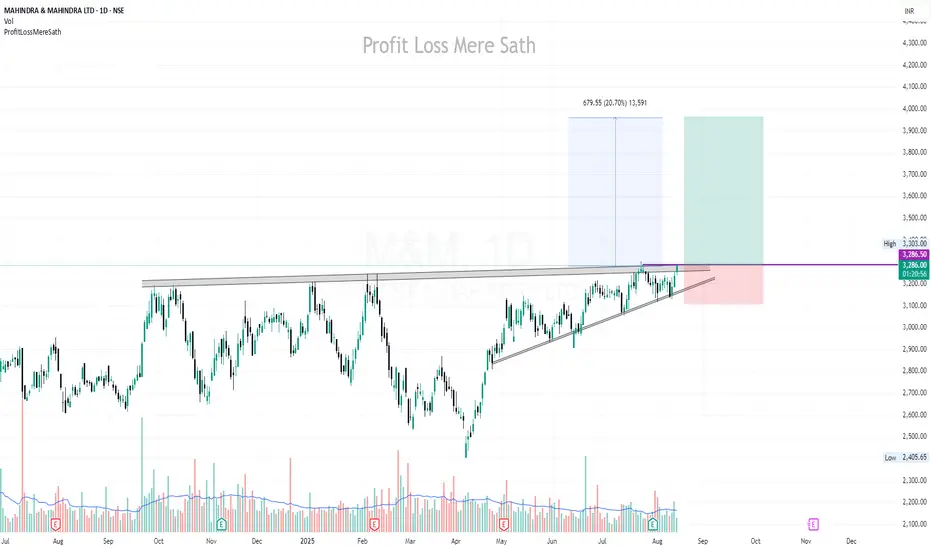
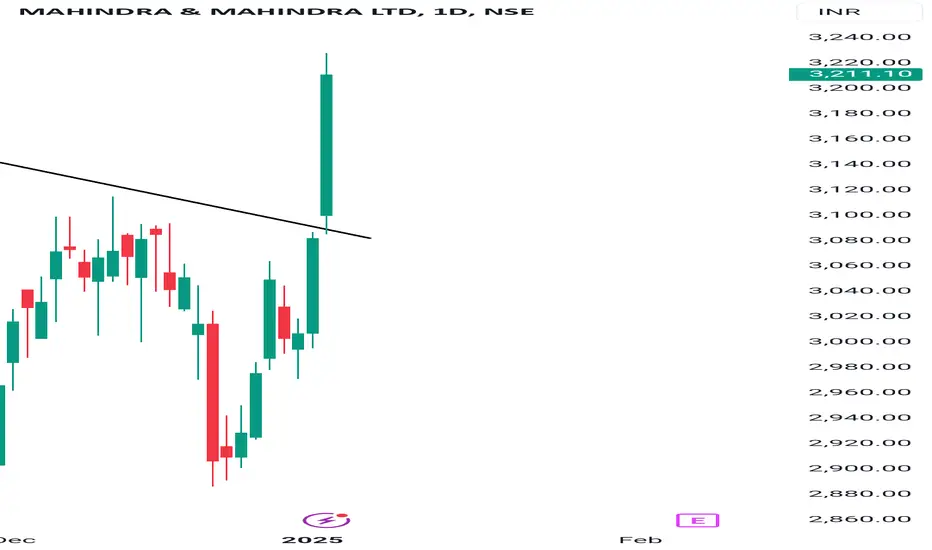
M&M (Breakout/Swing):M&M (Breakout/Swing):
M&M is getting ready to pass through the last 1 year's supply zone.
Signs of significant base formation is evident.
Trade offers a RR of more than 1:3.
Check out my earlier views for a better understanding.
Note: Do your own due diligence before taking any action.
M&MStock price has not crossed 3200 level and sustained. As marked on the chart it has taken resistance around 3200 level 4 times. As of now stock price is trading above 30min, 1hr and 4hr 200 ema.
Seems like price is sustaining near 3150 to 3200 zone. This is just an observation of price behaviour and no buying or selling recommendations.


M & MBuy @ cmp - 3220
Stoploss - 2933.60
Target - 3777.10
3494.90
3575.75
3685.45
Happy Trading.
Jail Hind

Mahindra & Mahindra : Sitting at a Red band resistance Mahindra & Mahindra : Sitting at a Red band resistance
( Not a Buy / Sell Recommendation
Do your own due diligence ,Market is subject to risks, This is my own view and for learning only .)

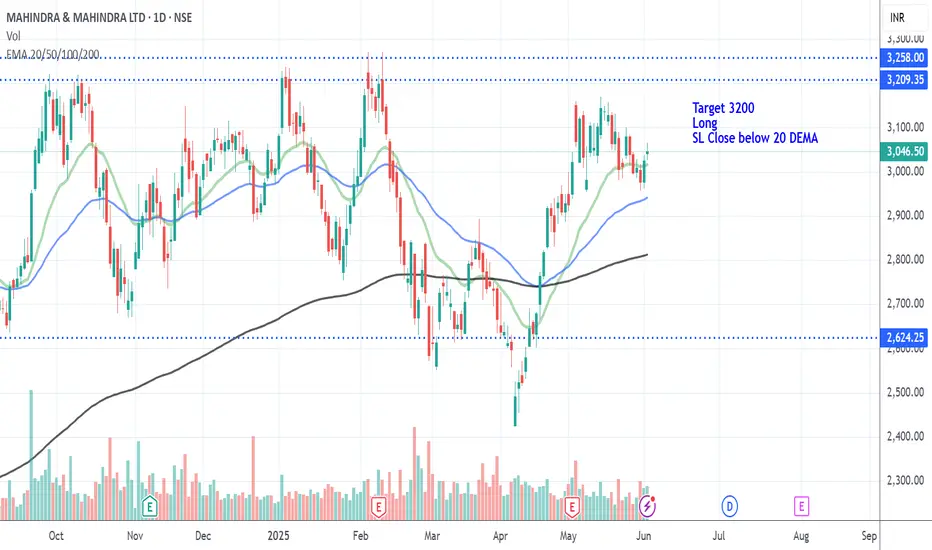
M&M LongM&M Long
Price Crossed above 20DEMA.
20 DEMA> 50 DEMA> 200 DEMA
Looks good for long with 3200 Target
SL- Close below 20 DEMA
Disc: Education Purpose only
M&M -Mahindra & Mahindra Ltd. (2 hours chart, NSE) - LongM&M -Mahindra & Mahindra Ltd. (2 hours chart, NSE) - Long Position; short-term research idea.
Risk assessment: Medium {volume structure integrity risk}
Risk/Reward ratio ~ 4.78
Current Market Price (CMP) ~ 2935
Entry limit ~2930 to 2910 (Avg. - 2920) on April 30, 2025
1. Target limit ~ 3015 (+3.25%; +95 points)
2. Target limit ~ 3135 (+7.36%; +215 points)
Stop order limit ~ 2875 (-1.54%; -45 points)
Disclaimer: Investments in securities markets are subject to market risks. All information presented in this group is strictly for reference and personal study purposes only and is not a recommendation and/or a solicitation to act upon under any interpretation of the letter.
LEGEND:
{curly brackets} = observation notes
= important updates
(parentheses) = information details
~ tilde/approximation = variable value
-hyphen = fixed value

M&Mi Observed these Levels based on Price Action and Demand & Supply which is my own Concept "PENDAM CONCEPTS"... Please don't take any trades based on this chart/post... Because this chart is for educational purpose only not for Buy or Sell Recommendation... Thank Q

Bearish View On Mahindra & Mahindra Mahindra & Mahindra Ltd is one of the most diversified automobile company in India with presence across 2-wheelers, 3-wheelers, PVs, CVs, tractors & earthmovers.
It also has presence across financial services, auto components, hospitality, infrastructure, retail, logistics, steel trading and processing, IT businesses, agri, aerospace, consulting services, defence, energy and industrial equipment through its subsidiaries and group companies.
It was incorporated in 1945 by Ghulam Mohammad and two Mahindra Brothers (KC & JC Mahindra) and was later renamed as Mahindra & Mahindra in 1948.

Levels to watch out Based on the intrinsic value analysis, Mahindra and Mahindra Ltd. (M&M) is currently overvalued. With an intrinsic value of 1,633 per share and a market price of 2,665, the stock is trading at a premium of about 39%. This suggests that M&M does not present an attractive investment opportunity at these levels.
Given my outlook for the Nifty index to correct in the coming weeks, I believe many stocks, including M&M, are overvalued and may face downward pressure. Investors who chase these stocks by buying into strength or during market dips could be setting themselves up for a bear trap.
Instead, I plan to begin accumulating M&M shares in the range of 1,700 to 2,100. I see potential for new highs in the long-term, but only after the stock has corrected to more reasonable levels.

Buyb M&M @ 3100-3200 range for target 3800 & 5000 .cup and handle pattern on dalily chart makes it strong .
market is still struggling to get out but this is just bullish

Mah&Mah analysisI have analyzed M&M using different Gann technique and time frame. And today is the result. Stop loss will be yesterday high.

M&M trading reversal zone for up side M&M trading reversal zone for up side will see ... if sustain and retest the zone

Amazing breakout on Weekly / Daily Timeframe - M&MCheckout an amazing breakout happened in the stock in Weekly timeframe, macroscopically seen in Daily timeframe. Having a great favor that the stock might be bullish expecting a staggering returns of minimum 25% TGT. IMPORTANT BREAKOUT LEVELS ARE ALWAYS RESPECTED!
NOTE for learners: Place the breakout levels as per the chart shared and track it yourself to get amazed!!
#No complicated chart patterns
#No big big indicators
#No Excel sheet or number magics
TRADE IDEA: WAIT FOR THE STOCK TO BREAKOUT IN WEEKLY TIMEFRAME ABOVE THIS LEVEL.
Checkout an amazing breakout happened in the stock in Weekly timeframe.
Breakouts happening in longer timeframe is way more powerful than the breakouts seen in Daily timeframe. You can blindly invest once the weekly candle closes above the breakout line and stay invested forever. Also these stocks breakouts are lifelong predictions, it means technically these breakouts happen giving more returns in the longer runs. Hence, even when the scrip makes a loss of 10% / 20% / 30% / 50%, the stock will regain and turn around. Once they again enter the same breakout level, they will flyyyyyyyyyyyy like a ROCKET if held in the portfolio in the longer run.
Time makes money, GREEDY & EGO will not make money.
Also, magically these breakouts tend to prove that the companies turn around and fundamentally becoming strong. Also the magic happens when more diversification is done in various sectors under various scripts with equal money invested in each N500 scripts.
The real deal is when to purchase and where to purchase the stock. That is where Breakout study comes into play.
LET'S PUMP IN SOME MONEY AND REVOLUTIONIZE THE NATION'S ECONOMY!

M&M at a Breakout Crossroad! Will the Bulls Take Charge?Mahindra & Mahindra Ltd (M&M) is gearing up for its next big move as it consolidates within a symmetrical triangle pattern. With the stock trading well above its 200-day moving average, the long-term uptrend is intact. Will M&M break above ₹3,100 and rally to new highs, or will bears push it below ₹2,950?
👉 Resistance: ₹3,100
📢 Keep an eye on the volume—it will reveal the winner in this battle! Let us know your thoughts in the comments below. Are you bullish or bearish on M&M? 🚦

