What A Shocker That Would Be Huh?Blackrock, Saylor and gang are in for some big gains. As for most of you who sold you're in for a rude awakening!
Trade ideas
MSFT 1HR 11/18/2025Description of the Chart
This analysis is shared strictly for educational purposes and is not financial advice. It is intended to illustrate chart-reading techniques, structure mapping, and scenario planning.
The chart is a 1-hour price chart of Microsoft Corp. (MSFT) with technical analysis markings focused on an ABCD harmonic pattern, bearish momentum, and downside targets.
Main Pattern (ABCD Structure)
The chart shows an ABCD harmonic setup:
(A) – a swing high
(B) – a swing low
(C) – a lower high
(D) – a deeper low completing the harmonic pattern
You’ve labeled the full structure with orange lines showing the ABCD sequence.
Fibonacci Arc / Fib Levels
From point C, a rainbow-colored Fibonacci arc cluster is drawn downward toward the D area.
These levels overlap the price action around (D), marking potential retracement and continuation zones.
Entry Zone + Bearish Breakout
The chart marks an ENTRY point just after price hits (D).
There is a red rectangular zone labeled BEARISH BREAKOUT showing where price broke below support.
A 1st Target is indicated directly underneath this breakout zone.
Negative Pressure Zone
Above point (C), there is an orange dashed outline labeled:
“negative pressure”
This signifies bearish pressure preventing upward continuation likely indicating failing bullish momentum.
Targets Failed
To the right of point C, a dashed orange line says “TARGETS FAILED”, suggesting expected bullish continuation levels above were not reached.
EPS Levels / Resistance Lines
Labeled as EPS, possibly upcoming earnings or expected price zones.
Support Zone Around D
A red dashed support line runs across the chart near point (D).
Price breaks below this area, confirming the bearish structure.
Downside Targets
1ST Target
Marked in orange, located just beneath the bearish breakout area.
SECOND TARGET
A large orange box in the lower part of the chart, around the 400–420 USD region.
This is a deeper bearish target zone.
Other Elements
Current price is shown near 492.50.
RSI (Relative Strength Index) indicator box shows 36.98 RSI, indicating weakening momentum.
Summary
The chart shows a bearish ABCD harmonic pattern completing at (D).
After the completion, price breaks downward into a bearish breakout zone, triggering a short entry toward:
Target 1 (short-term)
Target 2 (major bearish zone around 400–420)**
Upward continuation levels (“EPS”) failed due to negative pressure around point (C).
NOT

Nvidia’s Pre-Earnings Harmonic Setup - Do Technicals Work?Coming off our recent conversation about technicals vs. fundamentals—and a great question from you guys about whether technicals work the same in every market—I wanted to take a minute to clear something up: Yes, technicals absolutely work across all markets. The same historical patterns have been repeating since the beginning of time.
BUT… it’s just as important to remember that every market has its own personality. And because of that, certain trading styles or patterns will naturally perform better in some markets than others. The principles stay the same, but the behavior you’re applying them to can look very different.
For example, one of the styles I gravitate toward is harmonic patterns. They tend to show up during periods of consolidation, and with Nvidia currently tightening up ahead of earnings this Wednesday, it’s no surprise we’ve got one forming right now.
If you have any questions, comments, or want to share your ideas, please feel free to leave them below.
Akil

Microsoft Approaches Key Level, Expands Xbox Design Lab GloballyMicrosoft has announced a major expansion of its Xbox Design Lab through a new global partnership with ESW, significantly widening its international ecommerce footprint. Xbox Design Lab allows gamers to create personalized Xbox Wireless Controllers and Elite Series 2 controllers. With ESW now serving as the Merchant of Record, Xbox can efficiently handle cross-border payments, logistics and compliance, key components for scaling internationally.
The relaunch extends Xbox Design Lab access to 27 countries, including major markets across North America, Europe and APAC. Countries such as the U.S., Canada, Japan, Singapore, Australia, South Korea, Germany and the U.K. are all included in the upgraded rollout. ESW’s ecommerce infrastructure also enables Microsoft to customize checkout flows and streamline international operations under tight timelines. A joint roadmap promises expanded payment options and future global growth.
This move strengthens Xbox’s global branding at a time when personalization and gamer-focused experiences are becoming central to console ecosystems. With Xbox hardware sales stabilizing and Game Pass continuing to anchor recurring revenue, this expansion supports Microsoft’s broader gaming strategy. It also enhances Xbox’s competitive positioning against Sony by offering deeper personalization options and global accessibility. Fundamentally, Microsoft remains a high-margin, high-cash-flow giant with strong performance across cloud, AI, enterprise software and gaming, making this expansion another bullish development.
Technically, Microsoft’s stock maintains a long-term bullish structure. Price is currently trading near $505, trading towards $465 support zone after pulling back from the $555 high. The chart shows clean support and resistance levels that act as strong levels. As long as this $465 support holds, the larger bullish structure remains intact.
If buyers defend the $640–$660 region, a rebound toward $813 becomes the next upside target. A breakout above that level could lead to fresh all-time highs. If support breaks, next levels sit at the trendline near $600 or deeper support around $550. Overall bias remains bullish.
MSFT WARNING!Here is a closer view of the chart I posted back on Oct 5, 2024, for a nice profitable -25% drawdown.
This time will be far more profitable.
Here is a breakdown of the chart.
- Up against a 38-year trendline.
- A rare 5-wave rising wedge.
- A H & S with a head test
- Big Ass Gap Below
- Double top M pattern that CRACKED!
- Rising Bearish Wedge.
This is just getting started!
Bulls, if you didn't make your money in MSFT yet and are trying to squeeze a little bit more profits bc you are too damn greedy. Then you deserve what you get next.
THANK YOU for getting me to 5,000 followers! 🙏🔥
Let’s keep climbing.
If you enjoy the work:
👉 Boost
👉 Follow
👉 Drop a solid comment
Let’s push it to 6,000 and keep building a community grounded in truth, not hype.

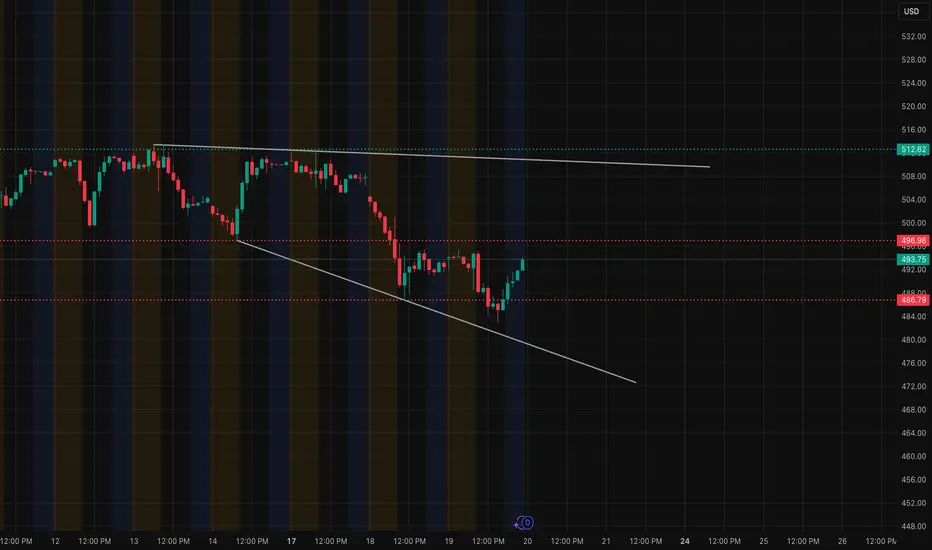
MSFT at a Turning Point – Key Levels to Watch for Nov. 201-Hour Outlook
MSFT has been in a clean down-channel, but today's late-session recovery finally broke above the short-term lower trendline. Price is now pushing into a critical resistance zone around $502–$505, which has rejected multiple times this week.
Key levels from the 1-hour structure:
* First resistance: $498.50
* Main rejection zone: $502–$505
* Bull breakout confirmation: $510 → opens $513–$515
* Downside support: $490, then $485
Momentum is improving — MACD is curling up and the candle structure is shifting away from heavy sell pressure. But MSFT still needs to reclaim $502.50 with conviction before bulls gain control for tomorrow.
1-Hour Bias:
Cautiously bullish if above $498.50, but still inside a larger downtrend unless $502–$505 breaks.
15-Minute Outlook (For Traders)
Short-term price action shows MSFT breaking out of a wedge and retesting the breakout cleanly around $493–$494. Strong impulsive candles came in after the retest.
What matters for tomorrow:
* As long as MSFT holds above $493–$494, buyers can push into $498–$500.
* A clean move through $500 → $502.50 would trigger momentum traders.
* If MSFT rejects early at $498–$500, expect a pullback to $490–$492.
15-Min Trading Thoughts:
* Bull setup: Pullback to $494–$496 with bounce confirmation → targets $500 / $502.
* Bear setup: Rejection at $502–$505 → targets $492 then $488.
Momentum is stronger on the 15-min chart than the 1-hour, which means MSFT has room to squeeze early but may struggle at $502–$505 unless volume shows up.
How GEX Supports the Levels
From the GEX (Gamma Exposure) chart:
Bullish elements:
* Highest positive call interest sits above $510–$515, meaning if MSFT breaks $505, market makers hedge by buying → upward acceleration.
* Light resistance around $500–$502, so price can push into that zone easily.
Bearish elements:
* Strong negative GEX / put support at $485, acting as the floor for the week.
* Heavy put walls between $480–$485, making breakdowns less likely unless market-wide selling hits.
GEX Summary:
* Break $505 → path to $510–$513 opens quickly.
* Lose $490 → hedging pressure drives it toward $485.
Option Trading Suggestions Based on GEX
For tomorrow's session:
Bullish Idea
If MSFT breaks and holds over $502.50:
* Consider 505C or 510C, same-week expiration.
* Safer choice: Next-week 510C (less decay).
Reason: GEX shows low resistance between $505 → $510.
Bearish Idea
If MSFT rejects $502–$505 early:
* Consider 495P or 490P.
* Conservative approach: next-week 490P.
Reason: Price tends to fade back into the $492–$488 pocket when the breakout fails.
Final Thoughts
MSFT is at a key pivot zone. Both 1-hour and 15-minute charts show recovery momentum, but the chart won’t turn fully bullish unless $502.50–$505 breaks. Expect volatility around that zone tomorrow.
Disclaimer
This analysis is for educational purposes only and is not financial advice. Always manage risk and trade with a plan.
MSFT Selling Pressure Activated — Time to Short!🔥 MSFT Bearish Profit Playbook — Thief-Style Layer Attack Activated! 🔥
Asset: MSFT — Microsoft Corporation (NASDAQ)
Style: Swing / Day-Trade Playbook 📉💼
📉 Plan: Bearish Pressure Play — Smart Sell-Side Thief Approach
Microsoft is showing potential exhaustion on the upside, and this setup focuses on a structured bearish move using a layered sell-limit strategy (Thief Layer Method) 😎🕵️♂️.
🎯 Entry Strategy (Thief Layer Method)
Using the thief-style multi-layer approach, we stack multiple sell-limit orders at different levels to catch premium liquidity:
Sell Limit Layers:
$500, $490, $480
(You can increase or adjust layers based on your own risk tolerance.)
This method aims to fade upward pushes, catching price exhaustion during liquidity grabs.
🛑 Stop Loss (Risk Control)
This is the Thief SL @ $510 🛑
Note: Dear Ladies & Gentlemen (Thief OG’s), I’m not recommending that you use only my stop-loss. It’s your money — your rules. Manage your risk like a pro. 💼⚠️
🎯 Target (Exit Zones)
We are aiming toward strong support zones + potential oversold zones where bearish momentum may slow.
Main Target: $450
Trap may form — escape with profits before the market police catch us 🚓💨
Note: Dear Ladies & Gentlemen (Thief OG’s), I’m not recommending using only my target. Exit where you feel safe and profitable. 🏦✨
📊 Market Summary (Clean, TV-Safe Explanation)
Bearish attempt based on overextended zones
Layered entries help clip premium during upside wicks
Targeting liquidity pockets near support
SL above structural invalidation
Setup respects TradingView House Rules: No financial advice, no promises, no signals, educational thief-style humor only ✔️
🔗 Related Pairs to Watch (Correlation Insights)
Because MSFT is a heavyweight in tech + NASDAQ index weighting:
1️⃣ NASDAQ:QQQ (NASDAQ 100 ETF)
Strongly correlated
If QQQ rejects from local resistance → MSFT bearish play strengthened
QQQ weakness = tech sector weakness
2️⃣ AMEX:SPY (S&P500 ETF)
Broader market risk sentiment
SPY pullback often pressures mega-caps like MSFT
3️⃣ NASDAQ:AAPL (Apple Inc.)
Moves similarly during liquidity rotations
Apple weakness = added pressure to mega-cap tech basket
4️⃣ NASDAQ:NVDA (Nvidia Corp.)
High-beta tech name
When NVDA loses momentum, MSFT downside probability increases through sector rotation
5️⃣ NASDAQ:GOOGL (Alphabet Inc.)
If large-cap tech corrects collectively, MSFT rarely moves opposite
Perfect correlation watch ⚡
Watching these pairs helps confirm bearish bias through sector-wide confirmation, not isolated signals.
✨ “If you find value in my analysis, a 👍 and 🚀 boost is much appreciated — it helps me share more setups with the community!”
⚠️ Disclaimer:
This is a thief-style trading strategy just for fun.
Educational only — not financial advice. Trade at your own risk. 😄🕵️♂️

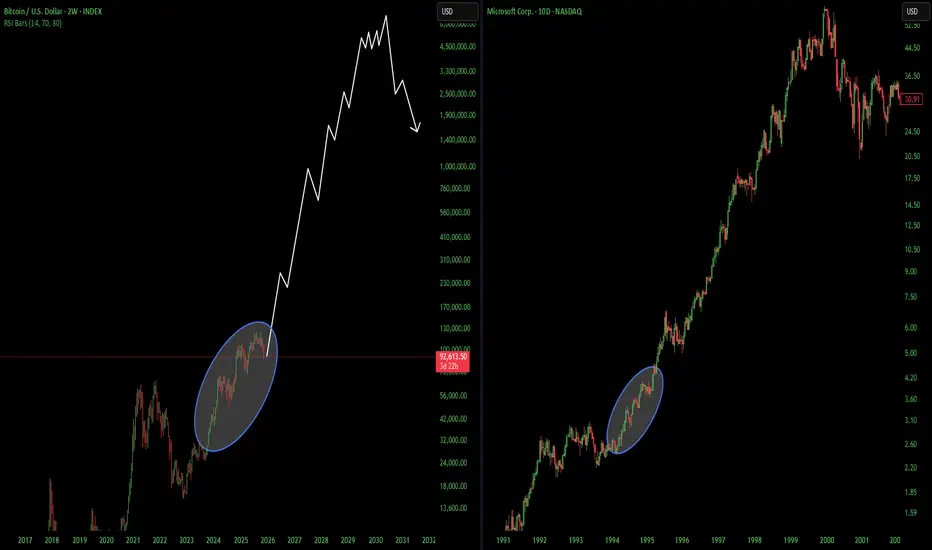
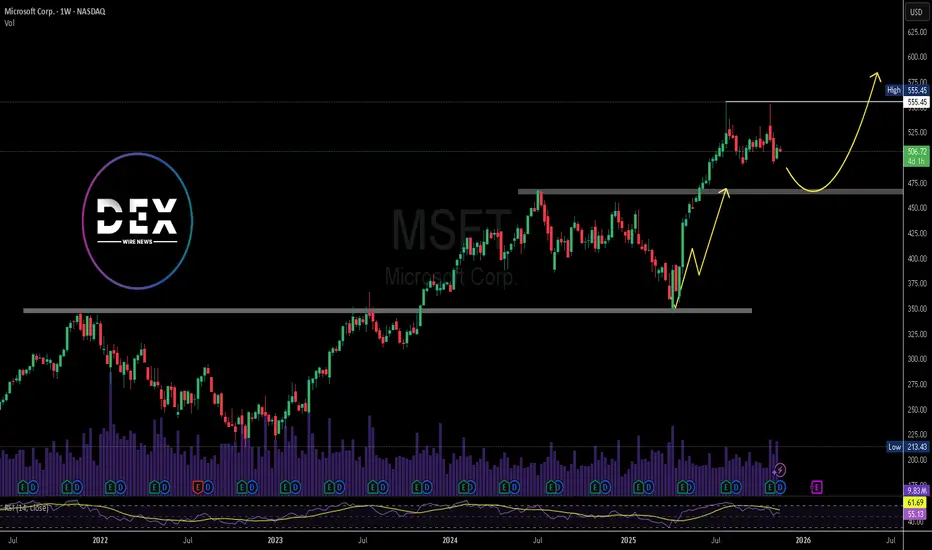
MSFT: Final Dip Before the Next LeapPrevious Idea:
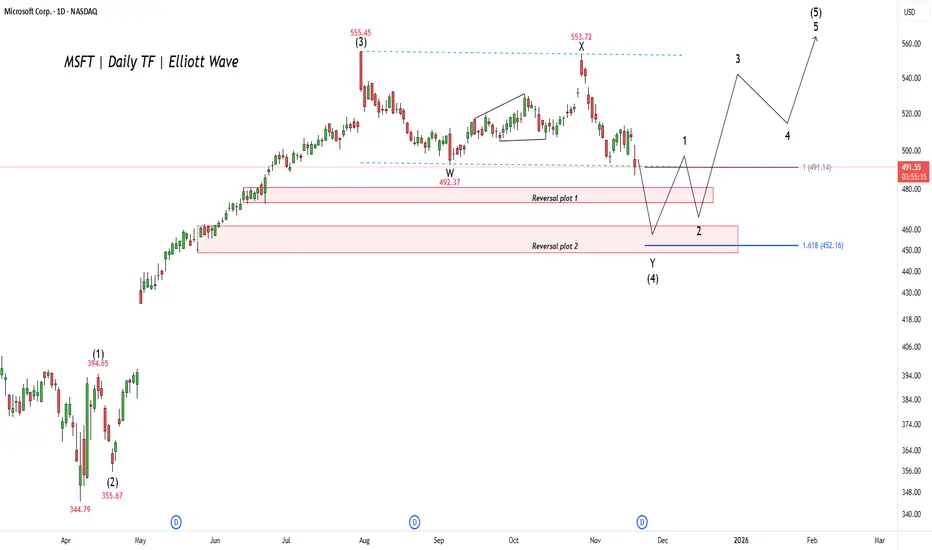
Microsoft (MSFT) shows the stock is enduring a significant correction, which is the final pullback before a massive rally. This phase, labeled wave (4), is expected to find its bottom within a key support area. Traders are looking for this downswing to complete anywhere between the $452 and $492 zones. Hitting this target range would conclude the current multi-month drop and clear the path for the next major advance.
Once the correction successfully bottoms out in that crucial support range, the market expects a powerful final bullish surge, known as wave (5), to begin. This next wave is projected to drive the stock significantly higher, easily surpassing the previous all-time high of $555.45 . This bullish scenario will remain valid as long as the stock respects the identified support zone and begins its ascent from that area.
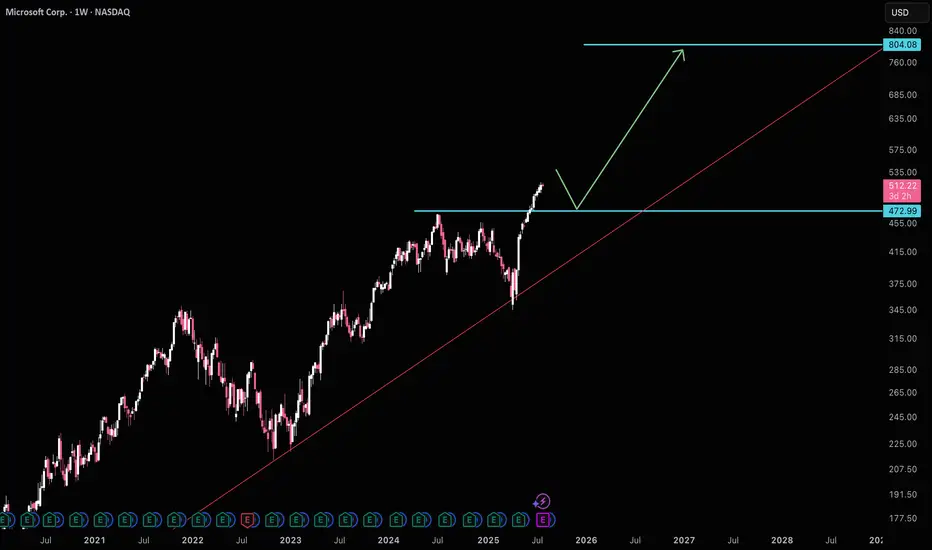
Mircrosoft wants to pullback to $470MSFT is likely to test $470 support before making it's move to $800. Another thing to be weary about is ratio MSFT/AAPL is at historical avg highs, which usually signals a bias towards AAPL. Waiting for $470 is a good idea before getting long again.
Good luck!
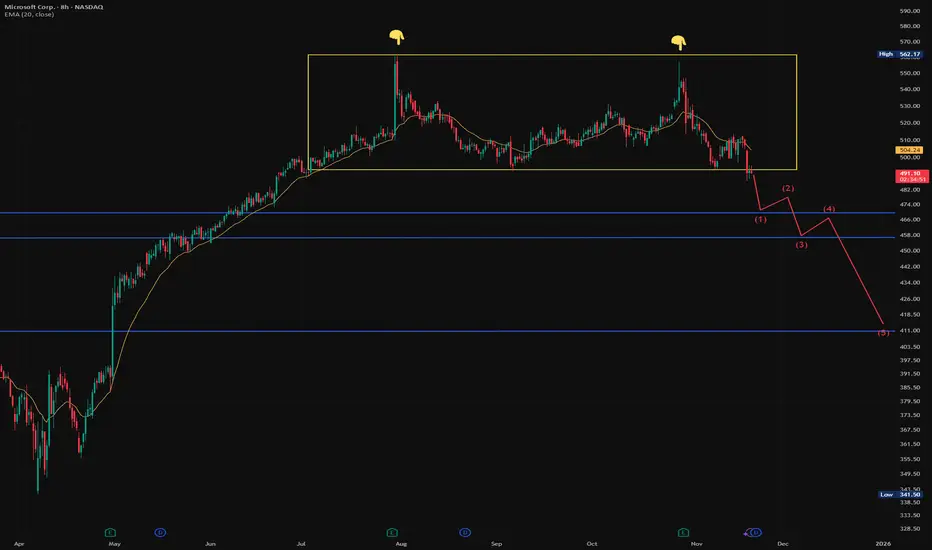
$MSFT likely heading lower soon.Microsoft has received some downgrades recently, has a clear double top, and now a breakdown through the lower end of the range.
Not sure yet how deep this move runs, but (1), (3), and (5) remain the immediate downside targets.
I’ll be playing this tighter than usual given we’re entering seasonal bullishness. Not sure it shows up this year, but it’s something to stay aware of.
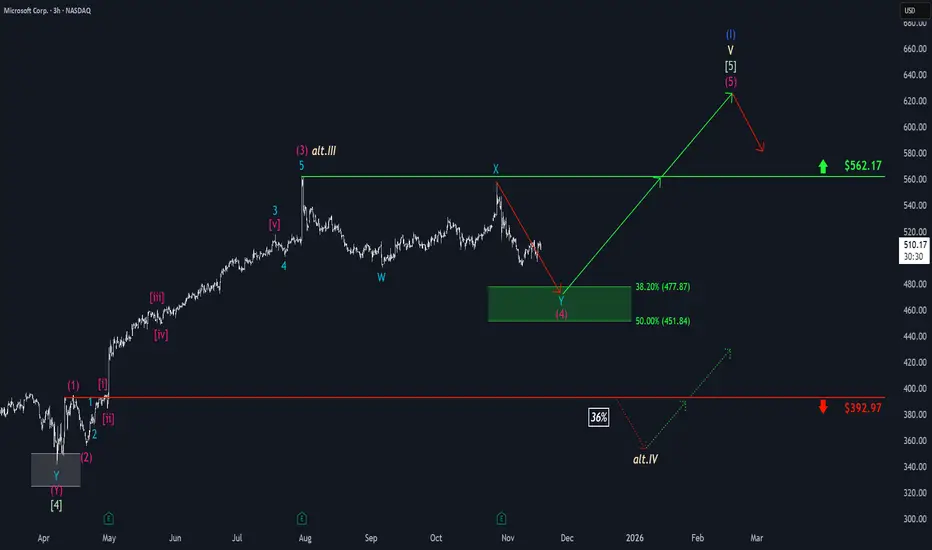
Microsoft: Stuck in Sideways PatternMicrosoft shares have continued to show weakness recently, although the stock has shifted into more of a sideways pattern. In the near term, we anticipate another downward move, which should establish the low for wave (4) in magenta within our green Target Zone between $477.87 and $451.84. From our perspective, this range remains attractive for long entries, as we expect a new upward impulse to follow as part of magenta wave (5). This move should push the stock above resistance at $562.17 and complete the larger blue wave (I). Alternatively, there is a scenario in which the high at $562.17 marks the end of beige wave alt.III (probability: 36%). In that case, we would expect a substantial decline below support at $392.97, where the low of wave alt.IV would be found.
MSFT Bounce or Flush?The daily trend is already broken, but the broader uptrend is intact which often produces a short-term bounce before a larger directional move unfolds
Price broke the 50d MA with conviction, attempted to reclaim it & was rejected, so now price is slightly below it around $509-$514
Volume is not confirming that there are strong buyers so the daily trend is weak
RSI & stoch both suggest no bullish divergence, or trend reversal
This is the kind of bounce typically precedes a continuation down
A bearish bias exists; unless, MSFT reclaims $520+
$505 is the first trapdoor & below it, $495-$500, then possibly $480-$485
MSFT is below the 50d MA, trend is weakening, momentum is bearish, but looking at the weekly chart, MSFT is still above it's long-term trend line which means, bounce or flush
Quick bounce into the 50d MA ($515-$518), then reject & drop lower (50%) since the daily shows clear oversold momentum, weekly support intact & the 50d MA should be tested (in all sets the typical scenario for a dead-cat bounce)
Immediate breakdown below $508 with a slide to $495-$500 (35%) given the RSI <50, weak volume on up days, lower highs & market indecision ahead of NVDA
Full reversal, reclaim $520 & retest $530-$540 (15%), but would require a decisive move above the 50d MA & strong buying volume
The daily chart is bearish, while the weekly chart shows a big support level is close, so expect a resolution soon on MSFT's directional outcome
NASDAQ:QQQ AMEX:SPY

Microsoft Wave Analysis – 20 November 2025- Microsoft broke support levels 500.00, 490.00
- Likely to fall to support level 465.00
Microsoft recently broke the support zone between the support levels 500.00, 490.00 (low of wave A from September) and the 38.2% Fibonacci correction of the upward impulse from April.
The breakout of this support zone accelerated the C-wave of the active ABC correction (4) from July.
Microsoft can be expected to fall further to the next support level 465.00, target price for the completion of the active C-wave.

Global Trade Imbalance1. Why Do Trade Imbalances Occur?
1.1 Differences in Savings and Investments
A fundamental reason for trade imbalance is the difference between a country’s savings and investment levels.
Countries like China, Germany, and Japan tend to save more than they invest domestically. The excess savings flow into international markets and allow these countries to run large surpluses.
Countries like the United States, the U.K., and India generally invest more than they save, leading to deficits.
In simple terms:
A country with low savings must borrow from abroad, financing imports and creating a trade deficit.
This relationship between savings, investment, and trade is at the heart of global imbalances.
1.2 Cost Competitiveness and Productivity Differences
Countries with high productivity, strong manufacturing bases, and efficient logistics tend to export more.
For example:
China has a massive manufacturing ecosystem, leading to high export capacity.
Vietnam and Bangladesh excel in low-cost manufacturing such as textiles.
Germany dominates premium engineering goods like automobiles and industrial machinery.
Countries that cannot compete in global manufacturing rely on imports, causing deficits.
1.3 Exchange Rates and Currency Policies
Exchange rates influence trade flows significantly.
If a country’s currency is undervalued, its exports become cheaper and more competitive, boosting surpluses.
If a country’s currency is overvalued, imports become cheaper and exports fall, increasing deficits.
Some countries intentionally manage their currencies to maintain export competitiveness. For instance, China has often been accused of keeping the yuan undervalued in the past to support exports.
1.4 Global Supply Chains
Modern production is globally fragmented. One product may involve dozens of countries.
Example:
An iPhone assembled in China contains parts designed in the U.S., Japan, Taiwan, Korea, and Germany. The final assembly stage inflates China’s export numbers even though value is created elsewhere.
This creates distorted imbalances, where the country doing final assembly appears to run a huge surplus, even if the true value-added is smaller.
1.5 Commodity Dependency
Countries that rely heavily on imported commodities (oil, gas, metals, food) often run deficits.
India imports crude oil, gold, and electronics, contributing to its trade deficit.
Saudi Arabia and UAE export oil and run large surpluses.
Commodity price swings can dramatically shift trade balances.
2. How Trade Imbalances Persist
Trade imbalances are not always corrected naturally. Several mechanisms reinforce them.
2.1 Capital Flows
Countries with deficits attract foreign capital to finance them.
The U.S. attracts investment due to its dollar dominance and strong financial markets.
Developing countries attract foreign investment when their markets offer higher returns.
These capital inflows allow deficits to persist for decades.
2.2 Reserve Accumulation and Export-Led Growth
Surplus countries sometimes accumulate massive foreign exchange reserves to stabilize their currencies and maintain export competitiveness.
China and Japan hold trillions of dollars in foreign reserves.
This allows them to keep exporting and running surpluses without strong currency appreciation.
2.3 Structural Economic Factors
Long-term differences in:
demographics
technology
industrial structure
labor productivity
consumption patterns
can keep trade imbalances persistent. For example, aging populations in Europe and Japan reduce consumption and increase savings, maintaining surpluses.
3. Effects of Global Trade Imbalance
3.1 Currency Pressure
Large deficits tend to weaken a country’s currency over time.
Weak currencies make imports more expensive and exports more competitive, which eventually corrects imbalances—but often slowly.
Surplus countries face pressure for their currencies to appreciate, reducing competitiveness.
3.2 Debt Accumulation
Countries with long-term trade deficits may accumulate foreign debt.
The U.S. is the world’s largest debtor, financing its trade deficit through global capital inflows.
Some developing countries face crises when deficits become unsustainable, leading to IMF bailouts.
3.3 Global Financial Instability
Large imbalances can contribute to global economic crises.
Example:
Before the 2008 financial crisis, the U.S. ran huge deficits while China, Japan, and oil-rich nations accumulated surpluses. The recycled surplus money flowed into U.S. financial markets, creating bubbles.
3.4 Trade Wars and Protectionism
Persistent imbalances can lead to political and strategic tensions.
The U.S.–China trade war was partly driven by the U.S.’s large deficit with China.
Tariffs, quotas, and trade barriers are often introduced to address imbalances, but they may worsen global growth.
3.5 Impact on Employment and Manufacturing
Large deficits can result in:
loss of manufacturing jobs
deindustrialization
unemployment in certain sectors
widening wage inequality
Meanwhile, surplus nations often experience booming export industries and rising employment.
4. Are Trade Imbalances Always Bad?
Trade imbalances can be harmful or perfectly healthy, depending on their nature.
Healthy Imbalances
Fast-growing countries import more machinery and capital goods.
Countries with young populations naturally consume more.
Surplus countries save more due to aging demographics.
Unhealthy Imbalances
Caused by currency manipulation
Resulting from weak domestic demand
Leading to excessive indebtedness
Triggering geopolitical tensions
The key is whether the imbalance is sustainable.
5. Solutions to Reduce Global Trade Imbalances
5.1 Exchange Rate Adjustments
Allowing currencies to move freely can naturally reduce imbalances.
5.2 Increasing Domestic Consumption in Surplus Countries
Surplus economies like China and Germany can:
strengthen social welfare systems
encourage investment
reduce reliance on exports
5.3 Boosting Domestic Production in Deficit Countries
Deficit nations can:
invest in manufacturing
support high-tech industries
reduce import dependency
5.4 Balanced Global Financial Flows
Reforms in global financial markets can reduce unnecessary capital movements that fuel imbalances.
5.5 Trade Agreements and Cooperation
Fair trade rules, tariff reductions, and collaboration through bodies like the WTO can help ensure more balanced trade.
Conclusion
Global trade imbalances are a natural part of the international economic system, but large and persistent imbalances can create economic, political, and social challenges. They reflect deeper structural factors like savings levels, competitiveness, exchange rates, demographics, and financial flows. While not inherently harmful, imbalances must be managed carefully to avoid instability, reduce inequality, and sustain long-term global growth.

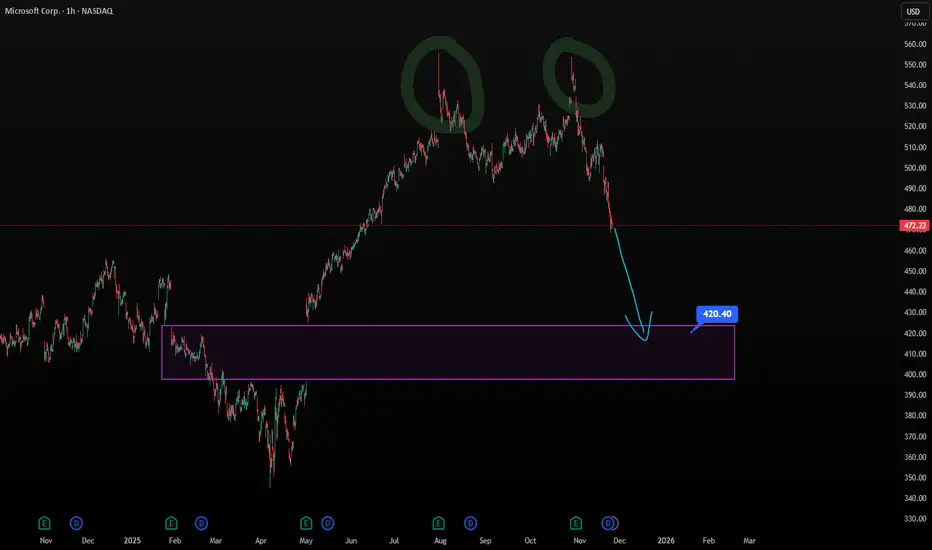
Midterm Stock Forecast for MicrosoftNASDAQ:MSFT appears set for a healthy correction from $472 to $420, consistent with H1 overextension and cooling RSI. Despite powerful fundamentals—Azure growth, AI integration, and strong enterprise demand—the stock is pricing in perfection. A move to $420 would offer a balanced risk-reward area as markets reassess AI monetization timelines.
Has $MSFT topped? NASDAQ:MSFT looks like it has put in a top up at the $555 level.
This is actually one of the most bearish looking charts as I think there's potentially a longer term top being put in here.
I think it's possible that price goes to at least the $287 level, but potentially all the way down to the lower supports in the low $100s before it can see a sustained bounce.

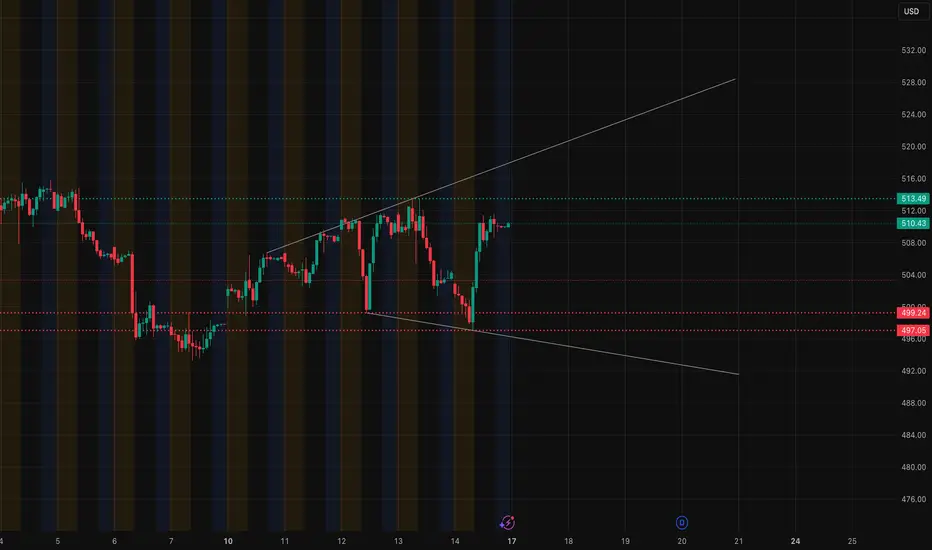
MSFT – Price Action Tightening Into a Decision Zone (11/17)MSFT has been trading in a strangely controlled rhythm these last few sessions. It keeps pressing into the same resistance band around 510–513, fails, dips into demand around 498–500, and snaps back with force. When I line up the 1H structure, the 15M flow, and the GEX positioning, it paints a very clear picture: MSFT is preparing for a real move, it just hasn’t chosen a side yet.
I’ll walk through how I’m looking at it.
1️⃣ 1-Hour Chart — A Tight Compression Between Two Walls
On the 1H, MSFT has been respecting a rising trendline while continuously getting capped under the 510–513 band. Price keeps pushing into that ceiling but never fully breaks through. That alone tells me sellers are defending this zone aggressively.
But on the flip side, buyers haven’t stepped away either. Every time MSFT flushes into the 498–500 area, it gets bought almost instantly. It’s almost mechanical.
So the 1H picture is simple:
* Pressure building under 510–513
* Strong buy response at 498–500
* Trendline rising underneath
When you see that combination, it usually means the breakout will be clean once it finally triggers.
2️⃣ 15-Minute Chart — Intraday Rotation Shows Intent
The 15M chart adds more detail. Right now, MSFT is trading inside yesterday’s freshly formed supply zone near 512–513, where multiple bearish FVGs stacked together. Price tapped that area and pulled back, but the pullback was shallow and controlled.
That’s usually a sign buyers didn’t leave—just waiting.
There are also several bullish FVGs layered below:
* 506.8
* 504.5
* 501–502
These zones often act like stepping stones if price chooses an upward move. What I like here is that MSFT didn’t give back its entire run. It retraced only to the nearest FVG and held—strong behavior during a potential breakout setup.
This 15M structure leans slightly bullish, but it needs confirmation.
3️⃣ GEX Chart — Where MSFT Is Actually Being Pulled
This part is where most traders miss the real story.
The GEX map shows extremely clear levels that explain why MSFT keeps stalling at the same places:
Upside Gamma Levels
* 513.49 → strong resistance zone
* 520 → 2nd call wall
* 525+ → deep positive GEX cluster
If MSFT breaks above 513, it has clean air toward 520, and if momentum is strong, 525 becomes possible. These gamma walls often act like magnets once price clears the top.
Downside Hedging Zones
* 500.00 → primary PUT support
* 497.05 → second PUT level
* 493.25 → deeper hedge zone
This explains why 500 keeps getting defended every time—it’s a real options wall where market makers hedge hard.
What I like about this GEX setup is how cleanly it aligns with the levels on your 1H and 15M charts. When price action and dealer positioning line up, the move becomes easier to trust.
And yes—if someone hasn’t used GEX before, this is one of those charts that makes them ask, “Why does MSFT bounce exactly there every time?”
That’s where GEX comes in.
🎯 How I’m Planning MSFT for 11/17
🔼 Bullish Plan (Only Above 513)
If MSFT manages to break 513 and consolidate above it, the upside can be impressive.
Stock Trade Idea:
* Entry: 513.20–513.50
* Targets:
* 515
* 517
* 520 (GEX wall)
* 525 (if SPY and QQQ trend strong)
Options Idea:
* 515C or 520C
* Best entries come after 513 holds
* Trim at each major GEX magnet
🔽 Bearish Plan (If 500 Fails)
A clean break below 500 flips the structure immediately.
Stock Trade Idea:
* Entry: 499.20–499.00
* Targets:
* 497
* 493
* 490 (extended move)
Options Idea:
* 500P or 495P
* Downside accelerates quickly below 500 because hedging flips direction
* Fast scalps toward the PUT wall zones
⚠️ Chop Zone: 506–510
This is where MSFT keeps moving sideways with no conviction.
I’d avoid trading here unless volatility expands.
Final Thoughts
MSFT is one of those charts that looks boring at first glance but becomes incredibly clean once you stack multiple timeframes with the GEX levels. Both sides have clear control zones, and both sides have a reason to defend.
The real trade begins at 513 or 500.
Everything in between is noise.
Disclaimer
This analysis is for educational purposes only and does not constitute financial advice. Always perform your own research and manage your risk.
Microsoft - This bullrun will end soon!💊Microsoft ( NASDAQ:MSFT ) might reverse soon:
🔎Analysis summary:
Microsoft created a textbook bullish break and retest back in the beginning of 2025. After this retest, we then witnessed a major rally of about +50% over the past couple of months. But considering the recent weakneses and resistance, this rally might be over very soon.
📝Levels to watch:
$550
SwingTraderPhil
SwingTrading.Simplified. | Investing.Simplified. | #LONGTERMVISION

Caution Ahead: Strong Financials, but Market Conditions May ShifDespite the strong financial report, from a technical perspective, we've reached a point where caution is essential, and market conditions should be monitored closely. Even though the financial performance is robust, there’s a possibility that the situation could shift unexpectedly, which might lead to market changes that challenge the strong financial outlook.

MSFT: The “Top Pick” Trap? Or Real Breakout Fuel?Microsoft is testing a critical support zone — and with Morgan Stanley just naming it a top pick in tech, buyers may be gearing up for control. 📈
Quantitative stats back the setup: Sortino Ratio of 0.42 and 90% win rate on this pattern.
👉 What’s your call — breakout to new highs… or one more dip before the rally?

MSFT - High-Probability Swing Long (Strong Momentum Signal)🎯 Ticker: MSFT (NASDAQ)
📈 Type: Swing Long
⏰ Timeframe: Daily (D1)
📊 Technical & Momentum Analysis:
Daily Trend: BULLISH ✅
Momentum Signal: STRONG CONNORS RSI2 BUY (4 consecutive daily signals)
Key Support: $494-500 zone (Previous resistance turned support)
Market Position: Trading near all-time highs with strong institutional support
💡 Trading Thesis:
MSFT presents an exceptional momentum setup driven by:
EXTREMELY RARE MOMENTUM SIGNAL:
4 consecutive Connors RSI2 Buy signals indicate sustained bullish momentum
This pattern typically precedes significant upward moves in large-cap leaders
TECHNICAL BREAKOUT CONFIRMATION:
Successful test of previous resistance as new support
Trading above all key moving averages (SMA 20, 50, 200)
FUNDAMENTAL TAILWINDS:
Cloud (Azure) growth acceleration
AI leadership across product stack
Consistent revenue diversification
⚡ Trading Plan:
🎯 Entry: $\textcolor{green}{\textsf{506.00}}$ (Current level with momentum confirmation)
🛑 Stop Loss: $\textcolor{red}{\textsf{489.99}}$ (Below key support cluster)
💰 Profit Target: $\textcolor{green}{\textsf{537.98}}$ (Measured move to next resistance)
📊 Risk/Reward Ratio: 1:2.1 (Excellent for large-cap swing trade)
📉 Risk Management Notes:
Stop loss placed below critical support at $494-500 zone
Position size appropriately for large-cap volatility
Consider partial profit taking at $525-528 area
Monitor for any breakdown below $495 for early exit
Conclusion: MSFT offers a high-probability long setup with exceptional momentum confirmation through consecutive Connors RSI2 buy signals. The technical structure supports further upside toward all-time highs.
Trade safe and manage your risk!
Disclaimer: This is not investment advice. Conduct your own research and manage risk appropriately.
#MSFT #SwingTrading #Long #Tech #ConnorsRSI2 #MomentumTrading #LargeCap

MSFT: backtest demand, and chance for shortMSFT:
.
Backtest demand, and chance for short.
Smart money confirmed with high weekly candle and volume.
.
US STOCKS- WALL STREET DREAM- LET'S THE MARKET SPEAK!

Capital Flows: Concept and Characteristics1. Concept of Capital Flows
Definition
Capital flows refer to the movement of financial resources between countries. These resources include investments in financial markets, real assets, loans, and banking transfers. The underlying motivation behind these flows is to seek higher returns, diversify risks, fund economic development, or benefit from interest rate differentials and exchange rate expectations.
In macroeconomic terms, capital flows form the capital account and financial account of a country’s balance of payments (BoP). When foreign investors invest in a country, it records capital inflows. When domestic investors invest abroad, it results in capital outflows.
Types of Capital Flows
Capital flows can be broadly categorized into two major types:
A. Foreign Direct Investment (FDI)
FDI involves long-term investments where a foreign entity acquires ownership or controlling stake in a domestic company. Examples include:
Setting up factories
Buying significant equity in a foreign company
Mergers and acquisitions
FDI is typically stable, growth-enhancing, and associated with technology transfer and employment generation.
B. Foreign Portfolio Investment (FPI)
These are investments in financial assets such as stocks, bonds, and other securities without acquiring management control. FPIs are highly liquid and sensitive to:
Interest rates
Market sentiment
Global financial conditions
Due to their volatility, FPIs are often called hot money flows.
C. Other Capital Flows
Bank loans and deposits
External commercial borrowings (ECBs)
Sovereign bond purchases
Remittances (often classified separately)
Short-term speculative flows
2. Importance of Capital Flows in the Global Economy
A. Financing Development
Capital flows help developing economies fill investment gaps. Low domestic savings often restrict capital formation, and foreign investment helps fund infrastructure, manufacturing, and services.
B. Enhancing Financial Market Efficiency
Global capital flows integrate financial markets, increasing liquidity and improving price discovery. This allows companies to raise funds more efficiently and reduces the cost of capital.
C. Boosting Productivity and Innovation
FDI brings new technologies, management practices, and skills that enhance productivity. Exposure to global competition also pushes domestic firms to innovate and modernize.
D. Supporting Balance of Payments Stability
Capital inflows help countries finance current account deficits. For example, if a nation imports more than it exports, foreign investments can help cover the gap.
E. Influencing Exchange Rates
Large inflows appreciate the domestic currency, while outflows lead to depreciation. Exchange rate movements, in turn, influence trade competitiveness and inflation.
3. Characteristics of Capital Flows
Capital flows vary in size, stability, duration, and impact. The following are key characteristics that define their behavior:
A. Mobility
In today’s digital, globalized financial system, capital flows are highly mobile. Investors can shift funds across borders with the click of a button. This mobility increases liquidity but also contributes to volatility.
For instance:
Rising US interest rates may trigger outflows from emerging markets within hours.
A geopolitical tension may cause investors to rapidly move towards safe-haven assets like gold or US Treasury bonds.
B. Volatility
Not all capital flows are stable. Portfolio investments, short-term loans, and speculative flows are extremely sensitive to:
Global interest rate changes
Investor sentiment
Currency movements
Political stability
A sudden reversal of flows can trigger financial instability, known as capital flight. Emerging markets are especially vulnerable because their financial systems are relatively smaller and more fragile.
C. Risk–Return Driven
The direction of capital flows is predominantly determined by risk–return calculations. Investors compare:
Interest rate differentials (e.g., “carry trade”)
Expected currency changes
Economic growth prospects
Political risks
Financial stability metrics
Countries with stable policies, higher returns, and sound macroeconomics attract more inflows.
D. Impact on Currency and Exchange Rates
Large capital inflows strengthen the domestic currency because foreign investors must purchase local currency to invest. This can lead to:
Cheaper imports
More expensive exports
On the other hand, capital outflows weaken the currency, sometimes resulting in inflationary pressures.
E. Short-Term vs. Long-Term Nature
Capital flows differ in duration:
FDI is long-term, stable, and less likely to exit suddenly.
Portfolio flows are short-term and highly reversible.
Short-term debts increase vulnerability during crises.
Countries with higher shares of short-term external debt face greater risks during global financial shocks.
F. Pro-Cyclicality
Capital flows often move in tandem with global economic cycles:
During global booms, flows rush into emerging markets seeking higher returns.
During recessions or crises, investors retreat to safer assets (“flight to safety”).
This pro-cyclical nature can amplify economic fluctuations in recipient countries.
G. Influence of Global Liquidity Conditions
Global financial conditions, especially monetary policies of major central banks like the US Federal Reserve and ECB, heavily influence the magnitude and direction of capital flows.
For example:
Low interest rates in the U.S. push investors toward emerging markets for higher yields.
Tightening monetary policy triggers widespread outflows.
H. Policy Sensitivity
Capital flows respond quickly to changes in:
Tax policies
Capital control regulations
FDI norms
Banking sector reforms
Political developments
Stable and transparent policies attract long-term capital, while unpredictable regulations discourage investors.
I. Impact on Domestic Financial Stability
Large capital inflows can create:
Asset bubbles (stocks, real estate)
Credit booms
Over-leveraging
Similarly, sharp outflows can lead to:
Currency crashes
Stock market declines
Liquidity shortages
Thus, managing capital flows is crucial to financial stability.
4. Policy Tools to Manage Capital Flows
Countries use several strategies to handle volatile capital movements:
A. Capital Controls
Restrictions on inflows or outflows to reduce vulnerabilities.
Examples:
Limits on foreign ownership
Taxes on short-term flows
Minimum holding periods
B. Exchange Rate Interventions
Central banks may buy or sell foreign currency to stabilize exchange rates.
C. Macroprudential Policies
Limits on external borrowing
Stress tests for banks
Higher reserve requirements
D. Building Forex Reserves
Large reserves help soften the impact of outflows and boost investor confidence.
Conclusion
Capital flows are a vital engine of global economic growth and integration. They help countries access investment, improve productivity, strengthen financial markets, and support development. At the same time, their volatility, mobility, and sensitivity to global events pose significant risks, especially for developing economies.
Understanding the concept, types, and characteristics of capital flows is essential for designing effective policies that maximize benefits while reducing vulnerabilities. Proper management of these flows enables countries to achieve sustainable economic growth and maintain financial stability in a highly interconnected world.