GBDC...$15.5 target! Let it flyThis beauty of a BDC stock is a diamond in the rough. There's a nice pickup after ex div date, and now it is primed to fly back to it's home to around $15.5 target. Let it fly, let it fly! Easy trade...your welcome. Trade your rice and beans for steak and fine wine this Xmas!
Golub Capital BDC, Inc.
No trades
Next report date
—
Report period
—
EPS estimate
—
Revenue estimate
—
1.2 EUR
320.98 M EUR
684.08 M EUR
253.59 M
About Golub Capital BDC, Inc.
Sector
Industry
CEO
David B. Golub
Website
Headquarters
New York
Founded
2007
ISIN
US38173M1027
FIGI
BBG004DVZ189
Golub Capital BDC, Inc., a traded business development company invests in both public and private middle market companies located in the United States. The fund targets companies operating in the fields of operations, finance and information technology. It provides financing in the form of senior secured, one stop, mezzanine, equity and second lien loans for LBO's, recapitalizations, acquisitions and growth capital requirements with an investment size ranges of $10 -$75 million and an EBITDA of less than $100 million.
Related stocks

GBDC....easy 2.5% gain scoopHave been following gap recovery for a while, and this is an easy scoop. Entry around 15 and exit around 15.40.....merry Xmas!! History doesn't repeat itself, but it certainly rhymes. Confirmed support levels and upside multiple vs. risk. The upside will happen quickly so have your TAs lined up!
A

GDBC, just a pullback ?Small bullish channel just created, which may lead to the end of this pullback since the previous high at $17.
Bullish alert and bullish crossover together with bullish price action.

Double Top with Bearish Divergence Visible on the MonthlyThere looks to be room for a 50%-90% Pullback from here if this Double top begins to play out.

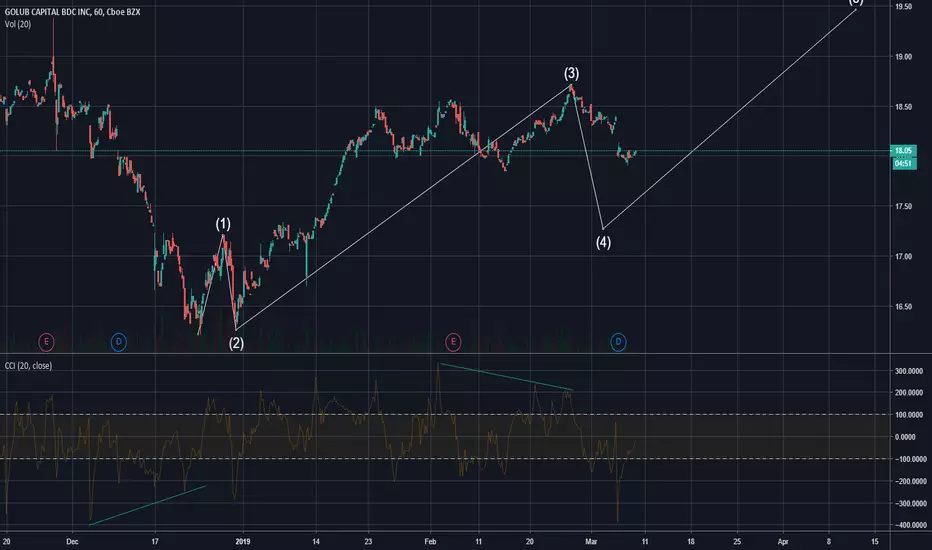
Green on Golub Capital. GBDCFlat formation, pointing to C Wave sooner rather than later. No confirmation on this yet, so an aggressive stance here. Hugely, hugely oversold now.
We are not in the business of getting every prediction right, no one ever does and that is not the aim of the game. The Fibonacci targets are highligh


$GBDC Huge Insider Buying in August
Potential long above $13.00 on break from ascending triangle
Upside target short term tot he 200ma @ $14.30
Golub Lawrence E Chairman Aug 20 Buy 12.70 82,204 1,043,629 1,248,225 Aug 21 04:29 PM
Golub David Chief Executive Officer Aug 20 Buy 12.70 82,204 1,043,629 1,248,225 Aug 21 04:31 PM
Golu

Correlation Histogramdataunion.tistory.com
Analysis
This stock mode of correlation coefficient is 0.3
In other words, the correlation coefficient of the other stocks is the many levels 0.3
Kurtosis of the distribution of the correlation is -0.46, and skew is -0.54

See all ideas
Summarizing what the indicators are suggesting.
Neutral
SellBuy
Strong sellStrong buy
Strong sellSellNeutralBuyStrong buy
Neutral
SellBuy
Strong sellStrong buy
Strong sellSellNeutralBuyStrong buy
Neutral
SellBuy
Strong sellStrong buy
Strong sellSellNeutralBuyStrong buy
An aggregate view of professional's ratings.
Neutral
SellBuy
Strong sellStrong buy
Strong sellSellNeutralBuyStrong buy
Neutral
SellBuy
Strong sellStrong buy
Strong sellSellNeutralBuyStrong buy
Neutral
SellBuy
Strong sellStrong buy
Strong sellSellNeutralBuyStrong buy
Displays a symbol's price movements over previous years to identify recurring trends.
GBDC5744454
Golub Capital BDC, Inc. 6.0% 15-JUL-2029Yield to maturity
5.40%
Maturity date
Jul 15, 2029
GBDC5711897
Golub Capital BDC, Inc. 7.05% 05-DEC-2028Yield to maturity
5.14%
Maturity date
Dec 5, 2028
GBDC5230340
Golub Capital BDC, Inc. 2.05% 15-FEB-2027Yield to maturity
4.95%
Maturity date
Feb 15, 2027
GBDC5133438
Golub Capital BDC, Inc. 2.5% 24-AUG-2026Yield to maturity
4.66%
Maturity date
Aug 24, 2026
See all OGL bonds
LEND
Vaneck Global Listed Private Credit (AUD Hedged) ETF Exchange Traded Fund UnitsWeight
7.75%
Market value
12.84 M
USD
INCM.B
Accelerate Diversified Credit Income Fund Hedged Units Trust UnitWeight
9.25%
Market value
5.68 M
USD
Explore more ETFs
Frequently Asked Questions
The current price of OGL is 12.3 EUR — it has decreased by −1.61% in the past 24 hours. Watch Golub Capital BDC, Inc. stock price performance more closely on the chart.
Depending on the exchange, the stock ticker may vary. For instance, on FWB exchange Golub Capital BDC, Inc. stocks are traded under the ticker OGL.
OGL stock has risen by 1.67% compared to the previous week, the month change is a 2.52% rise, over the last year Golub Capital BDC, Inc. has showed a −13.99% decrease.
We've gathered analysts' opinions on Golub Capital BDC, Inc. future price: according to them, OGL price has a max estimate of 13.80 EUR and a min estimate of 12.07 EUR. Watch OGL chart and read a more detailed Golub Capital BDC, Inc. stock forecast: see what analysts think of Golub Capital BDC, Inc. and suggest that you do with its stocks.
OGL stock is 0.81% volatile and has beta coefficient of 0.63. Track Golub Capital BDC, Inc. stock price on the chart and check out the list of the most volatile stocks — is Golub Capital BDC, Inc. there?
Today Golub Capital BDC, Inc. has the market capitalization of 3.25 B, it has increased by 1.88% over the last week.
Yes, you can track Golub Capital BDC, Inc. financials in yearly and quarterly reports right on TradingView.
Golub Capital BDC, Inc. is going to release the next earnings report on Feb 9, 2026. Keep track of upcoming events with our Earnings Calendar.
OGL earnings for the last quarter are 0.33 EUR per share, whereas the estimation was 0.33 EUR resulting in a −0.31% surprise. The estimated earnings for the next quarter are 0.33 EUR per share. See more details about Golub Capital BDC, Inc. earnings.
Golub Capital BDC, Inc. revenue for the last quarter amounts to 185.64 M EUR, despite the estimated figure of 188.94 M EUR. In the next quarter, revenue is expected to reach 180.62 M EUR.
OGL net income for the last quarter is 82.06 M EUR, while the quarter before that showed 76.45 M EUR of net income which accounts for 7.33% change. Track more Golub Capital BDC, Inc. financial stats to get the full picture.
Yes, OGL dividends are paid quarterly. The last dividend per share was 0.33 EUR. As of today, Dividend Yield (TTM)% is 11.23%. Tracking Golub Capital BDC, Inc. dividends might help you take more informed decisions.
Golub Capital BDC, Inc. dividend yield was 11.76% in 2025, and payout ratio reached 113.70%. The year before the numbers were 10.52% and 116.88% correspondingly. See high-dividend stocks and find more opportunities for your portfolio.
EBITDA measures a company's operating performance, its growth signifies an improvement in the efficiency of a company. Golub Capital BDC, Inc. EBITDA is 563.66 M EUR, and current EBITDA margin is 82.40%. See more stats in Golub Capital BDC, Inc. financial statements.
Like other stocks, OGL shares are traded on stock exchanges, e.g. Nasdaq, Nyse, Euronext, and the easiest way to buy them is through an online stock broker. To do this, you need to open an account and follow a broker's procedures, then start trading. You can trade Golub Capital BDC, Inc. stock right from TradingView charts — choose your broker and connect to your account.
Investing in stocks requires a comprehensive research: you should carefully study all the available data, e.g. company's financials, related news, and its technical analysis. So Golub Capital BDC, Inc. technincal analysis shows the buy rating today, and its 1 week rating is neutral. Since market conditions are prone to changes, it's worth looking a bit further into the future — according to the 1 month rating Golub Capital BDC, Inc. stock shows the sell signal. See more of Golub Capital BDC, Inc. technicals for a more comprehensive analysis.
If you're still not sure, try looking for inspiration in our curated watchlists.
If you're still not sure, try looking for inspiration in our curated watchlists.