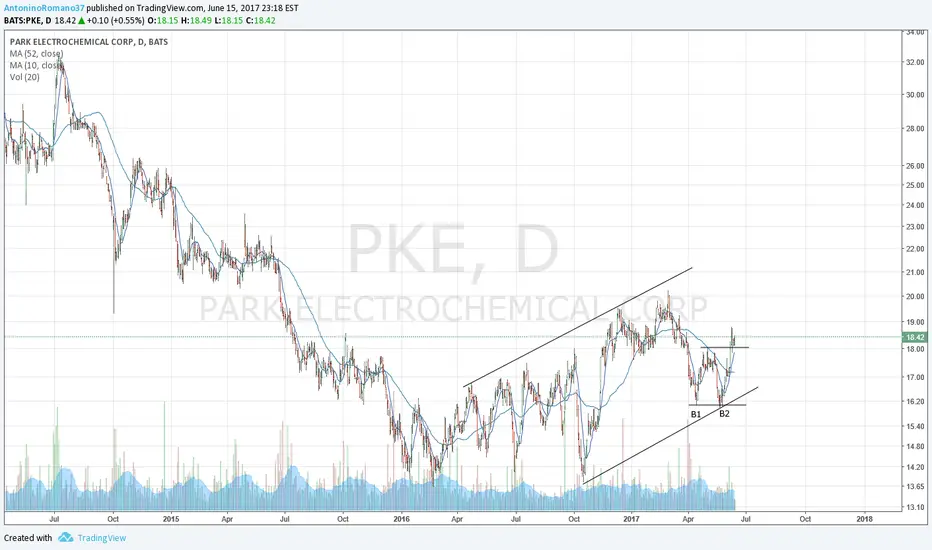
"Distribution Top Breakdown Signals Downward Trend Continuation"Park Aerospace Corp: A Closer Look at the Distribution Top and Downward Channel
Park Aerospace Corp, a key player in the aerospace industry, is currently undergoing a significant chart pattern that warrants attention from investors. With over 20 years of distribution top formation and a recent bre
Next report date
—
Report period
—
EPS estimate
—
Revenue estimate
—
0.3 EUR
5.67 M EUR
59.79 M EUR
17.22 M
About Park Aerospace Corp.
Sector
Industry
CEO
Brian E. Shore
Website
Headquarters
Westbury
Founded
1954
ISIN
US70014A1043
FIGI
BBG000JBPLZ2
Park Aerospace Corp. engages in the provision of solution and hot-melt advanced composite materials. It operates through the North America, Asia, and Europe geographical segments. The company was founded by Jerry Shore and Anthony Chiesa on March 31, 1954 and is headquartered in Westbury, NY.
Related stocks

Park Aerospace (PKE:NYSE) A Promising BuyPark Aerospace is a small aerospace supplier that has displayed strong performance, outperforming the broader market with a 7.8% gain. Moreover, since Analysts initial buy rating, Park Aerospace has delivered a remarkable 21.7% increase, surpassing the broader market's 13.6% growth. These figures hi

PKE downward to bottom of wedgeAfter some gap ups and downs, seems to be following downward wedge, will probably hit resistance at around $15.40. PKE has history of hitting multiple tops.


PKEPKE shows an dinteresting bullish price structure: a bullish channel and double bottom after a consolidation. I may go long after seeing more strength.
See all ideas
Displays a symbol's price movements over previous years to identify recurring trends.
Frequently Asked Questions
Depending on the exchange, the stock ticker may vary. For instance, on FWB exchange Park Aerospace Corp. stocks are traded under the ticker PKE.
Yes, you can track Park Aerospace Corp. financials in yearly and quarterly reports right on TradingView.
Park Aerospace Corp. is going to release the next earnings report on Jan 1, 2026. Keep track of upcoming events with our Earnings Calendar.
PKE net income for the last quarter is 2.06 M EUR, while the quarter before that showed 1.83 M EUR of net income which accounts for 12.24% change. Track more Park Aerospace Corp. financial stats to get the full picture.
Yes, PKE dividends are paid quarterly. The last dividend per share was 0.11 EUR. As of today, Dividend Yield (TTM)% is 2.40%. Tracking Park Aerospace Corp. dividends might help you take more informed decisions.
Park Aerospace Corp. dividend yield was 3.62% in 2024, and payout ratio reached 171.64%. The year before the numbers were 3.34% and 136.46% correspondingly. See high-dividend stocks and find more opportunities for your portfolio.
As of Oct 11, 2025, the company has 132 employees. See our rating of the largest employees — is Park Aerospace Corp. on this list?
EBITDA measures a company's operating performance, its growth signifies an improvement in the efficiency of a company. Park Aerospace Corp. EBITDA is 10.10 M EUR, and current EBITDA margin is 18.13%. See more stats in Park Aerospace Corp. financial statements.
Like other stocks, PKE shares are traded on stock exchanges, e.g. Nasdaq, Nyse, Euronext, and the easiest way to buy them is through an online stock broker. To do this, you need to open an account and follow a broker's procedures, then start trading. You can trade Park Aerospace Corp. stock right from TradingView charts — choose your broker and connect to your account.