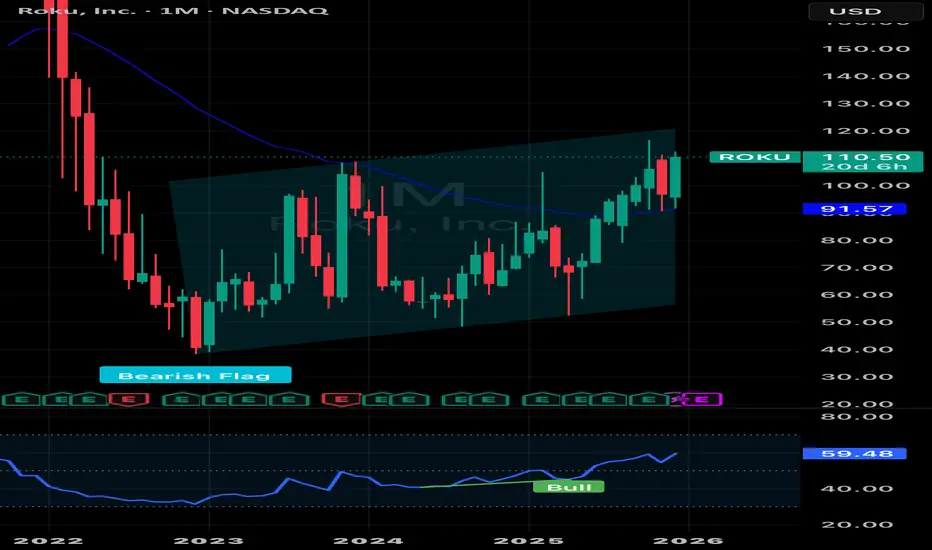
Pickup $ROKU ahead of monster breakoutNASDAQ:ROKU is on the cusp of a potential breakout with monster upside targets of 50% and 100%.
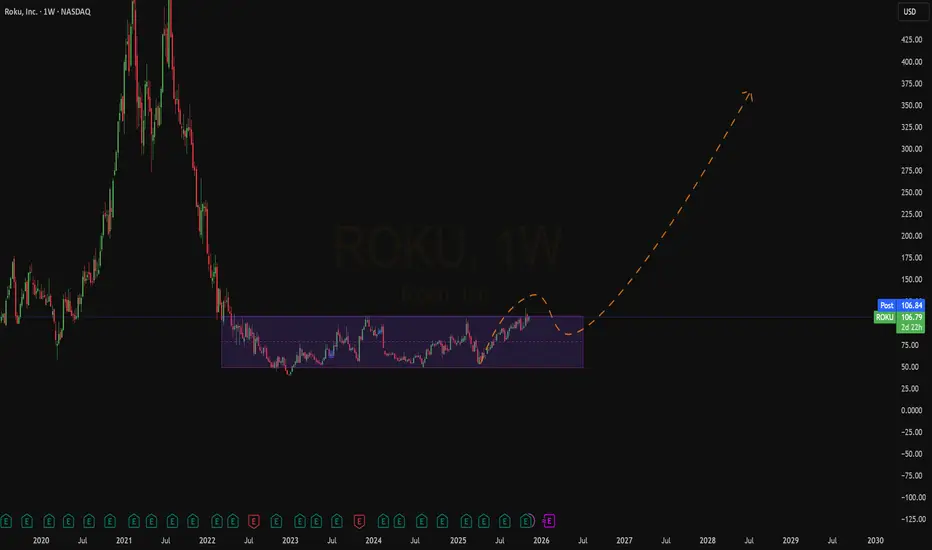
The weekly chart shows the broader picture with a years long consolidation period pressing at times on the current resistance $110/$111 area. Notably Morgan Stanley has upgraded the stock to overweight, however there's pressure from insider selling to contend with.
Recent action shows a tighter consolidation, highlighted on the 4h chart. The slight bearish divergence suggests it may take a bit longer for the price to finally break through resistance so choose call expiries wisely. I'm targeting June of 2026 with my bag.
Roku, Inc. Class A
No trades
Market insights

Roku: Turning for multi-week gains?Roku gaps up today and is holding up on strong relative strength following a surprise & pleasing last earnings about 6 weeks ago.
It’s even got this ‘change in character’ on Monthly chart as it breaks the highs earlier in the year. Plus RSI divergence.
Company’s fundamentals strong & strong chart technical signals. So I bought it.
ROKU — Trend Reversal | Upside Potential +200%This long position was opened today in the Premium channel.
The idea remains valid and can still be considered by those who haven’t entered the position yet.
✅ Roku, Inc. #ROKU is a leading streaming platform and Smart TV operating system, monetizing through advertising, subscriptions, and content distribution. The company is one of the key beneficiaries of CTV (Connected TV) growth and the shift of advertising budgets from linear TV to digital platforms.
📊 FUNDAMENTAL ANALYSIS
🟢 Strong strategic position in the CTV market
Roku remains one of the largest independent platforms in the U.S., with a massive user base and high engagement.
🟢 Advertising segment growth
The main driver is the recovery and further expansion of streaming ad spend, where Roku holds a systemically important position.
🟢 Improving margins
The company has gone through a tough cost-optimization phase, laying the groundwork for better operating performance in the next growth cycle.
🔴 Still unprofitable at the net income level
The focus on scaling and ecosystem investments continues to pressure bottom-line results.
🔴 High sensitivity to the advertising macro cycle
During economic slowdowns, Roku shares may exhibit elevated volatility.
🛠 TECHNICAL ANALYSIS
❗️Timeframe: MONTHLY
📈 LONG
▪️ Price breaks above and holds above the EMA 200 on the monthly TF — a key long-term trend-reversal signal
▪️ EMA 50 turns upward and begins converging with EMA 200
▪️ Formation of a long-term accumulation base after the 2021–2022 bearish collapse
▪️ RSI exits the depression zone, forming a bullish structure without signs of overbought conditions
▪️ MACD / OsMA show positive divergence and steady histogram growth, confirming a trend change
▪️ Breakout of a massive W-pattern
The current ~$107–110 area acts as a key confirmation level for the reversal and transition into a trending growth phase.
↗️ TRADE
🎯 T1: 155.23
🎯 T2: 176.72
🎯 T3: 328.67
📊 Upside potential:
— to T1 ≈ +40%
— to T2 ≈ +60%
— to T3 ≈ +208% — a long-term scenario targeting a return to historical overheated zones
💼 PORTFOLIO
#medium_term_management
⚠️ Published ideas are not investment advice and reflect the author’s personal opinion. Risk management is a mandatory condition for operating in the markets.

New Setup : $ROKU - WeeklyThe Weekly chart sees an attempt to break the multi-year base to the upside.
L2 alert already popped out.
Ready to catch it !
ROKU | Wow, This Rally Is Going To Be GOOD | LONGRoku, Inc. engages in the provision of a streaming platform for television. It operates through the Platform and Devices segments. The Platform segment includes digital advertising and related services including the demand-side platform and content distribution services such as subscription and transaction revenue shares, media and entertainment promotional spending, the sale of premium subscriptions, and the sale of branded channel buttons on remote controls. The Devices segment is involved in the sale of streaming players, audio products, smart home products, and accessories that are sold through retailers and distributors, as well as directly to customers through the company's website. The company was founded by Anthony J. Wood in October 2002 and is headquartered in San Jose, CA.

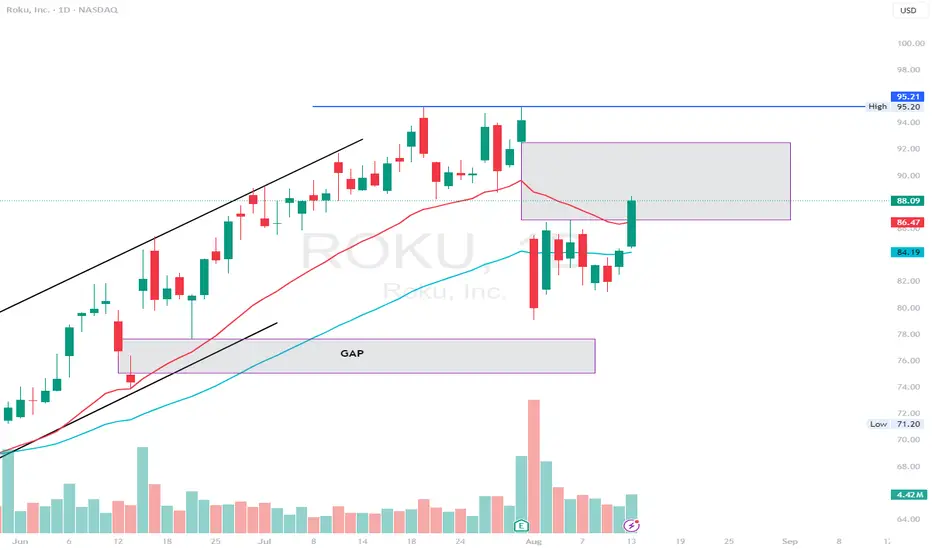
ROKU - gap fill to $92ROKU - stock moving higher after post earnings lows. Stock is trying to fill the earnings gap to $92.50. ABove that stock has resistance at $95. looking for calls as long as $88 holds for a move towards gap fill
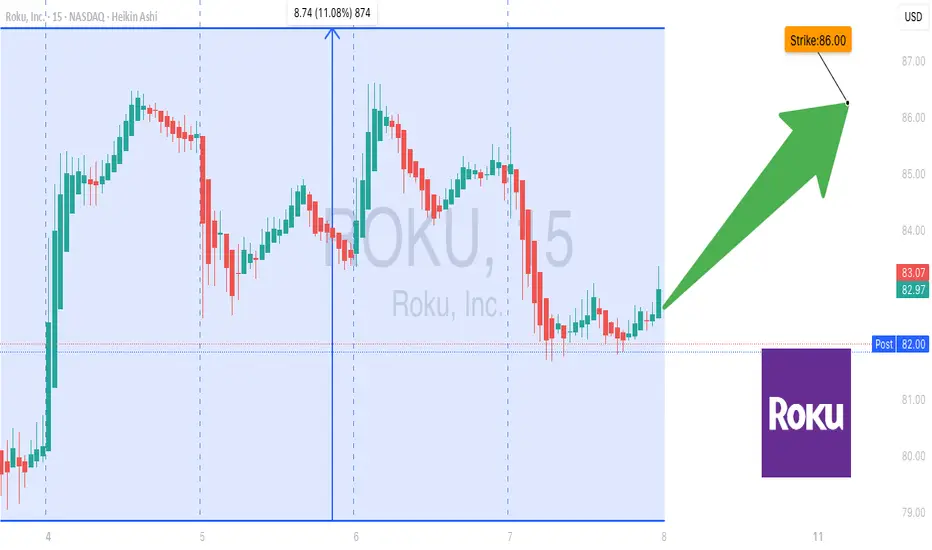
ROKU Call Alert: Cheap Options, Big Upside?🚨 ROKU Options Alert (Aug 6) – Bullish Breakout or Bull Trap?
📉 **Daily RSI < 45** → Bears in control
📈 **Weekly RSI Rising** → Bulls not giving up
📊 **Heavy Volume on Red Candle** = Institutional Selling?
💥 **Call/Put Ratio Spikes** → Speculators loading calls
⚠️ **High Gamma Risk** (Only 2DTE) = Fast & Furious Moves Incoming
---
### 🤖 What the AI Models Say:
**🔵 Grok/xAI** → ⚖️ *Moderate Bullish*
✅ Institutional Buying
✅ Favorable Volatility
📢 Suggests \$86 CALLs
**🔴 DeepSeek / Claude** → *No Trade*
⚠️ Daily RSI bearish
⚠️ Heavy distribution
🛑 Too risky this week
---
### 🧠 Summary: Mixed Signals = Cautious Bulls
Despite bearish momentum, **options flow screams bullish**. Risk-reward favors a speculative long — **only with tight stops**.
---
### 💰 Suggested Trade
**ROKU \$86 CALL** expiring **Aug 8**
📥 **Entry**: \$0.85
📈 **Profit Target**: \$1.30 (50%)
🛑 **Stop Loss**: \$0.51
🔒 **Confidence**: 65%
⏰ **Entry Timing**: At Open
---
### ⚠️ Key Risk:
Market tug-of-war between **institutional sellers vs. retail bulls**.
Only trade if you can manage fast-moving positions. 🔄
---
💬 Drop a 🚀 if you’re entering — and follow for more AI-driven trades!
ROKU Stock Chart Fibonacci Analysis 052925Trading Idea
1) Find a FIBO slingshot
2) Check FIBO 61.80% level
3) Entry Point > 74.6/61.80%
Chart time frame:D
A) 15 min(1W-3M)
B) 1 hr(3M-6M)
C) 4 hr(6M-1year)
D) 1 day(1-3years)
Stock progress: B
A) Keep rising over 61.80% resistance
B) 61.80% resistance
C) 61.80% support
D) Hit the bottom
E) Hit the top
Stocks rise as they rise from support and fall from resistance. Our goal is to find a low support point and enter. It can be referred to as buying at the pullback point. The pullback point can be found with a Fibonacci extension of 61.80%. This is a step to find entry level. 1) Find a triangle (Fibonacci Speed Fan Line) that connects the high (resistance) and low (support) points of the stock in progress, where it is continuously expressed as a Slingshot, 2) and create a Fibonacci extension level for the first rising wave from the start point of slingshot pattern.
When the current price goes over 61.80% level , that can be a good entry point, especially if the SMA 100 and 200 curves are gathered together at 61.80%, it is a very good entry point.
As a great help, tradingview provides these Fibonacci speed fan lines and extension levels with ease. So if you use the Fibonacci fan line, the extension level, and the SMA 100/200 curve well, you can find an entry point for the stock market. At least you have to enter at this low point to avoid trading failure, and if you are skilled at entering this low point, with fibonacci6180 technique, your reading skill to chart will be greatly improved.
If you want to do day trading, please set the time frame to 5 minutes or 15 minutes, and you will see many of the low point of rising stocks.
If want to prefer long term range trading, you can set the time frame to 1 hr or 1 day.

Potential Long Opportunity on ROKU from Current Levels up to 73.ROKU stock is showing signs of a potential rebound from the key support zone around 68-70, with early momentum improvement despite technical indicators still being in negative territory.
A break and hold above the 73.73 resistance could confirm a short-to-medium term bullish move toward the major resistance at 96.
Trade Setup:
• Entry Zone: Between 70 and 74
• First Target: 85
• Second Target: 96
• Stop Loss: Below 68 on a confirmed breakdown
Technical Analysis Highlights:
• Rebounding from the lower Bollinger Band
• Key resistance at 73.73
• Early bullish crossover signs on MACD
• Potential continuation toward 96 if 73.73 is cleared and held
Recommendation:
Consider buying in the 70-74 range with targets at 85 and 96, maintaining proper risk management by setting a stop loss below 68.

ROKU Close to Key Support After the Selloff Roku fell after its earnings report and updated guidance. Despite reporting EPS that beat expectations by 27.14%, Roku lowered its revenue guidance to $4.55 billion, down from the previous estimate of $4.61 billion. However, the sharp decline in price may present a buying opportunity for a medium-term swing trade.
Roku’s EPS is expected to turn positive in the third quarter, supported by increasing revenue in each quarter. The 12-month analyst consensus price target is $83.76, which is approximately 38% above the current price.
From a technical perspective, an ascending triangle formation appears to be developing at the bottom. While ascending triangles are typically continuation patterns, and rarely form at bottoms, it is still a positive sign for Roku. The lower line of the channel, which is near the 52 level and aligned with key horizontal support, can be viewed as solid support. As long as this support holds, an upward move toward the 200-day SMA and then to the 82.50 level is possible.

ROKU Trend Bias: Bearish Until $66 Breaks
This chart displays ROKU in a clear bearish trend, confined within a well-defined descending channel. The price recently formed a Lower High around $71.74, followed by a sharp rejection, confirming continued downside momentum. The current price action is hovering near the $61.60 support level, a critical zone that may lead to a breakdown toward the next support targets at $57, $55, and potentially $51–$49.
A temporary bounce to the $62–$64 area is possible but is likely to act as a bearish retest unless the price breaks above $66.33, which would be the first sign of a possible shift in trend. Until that happens, the structure favors bearish continuation, and any rallies are likely to be short-lived.
This setup supports a swing short strategy, with confirmation below $61 and resistance holding at $64. A move above $71.74 would invalidate the bearish structure and signal a potential trend reversal.
More details about this Chart:
1- Bearish Channel Intact
Your descending channel is strong and respected — price is moving from Lower Highs to Lower Lows.
The recent rejection at ~$71 confirms sellers are still in control.
2- No Break of Structure Yet
No Higher High (HH) has formed to invalidate the downtrend.
There's no sign of trend reversal until price closes above ~$72.
3- Bullish Shift Only If :
Price breaks and holds above $66.33
Then closes above $71.74 to make a Higher High
That would flip the trend structure
4- Downside Targets Still In Play
Next logical supports:
→ $57
→ $55
→ $51–$49 (major demand zone)
5- Bullish Shift Only If :
Price breaks and holds above $66.33
Then closes above $71.74 to make a Higher High
That would flip the trend structure
6-Strategy Suggestion:
Entry : Now or on bounce to $63–$64
Hold Time : 2–3 weeks
Targets : $57 → $55 → $51
Stop Loss : Above $66.5 or latest LH


ROKU long positionROKU is a video streaming platform which is poised for strong growth, driven by its expanding user base, innovative offerings and strategic partnerships. Analysts label it as a comepelling long-term investment opportunity. However, ROKU isn’t trading at a reasonable entry price, in terms of technicals, so I would suggest the following:
- Wait for the price to drop to the previous higher low of $66.3 to enter this trade
- Put a stop-loss at $63.1
- Target a share price of $96.3

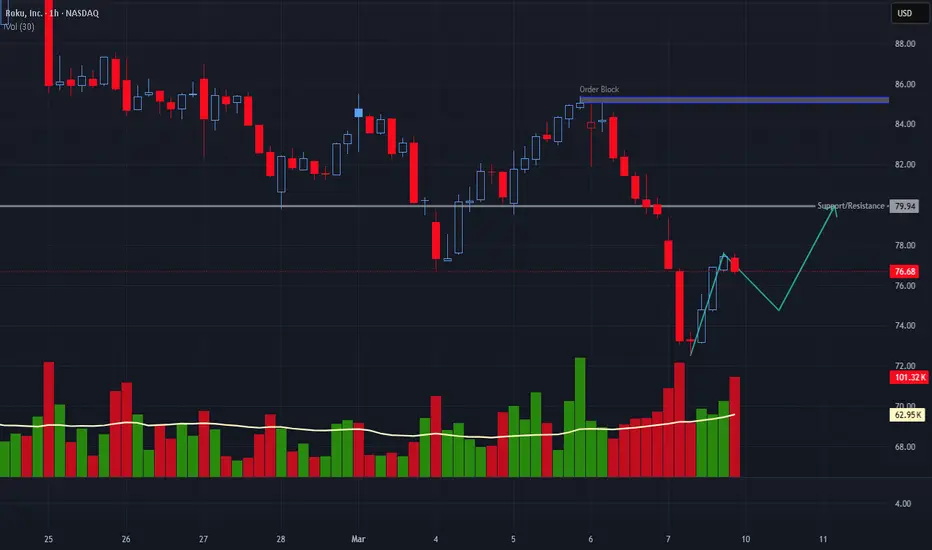
This should complete by TuesdayEntry-First bullish candle after pullback
Target $79.97
Stop $72.40
Price Action only
ROKU in Buy ZoneMy trading plan is very simple.
I buy or sell when at three of these events happen:
* Price tags the top or bottom of parallel channel zones
* Money flow spikes beyond it's Bollinger Bands
* Stochastic Momentum Index (SMI) at near oversold overbought level
* Price at Fibonacci levels
So...
Here's why I'm picking this symbol to do the thing.
Price in buying zone at bottom of channels
Stochastic Momentum Index (SMI) at oversold level
Money flow momentum is spiked negative and under at bottom of Bollinger Band
Entry at $73.29
Target is upper channel around $96

$ROKU Bullish Reversal?I have taken a 1/2 size position here on $ROKU. It had a nice big earnings gap and has since pulled back. It looks to me that it is now ready to reverse higher. See notes on chart.
I have taken the fact that it broke (just barely) the Downtrend Line and put in what looks to be a reversal candle. My stop will be just below yesterday's low.
This is my idea. If you like it, please make sure it fits within your trading rules. While I consider this a low risk trade, you may not. Thanks for looking. Comments always welcome.

ROKU Options Ahead of EarningsIf you haven`t bought ROKU before the previous earnings:
Now analyzing the options chain and the chart patterns of ROKU prior to the earnings report this week,
I would consider purchasing the 85usd strike price Calls with
an expiration date of 2025-4-17,
for a premium of approximately $8,00.
If these options prove to be profitable prior to the earnings release, I would sell at least half of them.

$ROKU - channel breakout above $83.50ROKU - stock getting tight in the channel. possible breakout coming soon. Looking for calls above $83.50 for a move towards $90 and $100. Stock is looking strong on indicators. on high watch

Roku...time to go here?!NASDAQ:ROKU looking good here, about to break out....
If NASDAQ:NFLX earnings are any indication, roku might beat also and raise guidance, in that case it might go higher and test the 100$ psychological level
next targets are 93 & 105 which are high volume nodes

PUT sale on ROKUGetting 1% for this put sale. Expiration is not too far away, plus ROKU is on an uptrend.

Goku Roku -LongBored, it's 2025 - so let's take what we've learned and apply it... I like roku's technicals... catching the 355 on the daily, let's risk some upwards momo into it's next earnings.

Rebound follow by sell offLook like Santa cancel gifts this year. Look for rally tomorrow followed by sell off. Easy money is over for now. We can change our direction now. Just follow the trend .

ROKU PREMIUM LONG SETUPAbove 92 RoKu will Reach 97 .
Posible to reach 100
but 97 is more Realistic to Take Profit
Stop Loss is 87
is 50/50 Trade
Do not Overleverage !!
NASDAQ:ROKU
