Rockwell Automation (NYSE: $ROK) Plans New Wisconsin PlantRockwell Automation (NYSE: NYSE:ROK ) has announced plans to develop a major new manufacturing plant in southeast Wisconsin, marking one of the company’s largest expansions in years. While Rockwell hasn't revealed the exact location, the facility will be close to its Milwaukee global headquarters and is expected to exceed one million square feet of factory and warehouse space. If fully realized, it could become Rockwell’s largest manufacturing site worldwide.
The project is part of a broader five-year, $2 billion commitment to expand the company’s U.S. manufacturing footprint. Wisconsin Governor Tony Evers welcomed the announcement, highlighting Rockwell’s long-standing contribution to the state’s industrial ecosystem. State officials emphasized that the expansion underscores Wisconsin’s leadership in modern manufacturing.
Rockwell said the new greenfield campus will feature its most advanced production technologies, including robotics, artificial intelligence, automation systems, and high-level data analytics. Chief Supply Chain Officer Bob Buttermore noted that the project signals confidence in the company’s workforce and long-term U.S. operations. Site planning is already underway, with coordination between Rockwell, local governments, and state agencies.
The Wisconsin Economic Development Corporation confirmed ongoing discussions with Rockwell but did not comment on potential incentives or job numbers. The initiative aligns with the state’s strategy to remain competitive in high-tech and advanced manufacturing sectors.
Technical Outlook
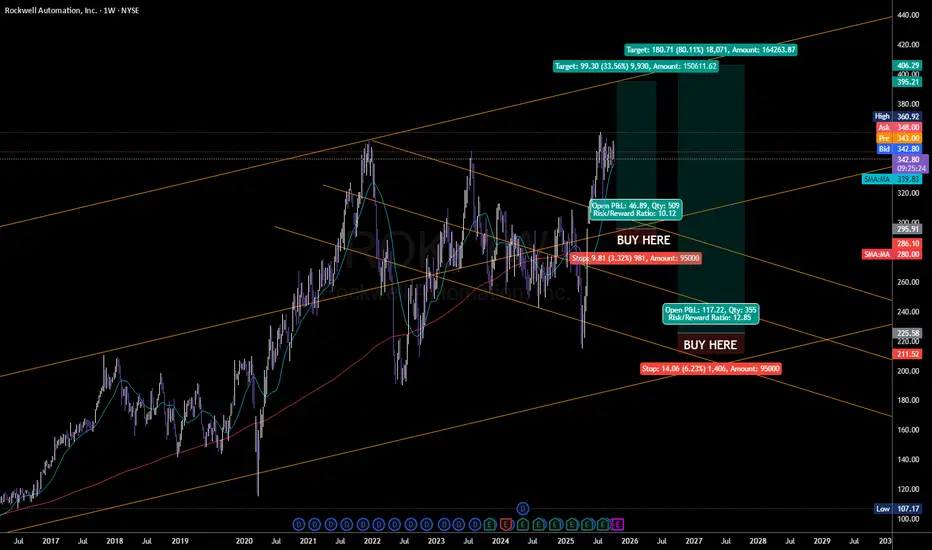
Rockwell Automation’s stock remains in a bullish structure. Price action is currently retracing toward the $350 support area, where buyers may look for continuation setups. If bullish momentum holds, long-term targets sit at $400 and potentially higher. The broader outlook remains positive as strong fundamentals and major domestic investment support upward momentum.
Rockwell Automation, Inc.
No trades
Trade ideas

Rockwell Automation (ROK) | Multi-Timeframe Expansion SetupThe Market Flow | Oct 24, 2025
Technical Overview
Monthly:
• Trend remains bullish above the active pivot at 247.68 .
• Structure confirms continuation after the prior corrective phase ended near the yearly midpoint.
• Fibonacci projection 138.2% aligns at 405.97 — defining the long-term expansion objective.
Weekly:
• Price has consolidated between two key pivots; upper resistance near 357–359 and lower support around 333.23 .
• A weekly close above the higher pivot would confirm breakout and validate continuation toward the next Fibonacci bands.
• Until that close is confirmed, the range remains technically valid — this upper pivot area acts as the invalidation zone for any premature bullish bias.
Daily:
• Yesterday’s session closed above the daily expansion level, confirming the start of an expansion phase .
• Structure is now aligned across timeframes with upside Fibonacci targets from 374.15 → 405.97 .
• Momentum confirmation is expected with follow-through above 358.52 , keeping focus on higher weekly extension zones.
Trade Structure & Levels
• Bias: Long above 350.30 (active daily pivot)
• Trigger: Break and close above 357.01
• Primary Invalidation: 351.91 on the Weekly
• Secondary Invalidation: 350.30 on the Daily
• Path → 374.15 → 386.18 → 405.97
• Phase: Expansion
• ATR(14D): 6.80
• Volume(20D): 0.78M
Risk & Event Context
• Earnings report due next week — volatility risk elevated into the event.
• Macro industrial sentiment and U.S. PMI data may further influence momentum.
• Elevated momentum readings suggest potential acceleration if breakout confirms above 358.
Conclusion
Rockwell Automation is entering multi-timeframe alignment with a validated daily expansion and potential weekly breakout confirmation pending. Long bias remains intact above 351.91, targeting 405.97 on sustained strength.
Disclaimer
This analysis is for informational purposes only and does not constitute investment advice, an offer, or a recommendation. Market conditions and price behavior may change without notice. Past performance is not indicative of future results. Always conduct your own research or consult a licensed financial advisor before making investment decisions.

Rockwell: Powering the Pulse of Smart Automation BUYRockwell Automation stands at the heart of industrial transformation, driving efficiency with cutting-edge automation tech. Their comprehensive solutions empower global factories to automate, scale, and compete in the age of intelligent robotics.
ROK watch $351.02-353.54: Exact ATH zone defined by major Fibs ROK is again attempting to break into a new ATH
Dual fibs have defined the exact top since 2021.
$351.02 is a Genesis fib and 353.54 a Covid fib.
Looking for a Break-n-Retest for long entries.
BUT resistance above is pretty close at $373
So it will chop after new ATH, prepare to hold.
.
Previous Analysis that caught a 40% BREAKOUT
Hit BOOST and FOLLOW for more such PRECISE and TIMELY charts.
=========================================================

ROK eyes on $245: Key Resistance break may Mark bottomROK trying to recover along with the general market.
Now testing a well proven resistance at $243.94-245.03
Look for a Break-and-Retest for possible long term entry.

Rockwell Automation | ROK | Long at $268.96Rockwell Automation NYSE:ROK appears to be gaining upward momentum once again. With two price gaps above (highest near $333+) and the historical simple moving average lines showing a positive change, this company could be poised to fill the gaps soon. A strong billion-dollar company with rising revenue, but stay cautious of the slightly high debt, insider selling, and changing economy / tariff implications.
At $268.96, NYSE:ROK is in a personal buy-zone.
Targets:
$300.00
$333.00

$ROK with a bullish outlook following its earnings #StocksThe PEAD projected a bullish outlook for NYSE:ROK after a positive under reaction following its earnings release placing the stock in drift A with an expected accuracy of 77.78%.

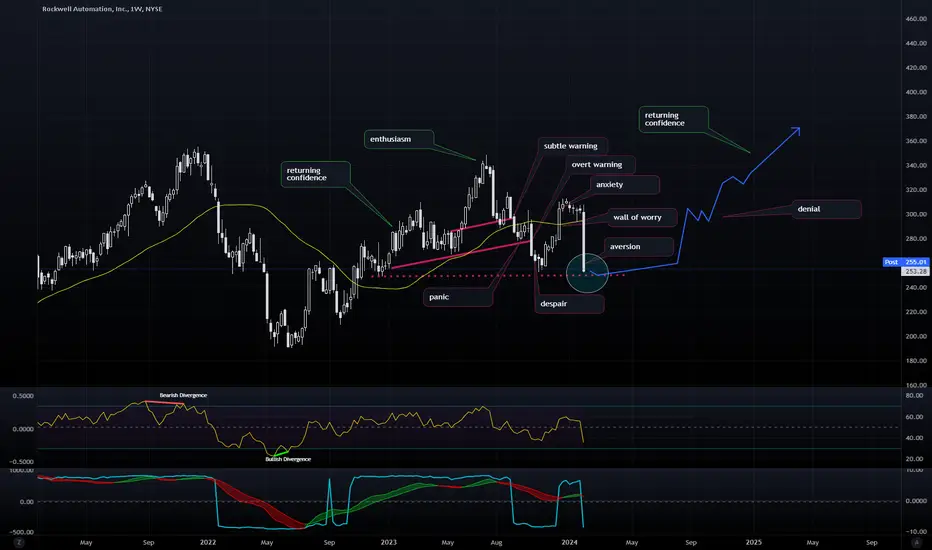
ROK and Justin Mamis sentiment cycleNYSE:ROK and a look at a potential scenario if this follows Justin Mamis sentiment cycle.
Which Robotics Stocks Are You Watching?This stock's pattern is an intermediate-term trend correction to bottom formation that is near completion. It may head sideways for a bit, but when it does breakout of this consolidation, there is potential for swing style runs to develop.
A Dark Pool buy zone triggered at the bottom's lows. And there are Pro Trader footprints in each run out of a new low.
NYSE:ROK is in industrial automation, aka Robotics. There is a huge demand building for manufacturing via robotics in the US as many manufacturers are no longer reliant upon Chinese manufacturing, which has become more expensive in recent years. Robotics can easily displace human workers globally as it becomes more popular and used extensively. Hence, institutional holdings is quite high in this company. The So this stock may also be suitable for longer-term investment opportunity.

SYMMETRICAL TRIANGLETOP LINE SLOPING DOWN.
BOTTOM LINE SLOPING UP CREATING A VACUUM THAT WILL EVENTUALLY PUSH THIS ONE WAY OR THE OTHER.
NEUTRAL UNTIL BROKEN.
Diagonal support has held.
Harami star/bullish today.
No recommendation

Hidden SupportAround 287-88 there is a hidden support. Since mid January this level has been tested from both sides again and again. At the end of March there was even an upside window opened. But the price came back 2 days later already. Since August it became a support finally.
Thus I am expecting a bounce back upwards to correct the decline since end August at least.

ROK at a crucial junctureA bearish flag is complete. Price on trendline and just about 200 EMA. Breakout if stock moves up in the next couple of days. Breakdown if otherwise. Squeeze momentum indicator indicates more bullish trend than bearish.

Is it time for industrials already? $ROKTechnology and Consumer Discretionary tend to lead the start of bull markets and Industrials should follow up.
The Industrials ETF AMEX:XLI is not outperforming the SP:SPX but, NYSE:ROK certainly is.
Maybe will be the sector's leader, is ranked #6 by IBD in its industry group ( AMEX:GAST ).
With higher lows and higher highs since June of 2022, Rockwell Automation is about to make new 52-week highs from a cup pattern. With the OBV already making new highs.
Will there be a handle? Maybe, it just had 4 weeks in a row closing higher. Let's wait and see.
I'd buy the breakout above $305 with a target sell at $350.

ROK Uptrend Rectangle pattern weekly chart, ~ BreakoutNYSE:ROK Uptrend Rectangle pattern weekly chart,Above KMAs, Last 4 constructive Candlesticks, Around Breakout (pivot point ~305.5), it's need which i think 309
Pivot point: ~305.5
confirmation entry point: 309
Stop loss: 288.3 (6.7%)
Target: ~ 350 (13.5%)

ROK about to exit squeezeThis shows ROK with historical exists from consolidation squeeze
We are at a point of this point for an exit to the upside NYSE:ROK

ROK - long on the pullbackHigher lows with attempts to break through the weekly resistance. I'll be looking at it pretty hard if price comes back to under the $261 area. Target is the next weekly resistance following the trend.
If the trend is invalidated (close below the previous low on the weekly) walk away.

$ROK with a Neutral outlook following its earnings #Stocks The PEAD projected a Neutral outlook for $ROK after a Positive over reaction following its earnings release placing the stock in drift B.

#ROK long idea$ROK - 4h close above daily trigger line
Entry: 253$
Stop-Loss: 249$
Target: 280$
Risk Reward Ratio: 6.7

$ROK with a Bearish outlook following its earnings #Stocks The PEAD projected a Bearish outlook for $ROK after a Negative Under reaction following its earnings release placing the stock in drift D with an expected accuracy of 57.14%.
Cup and HandleROK appears a bit stuck trying to get through prior gap down.
Possible Support not far below at bottom of gap down and handle low.
Negative Volume(volume on down days) is high. Positive volume (volume on up days which is the general public as a rule) is low. OBV (On balance volume) is perking up but is not high.
The 50, 100 and 200 moving averages are in place and sloping slightly up. The 20 is sloping up and just crossed up through the 50.
There are no rising wedges in the yearly chart.
ROK has made a trip down close to the handle low today at 57.33 and appears to be struggling with the resistance overhead. Long entry level is an "at or above" level. Some prefer an entry closer to support.
Not a recommendation

ROK 🌦Pattern recognized: Running flat Elliot Correction Wave.
Thesis: Bullish sentiment.
Conclusion:I struggled to chart this one, the patterns were distorted. I didn't take any positions.
My strategy: MEWT (MODIFIED ELLIOT WAVE THEORY).
***This does not constitute financial advice.***

BUY to ROCKWELL AUTOMATIONHey my friends, ROCKWELL AUTOMATION is at a very important moment in its history, we can witness a new historical high. It is in a bearish dynamic fake with a return of issued buy volume and an upside down hammer candle. In the TIMEFRAME M1 we observed a dash with a low volume of purchase executed it came to the top of the comfort zone to test it Great potential to breakout the price with the return of momentum at the same time the zone to reach a next and go test the high of the bollinger to make a new high. With symbolic number 270.00 failure of the zone test tent and the bullish channel.
Please LIKE & FOLLOW, thank you!

ABC BullishNo rising wedges noted in yearly chart
LE=long entry. Possible Stop below C
NV is high and OBV is picking up. RSI is pointing up and is at 58.89 today. I keep RSI on 9/80 and 20
I see of a level S at 237ish and at the 50 SMA which is at 232.75ish today.
I have owned this since close to it's bottom after it caught the deadly flu (Speaking of the flu, I have not heard of anyone with influenza this year and I am a nurse. I guess influenza is gone? Deaths from cancer, COPD, diabetes and heart disease have been dramatically reduced this year. In the month of March, heart attacks were less than 50% of the norm for that month. Perhaps Covid has some benefits after all since no one dies too much from anything else anymore. Plus influenza appears to have been eradicated as well. Just trying to look on the bright side I guess) Humans are 100% mortal )o:
This stock has more than doubled so be sure you get a good entry point if interested in this one. Seeking Alpha says it is overvalued at this point )o:
Weekly candle is bullish. Monthly is a doji today.
Buy red/sell green
Trade safely. This is just an observation.
