$TSLA: Gravity Reasserts ItselfGreetings, traders.
The NASDAQ:TSLA chart is currently painting a picture of a profound test of market physics. This isn't a "battle"; it's a conflict of impersonal forces.
On one side, we have "Lift"—the powerful, almost unnatural force of a narrative focused on AI, robotics, and a limitless future. This force defies traditional valuation and pushes the price to high altitudes.
On the other, we have "Gravity"—the undeniable, constant pull of fundamental reality, which just made itself known in the Q3 earnings report.
The chart is our laboratory, and we are here to observe these forces at work.
The Technical Landscape
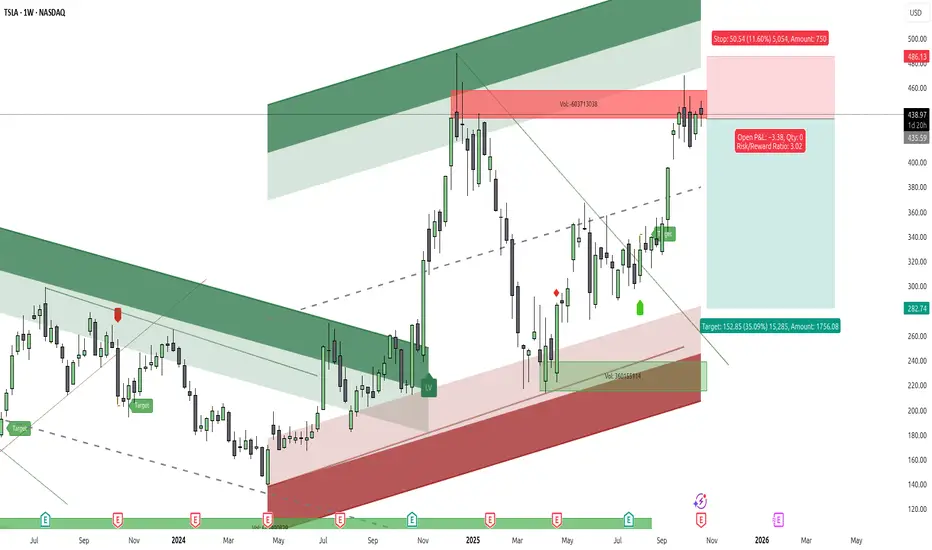
The Macro View: The weekly chart shows the narrative's 'Lift' failing at a critical altitude. The price has been decisively rejected from the " gravitational ceiling " of its multi-year ascending channel (approx. $480-$500). This is a level where the weight of reality has consistently proven too strong. The most recent large, bearish candle is not an attack; it is simply the pull of gravity reasserting its dominance over upward momentum.
The Tactical View: The daily chart shows why this 'Lift' is failing. We saw a classic bearish MACD divergence on the final push to the highs—price floated higher, but the underlying force (momentum) was fading. The MACD has now crossed bearishly, confirming the shift. Price is now coiled in a tight daily wedge, a tactical "decision point" where we will see if 'Lift' can be re-established or if 'Gravity' will take full control.
The Philosophy: A Tale of Two Forces
To understand NASDAQ:TSLA $, you must understand the two opposing forces that define its physics.
The 'Lift' (The Narrative Camp): The bull case is a qualitative vision. It's about Robotaxis, Optimus, and AI. This crowd is rightfully unconcerned with a single quarter's auto margins because, in their view, they are buying a different company—one that exists 10 years in the future. Their conviction is deep and provides a powerful upward force.
The 'Gravity' (The Quantitative Camp): The bear case is a spreadsheet. It's about the "now." The Q3 earnings report is the catalyst for this "counter-force."
EPS Miss ($0.50$ vs $0.53$) Severe margin compression from aggressive price cuts. A fundamentals-based valuation (e.g., Morningstar's $250 FVE) that is miles away from the current price.
This setup is a clear piece of the puzzle.
It shows what happens when the powerful force of 'Lift' (Narrative) reaches its apex and meets the immovable, constant pull of 'Gravity' (Macro Supply + Fundamental Reality). At this specific junction, 'Gravity' is in control.
An Illustrative Setup
We do not predict; we observe and we react.
The confluence of a failing 'Lift' at a 'gravitational ceiling,' combined with the new "weight" of a fundamental catalyst, provides a high-probability, asymmetric setup. This is not about being "right"; it is about defining risk.The chart illustrates a potential short setup based on this confluence:
Entry: ~ $435.00$ (Sell Short)
Stop-Loss: ~ $486.00$
Target: ~$282.00$
Risk-to-Reward Ratio: ~3
The confirmation for this thesis would be a breakdown from the daily wedge (around $430), signaling that 'Gravity' has taken firm hold.The stop-loss at $486$ is the "escape velocity" point. If the price breaks above it, the 'Lift' force has overcome 'Gravity,' the thesis is invalidated, and we step aside.
One cannot argue with the market's physics.
Respect the level; it is your anchor to reality.
Disclaimer: This is not financial advice. It is for educational and informational purposes only. Please conduct your own research and manage your risk accordingly.
Trade ideas
TSLA shorts may get toastedA rising trendline acting as strong dynamic support from the August lows.
Resistance zone near $470–475 (yellow line, recent double-top area).
Current price at $456, holding above trendline support.
Support floor near $290, far below current levels — indicating we’re in a mid-term uptrend phase, not deep correction.
This pattern fits a rising channel consolidation near resistance — the next move depends on whether the trendline holds.
📈 Bullish Scenario
Setup:
TSLA is holding the ascending trendline while consolidating just below resistance — a classic bullish continuation structure.
Confirmation Triggers:
Break and daily close above $470–475 (clear breakout).
Follow-through volume or a strong gap-up session confirming momentum.
Short-Term Targets:
$490–495 → initial breakout target (projected move from last swing).
$510–520 → extended target if buyers sustain momentum.
Catalysts:
Broader tech strength (QQQ, NASDAQ rally).
Positive EV demand data or production updates.
Institutional accumulation at the breakout level.
Invalidation:
Break and close below $445, violating trendline support.
Probability: ~60% (uptrend intact, momentum favors bulls).
📉 Bearish Scenario
Setup:
If TSLA fails to break $470 again and loses the $445 trendline, momentum could unwind toward prior support.
Confirmation Triggers:
Close below $445 with increased volume.
Failed retest near $450–455 forming lower high.
Short-Term Targets:
$420–425 → first support zone from early October.
$390–400 → deeper correction toward base of last breakout.
Catalysts:
Weak market sentiment or NASDAQ pullback.
Negative headlines on delivery numbers or margins.
Broader EV sector weakness.
Invalidation:
Breakout above $475 with strong follow-through.
Probability: ~40% (depends on strength of support at $445).
⚖️ Neutral / Sideways
If TSLA oscillates between $445–475, expect continued range consolidation along the trendline — typically preceding a directional breakout in 1–2 weeks.
🧩 Summary Table
Bias Confirmation Target Zone Invalidation Notes
Bullish Close > $475 $490 → $520 < $445 Continuation of uptrend
Bearish Close < $445 $425 → $400 > $475 Trendline break
Neutral Range $445–475 — — Coiling near apex
🕒 2–3 Week Projection
Bullish path: Hold $450–455 → breakout above $475 → reach $495–500 by mid-Nov.
Bearish path: Reject $470 → break below $445 → pull back to $420 by late Nov.

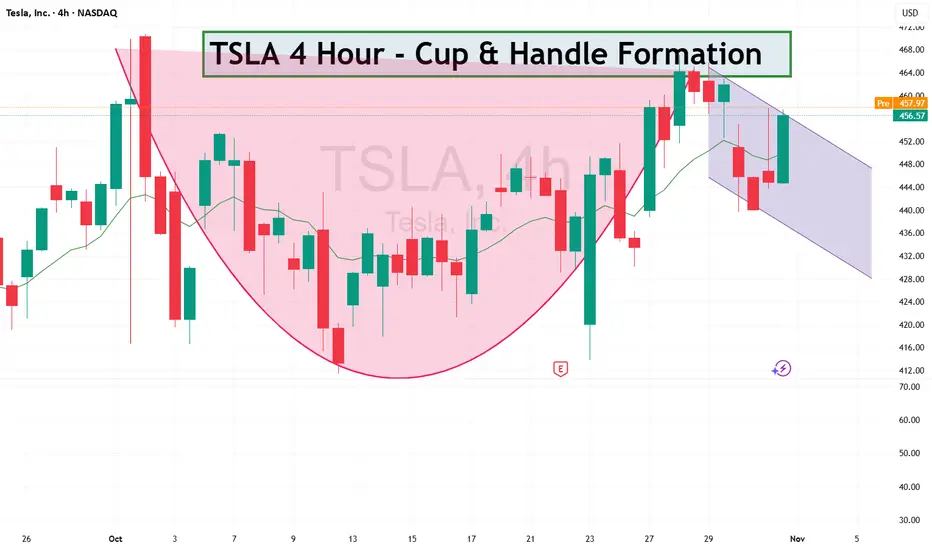
TALS - Cup and Handle FormationTSLA looks quite bullish, as you can see cup and handle formtion on 4 hour.
#TSLA #Tesla #Stocks #Trading #StockMarket #TechnicalAnalysis
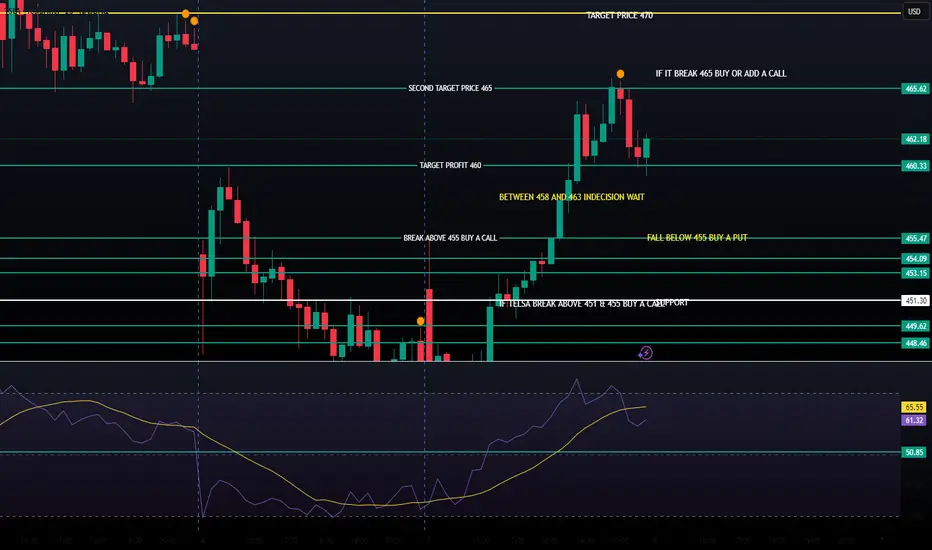
ABOUT TESLA CALL OR PUT OPTIONPlease see this Technical Analysis before thinking about buy or sell Tesla
TESLA On The Rise! BUY!
My dear followers,
This is my opinion on the TESLA next move:
The asset is approaching an important pivot point 433.50
Bias - Bullish
Safe Stop Loss - 429.07
Technical Indicators: Supper Trend generates a clear long signal while Pivot Point HL is currently determining the overall Bullish trend of the market.
Goal -440.74
About Used Indicators:
For more efficient signals, super-trend is used in combination with other indicators like Pivot Points.
Disclosure: I am part of Trade Nation's Influencer program and receive a monthly fee for using their TradingView charts in my analysis.
———————————
WISH YOU ALL LUCK

The New Trading Era: From Machine Intelligence to Human EdgeThe Oracle That Doesn’t Think but Mirrors
Everyone’s talking about the “rise of artificial intelligence” in trading, algorithms replacing traders, neural networks predicting the next move, machines that seem to think.
But the most extraordinary thing about machine intelligence isn’t its brilliance. It’s its astonishing ability to mirror, to absorb vast amounts of past data and recreate patterns it has already seen. A gigantic echo chamber of past realities.
In other words, what we call “intelligence” in these systems is not understanding, it’s reproduction. They don’t reason; they recognize. They don’t imagine; they approximate.
And yet, that ability to reflect a million past environments can feel almost magical, especially when it responds with coherence that seems human.
But here’s the quiet paradox: one the industry rarely talks about: What we’re witnessing isn’t a new form of intelligence; it’s a new kind of mirror, one that reveals how little we truly understand about our own decision-making.
When Machines Need to Learn the Market Every Day
For most of us, our first real encounter with AI came through models like ChatGPT, tools that belong to a specific subgroup of machine learning known as Large Language Models (LLMs), designed to simulate human-like conversation. That’s where our perception of AI as “brilliant and almost magical” was born. LLMs seem capable of answering anything, from trivial questions to complex reasoning.
Their power, however, doesn’t come from understanding the world. It comes from an extraordinary ability to predict language, a task that, despite its apparent complexity, is remarkably stable and mathematically manageable. The rest is simply scale: access to a massive database of accumulated knowledge, allowing the model not only to predict the next word but also to recreate an entire response by recognizing and recombining patterns it has already seen a million times before.
To understand this better, think of your phone’s autocomplete as a miniature version of ChatGPT, it guesses your next word based on your previous conversations. In such a stable environment, consistency is easy. That’s why language models achieve such high accuracy: their elevated “win rate” comes from playing a game where the rules rarely change.
They may look brilliant, but it’s better to say they’re simply hard-working machines in a stable world.
Trading, however, exists on the opposite side of the spectrum. It lives in a non-stationary world, one where the rules constantly evolve. Today’s conditions will be different tomorrow. Or in five minutes. Or in five seconds. No one knows when or how the shift will happen.
Here lies the crucial difference: a model that “understands” English doesn’t need to relearn grammar every week. A model that trades must relearn market reality every day.
Machine learning thrives on repetition. Markets thrive on surprise.
The Real Disruption: Human Understanding + Machine Power
By truly understanding the capabilities and limitations of machine learning in trading or more broadly, artificial intelligence, we realize that the future isn’t about removing humans from the equation. It lies in understanding how machine power compounds in the right hands.
The next era of trading won’t be about replacing human judgment but amplifying it.
Human contextual reasoning, our ability to interpret uncertainty, adapt, and make sense of nuance, can be combined with the machine’s immense capacity for data processing and execution.
Machines bring speed, scale, and memory. Humans bring intuition, flexibility, and judgment.
The synergy happens when both play their part: the trader designs the logic; the machine executes it flawlessly.
Machines cannot think, but they can learn, replicate, and act at a scale humans simply can’t compete with. When contextual thinking meets computational power, that’s not artificial intelligence, that’s real intelligence.
The trader who treats AI as a tool builds an edge. The one who treats it as an oracle builds a trap.
A Simple Manual for Thinking Right About AI in Trading
Never delegate understanding.
Let the machine calculate, but you must know why it acts. You can outsource the coding of a model, but never the architecture of your trading logic. The logic, the “why,” must remain human.
The basics still apply.
Machine learning doesn’t replace the foundations of trading, it only amplifies them. Risk management, diversification, position sizing, and discipline remain non-negotiable. A model can process data faster than you ever could, but it can’t understand exposure, capital allocation, or your personal tolerance for risk. Those are still your job.
Stay probabilistic.
The use of ML in trading doesn’t erase the hardest lesson of all: predicting prices is a false premise. The right question isn’t “Where will the market go?” but “How should I respond to what it does?” Now imagine the power of machine intelligence working within that probabilistic framework: a system designed to maximize your account’s expected value, not to guess Bitcoin’s price next month. That’s where the real explosion of potential lies.
Build systems that can evolve.
The future won’t belong to the trader with the smartest model, but to the one with the most adaptive one. And remember, you must be the most adaptive asset in your system. Markets evolve; your models must too. There’s no such thing as “build once and deploy forever.” In trading, anything that stops learning starts dying.
From the Illusion of Machine Intelligence to the Power of Human-Driven ML
Machine intelligence isn’t a new oracle, it’s a new instrument. In the wrong hands, it’s noise. In the right hands, it’s leverage. It can multiply insight, scale execution, and compound returns, but only when driven by an intelligent trader who understands its limits.
The trader understands, the machine executes. The trader teaches the machine; the latter amplifies the former’s reach.
In the end, it’s never the algorithm that wins, it’s the human who knows how to use it. And when both work together, one thinking, one learning, that’s not artificial intelligence anymore.
That’s compounded intelligence.
TSLA - Important!🔥 Tesla Analysis (Daily Structure) 🔥
Alright, let’s break this one down 👇
🧱 Structure Overview
Tesla’s price is currently hovering around $452, sitting right below a major resistance zone between $455 – $470 (highlighted in orange). This area has acted as a strong ceiling multiple times — every approach has been met with rejection pressure.
Below, the support floor sits clean around $420 – $425, which has been holding the range low for a while. We’re essentially trapped in a sideways consolidation box — a range between that $420 low and the $470 resistance cap.
🧭 Bias
Current structure = Neutral to Bearish
Price just wicked into resistance, showing signs of rejection. Unless we see strong follow-through above $470 with clean volume, this is likely a reaction zone for shorts.
💡 Key Zones
Resistance (Sell Zone): $455 – $470
Strong supply — expect sellers to defend this area.
Support (Buy Zone): $420 – $425
Range demand base — liquidity resting below.
🎯 Scenarios
Bearish Setup (Higher Probability for Now)
If Tesla fails to break and close above $470, look for a move back down to $420 — possibly a liquidity grab under the range. Confirmation would be bearish engulfing or a strong rejection candle from resistance.
Bullish Setup (Breakout Play)
If price cleanly closes above $470 and retests it as support, we could open the door toward $500 (measured move target). That’d be a breakout from the range and continuation of the larger bullish channel.
⚖️ Risk Management
Bears: Stop above $475 – $480
Bulls: Stop below $445 if entering after breakout retest
Keep R:R ≥ 1:2
🧠 Summary
Tesla’s in a tight range — smart money likely accumulating or distributing near these highs. Watch for rejection signs around $470 for short plays, or confirmation above it for the next leg to $500.
This is the make-or-break zone — the next move will define Tesla’s mid-term direction. ⚡️
TSLA Weekly Outlook (Oct 28–31)TSLA Weekly Outlook (Oct 28–31): “Charging Toward 470 or Cooling at the Top?” ⚡
1. Weekly (1W) Structure – Big Picture
Tesla is in a strong bullish continuation phase, showing a clear Break of Structure (BOS) above $367 and holding momentum above $450. The downtrend line from the 2023 high was broken, confirming a long-term structural reversal. Price is now consolidating near $452–$460, forming a possible higher-low setup before a push to $488–$500 zone.
* Bias: Bullish continuation unless price closes below $411.
* Support: $367 → $411 zone
* Resistance: $470 → $488 zone
* MACD: Expanding bullish histogram, showing momentum strength.
* Stochastic: Near overbought but still trending upward.
💡 Weekly Thought:
Tesla’s higher timeframe looks ready for another leg up, but a mild pullback to $430–$440 wouldn’t hurt the structure—it would actually create a healthy base for November.
2. Daily (1D) – Momentum Check
The daily chart confirms a strong BOS and ascending channel. After testing the channel’s lower boundary ($411–$420), Tesla rebounded cleanly toward $452. Price is attempting to reclaim the midline of the ascending channel, signaling renewed bullish control.
* Bias: Bullish bias, but short-term profit-taking likely near $460–$470.
* Support: $411 → $420 (demand zone)
* Resistance: $460 → $470 (channel top)
* Indicators:
* MACD turning positive after extended red bars.
* Stochastic curling up from mid-levels — bullish swing signal.
💭 Daily Suggestion:
Buyers should stay patient for pullbacks near $440–$445 to re-enter. Short-term traders can target $468–$470 if price holds above $452 with volume.
3. 1-Hour (1H) – Short-Term Game Plan
Tesla is holding above the intraday uptrend line, with clear Breaks of Structure (BOS) around $451–$455. The immediate zone to watch is the $449–$451 range, acting as dynamic support. As long as Tesla holds this area, intraday bulls maintain control.
* Scalp Bias: Bullish as long as price stays > $449
* Immediate Resistance: $455 → $465
* Support: $439 → $445
* Setup Idea:
* Call scalp: Above $455 for target $462–$468
* Put scalp: Only if breaks below $445 with volume
📈 1H Thought:
If Tesla consolidates sideways around $450–$455 early week, it sets up a launch toward $470 later in the week.
4. GEX & Options Sentiment – Institutional Flow Insight
The Gamma Exposure (GEX) map shows clear call dominance:
* Highest positive GEX wall / resistance: $455–$460
* 2nd & 3rd Call Walls: $465 → $470 → $480
* Put walls / downside support: $430 → $415 → $400
Key Metrics:
* GEX Bias: +57.2% Calls
* IVR: 15.5 (low volatility environment)
* IVx avg: 60.2% (vol compression likely → bullish)
Institutions are positioned bullishly with heavy call exposure at $460–$470, acting as a near-term magnet. The $430–$415 range remains protected by put walls—making it a tough zone to break down through unless macro turns negative.
5. Suggested Option Plays
* Bullish Setup (Preferred):
* Buy-to-open 460C (1DTE/2DTE) if price reclaims $455–$457 with volume.
* Target: $470
* Stop: Below $445
* Reason: Strong call gamma wall at $460 + breakout potential.
* Bearish Hedge (Cautious traders):
* Buy 440P (1DTE/2DTE) only if TSLA breaks $445 on volume.
* Target: $430
* Stop: Above $455
6. My Take for Oct 28–31
Tesla is showing clean bullish structure across all timeframes.
* Weekly confirms a higher low and BOS continuation.
* Daily is aligned within an ascending channel.
* 1H shows intraday bullish trendline support.
* GEX confirms call-dominant sentiment toward $470.
If macro markets remain stable, TSLA likely tests $468–$470 this week, possibly stalling there for profit-taking. A rejection near that level would bring $440–$445 back into play for reload.
🎯 Primary Bias: Bullish toward $470
⚠️ Watch For: Failing to hold $445 = possible short-term correction.
Disclaimer:
This analysis is for educational purposes only and not financial advice. Always manage your risk and perform your own due diligence before trading options or equities.
TSLA is going UP! .. time to buy!Tsla aka Tesla was stuck in-between 2 powerful support and resistance zones (the red and green lines) .. It finally broke to the upside and broke above the resistance level. It is now very likely to head to the next resistance zone which was the previous high (the next resistance zone has been drawn as the white line shown on the chart) - this is where we will be taking profit at. BUY NOW!

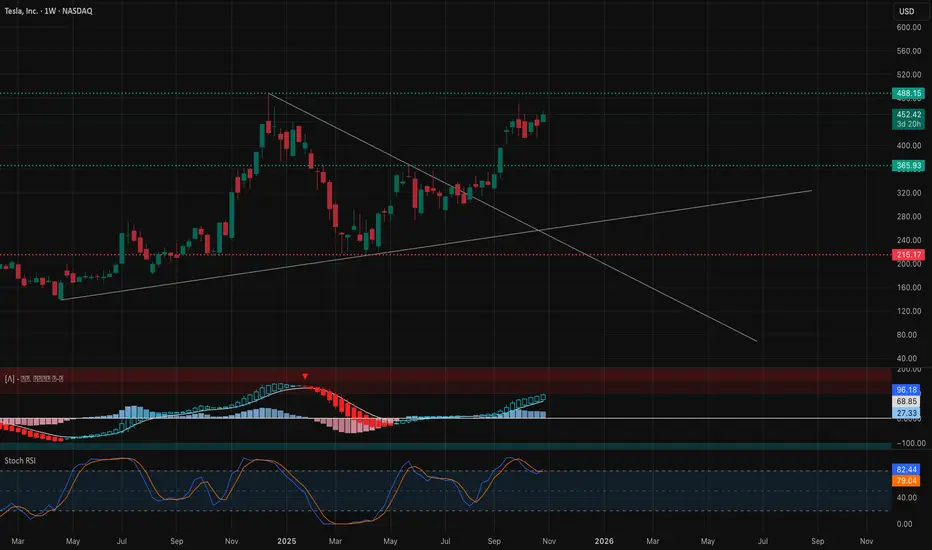
ARE TESLA MARKET BULLS BECOMING WEAK?Tesla Analysis (Weekly Timeframe)
Tesla is currently completing its first cycle wave since inception. The market started printing a primary wave 5, which is an ending diagonal in January 2023. Primary wave 5 comprise of 5 3-wave intermediate waves 1,2,3,4 and price is now printing intermediate wave 5. Intermediate wave 5 started printing in March 2025, minor wave A terminated in May 2025 and minor wave B, a running flat terminated in July 2025. The market is now printing an impulse minor wave C to complete the last 3-wave intermediate wave 5 that will complete primary wave 5 that will complete cycle wave 1. Intermediate wave 5 may be truncated, i.e., it does not necessarily have to touch the medium-term bullish resistance line (upper trendline). From here we will see a major primary wave ABC correction that may begin in Q1 of 2026.
Short entries (1) @ 488.93
Short entries (2) @ 511.04
SL @ 533.15
TP @ 321.47
"The big money is not in the buying or selling - but in the waiting" Charlie Munger
#SabaliCapital
#TechnicalAnalysis

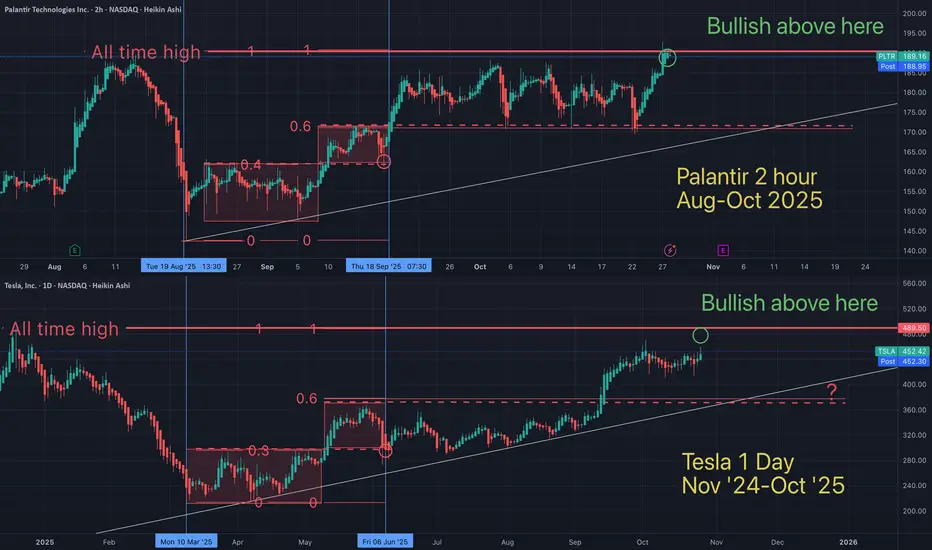
Tesla / Palantir fractal showing both will hit ATH soonFractals are a mathmatical anomaly, if you understand linear equations (and believe the market is "random"). All assets are doing the same patterns over and over, on all time frames. You just need to see it for what it is.
May the trends be with you.
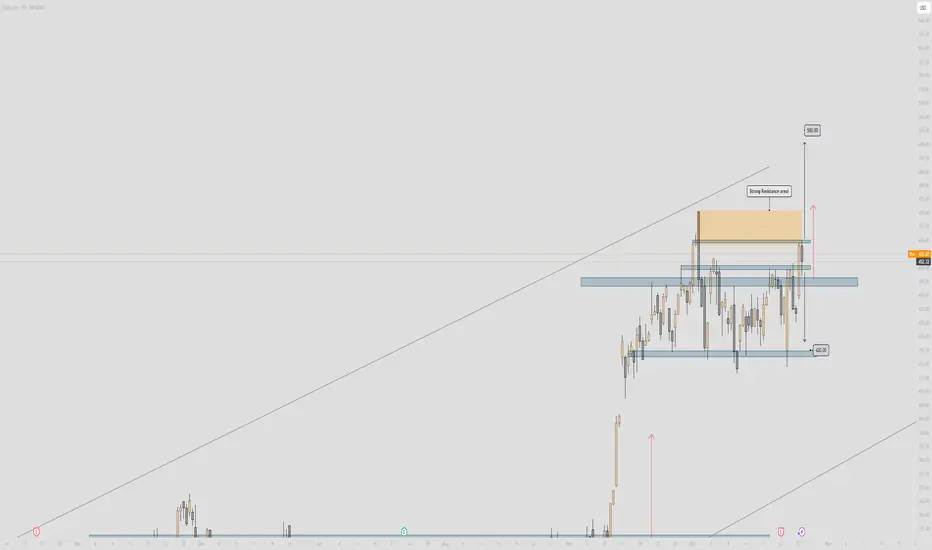
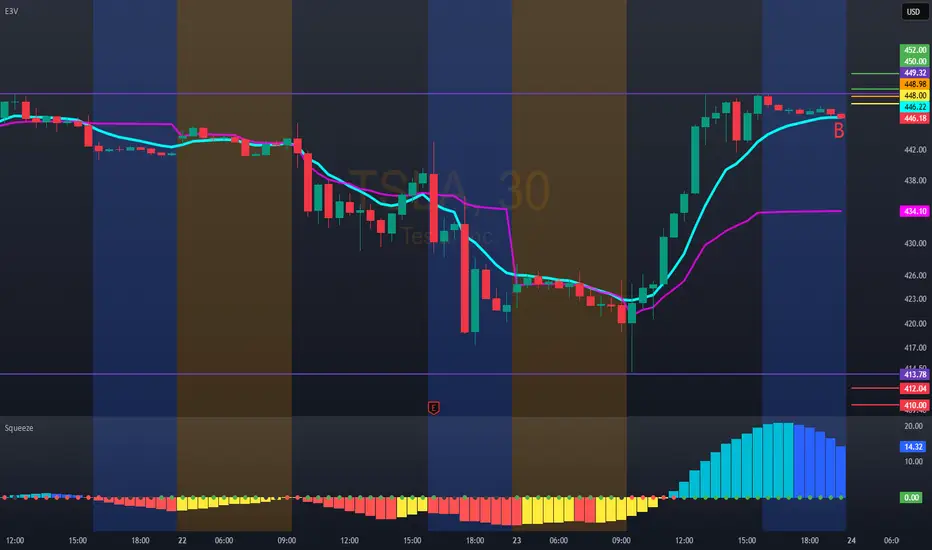
Tesla Macro ChartSharing my Macro Chart.
Use this as a reference for the levels of interest mentioned in my previous tesla post. Added a 30 minute box within the weekly balance box.
I like to personally use this chart to monitor levels intraday on the 30 minute or to plan major shorts or buys.
Some of these levels were drawn a year ago probably but I hope you'll find them useful.
~The Villain

Tesla at major support. I'm long.Tesla is at major yearly support. Confluence between levels and fib. This is where we need to hold to maintain the trend on the monthly chart. I don't know if it will hang out at this level or possibly go below the level before we regain and higher. But this is a valid long trade at these levels. If we don't hold here it is much lower. Long term target is $670. Remember the fud around Tesla is meaningless. It's all the charts. If the markets were "rational" we wouldn't even be at these levels in the first place.

Tesla Approaching Key Resistance: Bullish Breakout Likely Current Price: $433.72
Direction: LONG
Targets:
- T1 = $465.00
- T2 = $485.00
Stop Levels:
- S1 = $420.00
- S2 = $410.00
**Wisdom of Professional Traders:**
This analysis is driven by insights from thousands of seasoned traders and financial analysts who are closely monitoring Tesla’s price movements and technical setups. The collective evaluation highlights that Tesla is at a pivotal point, with its current price showing strong indications of a potential breakout above existing key resistance levels. Professionals often emphasize the importance of aligning macroeconomic factors, company fundamentals, and technical trends when forecasting Tesla’s trajectory. By synthesizing these views, this post offers a high-probability trade opportunity.
**Key Insights:**
Tesla continues to benefit from its dominance in the EV space, with technological advancements such as improved battery efficiency and enhanced self-driving capabilities giving it a competitive edge. The company’s Q3 2025 performance demonstrated resilience, with deliveries recovering year-over-year amidst concerns about economic slowdowns. Tesla’s diversification into energy storage and grid solutions is increasingly recognized as a meaningful driver of growth beyond its automotive division, contributing to broader revenue streams.
Technically, Tesla’s stock has been coiling near its $430-$440 resistance band for the past few weeks, showing signs of bullish consolidation. Volume has been building, while Relative Strength Index (RSI) suggests upward movement is in play without entering overbought territory. Breakouts from such critical resistance zones typically result in strong follow-through price movements, with potential gains toward the $465 and $485 regions.
**Recent Performance:**
Tesla has seen a steady recovery in the past quarter, regaining momentum after a slight dip earlier in the year. The stock showed resilience despite industry-wide concerns surrounding EV demand and global economic pressures. Over the last two months, Tesla’s stock has appreciated by over 12%, recovering from $390 levels to its current price point. Strong institutional buy-side interest and reduced short interest have supported its upward trajectory, indicating confidence in future growth prospects.
**Expert Analysis:**
Technical analysis reveals a bullish setup, with Tesla’s short-term moving averages (10-day and 20-day) trading above its longer-term averages, including the 50-day and 200-day moving averages. This "golden cross" signals bullish sentiment may guide the stock higher as positive trading activity picks up momentum. Traders also observe tightening Bollinger Bands, which may act as a precursor to volatility expansion in the upward direction.
Additionally, macro outlooks for Tesla remain positive as the global push for electric vehicle adoption continues to gain traction. Experts believe Tesla’s ability to maintain high margins despite pricing pressure is a critical long-term advantage. The financial guidance for Q4 2025 indicates consistent revenue growth, further supporting the bullish sentiment for the stock.
**News Impact:**
Notably, Tesla’s recent announcement of a major partnership to deploy its battery technology for utility-scale energy storage systems has generated significant excitement in the market. Analysts view this as a game-changer that could carve out an additional revenue stream for Tesla, diversifying its earnings base. Additionally, regulatory incentives across Europe and Asia to accelerate EV adoption are expected to favor Tesla’s market penetration efforts, bolstering its stock performance in the near term.
**Trading Recommendation:**
The current technical setup, robust fundamental tailwinds, and optimistic growth outlook signal a strong buying opportunity for Tesla. A clear breach of the $440 resistance level could pave the way for a bullish breakout, targeting $465 in the near term with the potential for further gains toward $485. Risk management is crucial, so traders should consider setting their stop levels at $420 and $410, respectively, to protect against downside risk. Tesla’s diversified growth strategy and recent positive news position it as a solid long trade with upside potential in the coming months.
Do you want to save hours every week? Register for the free weekly update in your language!

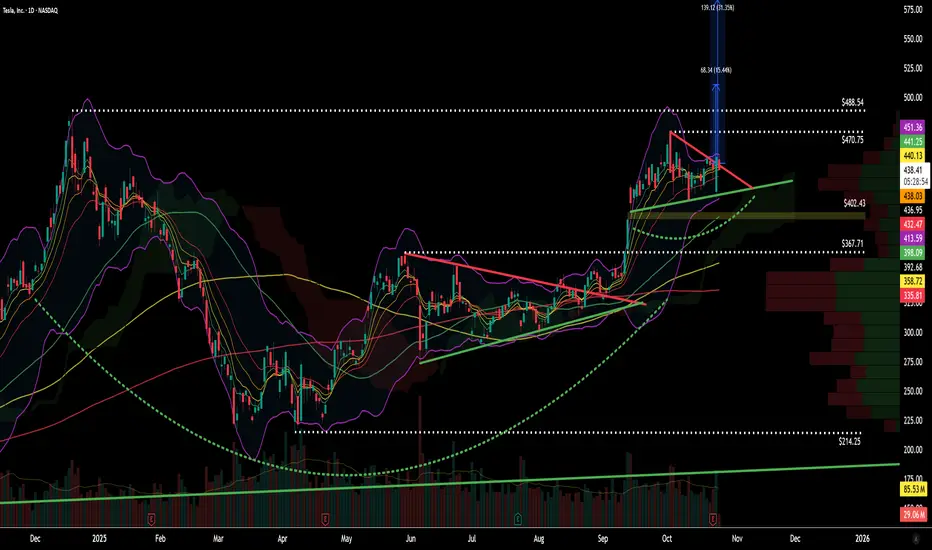
$TSLA – Bull Pennant Sequence & Cup-and-Handle ContinuationThis is a follow-up to my August–October technical outlook on Tesla ( NASDAQ:TSLA ).
After the first bull pennant breakout, price pushed to $470, falling just shy of my initial $480 target, before pausing and forming another bull pennant directly below December’s all-time high near $488.
Structure & Momentum
Momentum remains strong — the daily chart has now completed a cup and handle formation, adding a new layer of continuation confluence to the broader trend structure.
The key takeaway here is that NASDAQ:TSLA continues to respect rising MAs and trendline support, consolidating at high levels rather than breaking down — a bullish sign of controlled digestion after a strong run.
To confirm a full breakout continuation, the chart now needs a decisive move through $488 on high volume. Until that happens, the current pennant acts as both a compression zone and accumulation phase.
Breakout & Targets
If volume expands and NASDAQ:TSLA clears the $488 ATH, the next resistance targets are:
Target 1: $510 → symmetrical triangle 1:1 projection
Target 2: $580 → measured move from flagpole #2 (pennant #1 extension)
Both levels represent high-probability reaction zones where price could pause or retrace before resuming trend.
Support & Risk Management
Below, the chart shows clear structural support at:
$402 → prior breakout base and Ichimoku cloud zone
$367–$370 → trendline & confluence support
As long as price respects these zones, the setup remains valid and constructive.
A close below $370 on strong volume would invalidate the near-term bullish bias.
Technical Summary
✅ Trend: Bullish continuation
✅ Pattern: Cup & Handle + Bull Pennant #2
📊 Key Resistance: $488 (ATH)
🎯 Targets: $510 / $580
⚠️ Support Watch: $402 → $370
🔍 Trigger: Breakout confirmation on strong volume
Final Notes
Tesla continues to show a textbook multi-phase breakout structure — bull pennant, consolidation, and potential measured-move continuation. Until the breakout confirms, patience around $488 remains key. Once volume supports it, the next leg higher could complete the second flagpole move toward the $510–$580 range.
For educational and technical analysis purposes only.
TSLA – Post-Earnings Breakout Clears Triangle Resistance Toward Tesla (TSLA) delivered a strong post-earnings reversal, breaking out of a multi-week symmetrical triangle pattern that had kept price compressed between $410 and $450. After initially trading lower on earnings, buyers stepped in aggressively, driving the stock from the low $420s all the way to a breakout high of $470.76, reclaiming both trendline and psychological resistance levels.
This move officially confirms a bullish breakout from the consolidation pattern formed since early September. The breakout is supported by strong volume, signaling momentum buyers returning after the earnings washout.
If price holds above $450–$455, Tesla could see continuation toward $480–$490 in the coming sessions. However, a pullback toward $440–$445 would be healthy and could provide a retest entry if bulls maintain control.
Support & Resistance Levels:
Support: $445.00 → $435.00 → $420.00
Resistance: $470.00 → $480.00 → $490.00
Bullish Play:
Entry: Above $455 breakout retest
Target: $475 → $485
Stop: Below $440
Options Idea: $480 Call (2–3 weeks out) if price holds above $450

TSLA at a Crossroad: Can Bulls Push Through $450 Wall on Oct 241. Market Structure (1H & 15M)
Tesla’s price structure is showing a clear short-term bullish shift after back-to-back CHoCH confirmations from the $415 zone, where buyers absorbed liquidity aggressively. The Break of Structure (BOS) on the 15-minute around $440–$445 confirms that smart money rotated back into long positions after a liquidity sweep of last week’s lows.
On the 1-hour chart, TSLA is reclaiming momentum above its recent CHoCH zone near $420, building a stair-step structure toward the previous supply zone at $450–$455. The trendline drawn from the previous lower highs (extending from the $470s) still acts as a major trend barrier, meaning a clean break and hold above $450–$452 is the confirmation bulls need to signal a higher timeframe reversal.
Smart money accumulation looks evident between $415–$425, where volume clusters align with the CHoCH reversal. Above that, liquidity resides at $455–$460, a potential magnet if momentum sustains through Friday.
2. Supply and Demand / Order Blocks
* Demand Zone (High Probability Reaccumulation): $415–$425. This zone was defended twice and coincides with prior sell-side liquidity.
* Immediate Support / Fair Value Gap Fill Area: $435–$440, likely to act as intraday springboard if retested during premarket dip.
* Supply Zone / Sell-Side Liquidity: $450–$455. This aligns with the 1-hour bearish order block formed from the Oct. 17–18 breakdown.
Expect a reaction near $450 — either a rejection for intraday pullback or a breakout continuation if bulls trap shorts above it. If price clears that level with strength, next supply sits around $462–$465.
3. Indicator Confluence
* 9 EMA vs 21 EMA: Both EMAs have crossed to the upside on the 15-minute and are starting to fan out on the 1-hour, confirming a short-term bullish bias.
* MACD: The histogram shows strong positive momentum with expanding bars on the 1-hour, but slight divergence on 15-minute as momentum cooled late in the session — suggesting a possible small pullback before continuation.
* RSI: Hovering around 70 on the 1-hour, indicating overbought conditions but still within bullish control. On 15-minute, RSI has cooled off near 60, resetting for potential continuation.
* Volume: Expansion noted during the breakout, confirming participation. Momentum remains positive unless volume fades on retest.
4. GEX (Gamma Exposure) & Options Sentiment
According to the GEX chart, $450–$455 is the 2nd major call wall and highest positive gamma zone, while $420 remains the strongest PUT support for Friday (10/24). The HVL (High Volume Line) around $430 aligns perfectly with the mid-support of the structure.
Dealer positioning remains net positive gamma, meaning we can expect controlled movement unless price breaches outside the $420–$455 zone. A sustained move above $450 would likely force dealers to hedge upward, fueling a gamma squeeze toward $460+. Conversely, if TSLA rejects and falls back below $440, expect volatility expansion downward toward the $420 PUT wall.
Current IVR (6.1) and IVx (≈60) show low implied volatility, hinting that options are relatively cheap — favorable for directional plays. Call flow sits around 64%, reinforcing bullish sentiment for tomorrow’s session.
5. Trade Scenarios for Friday, Oct. 24
Bullish Setup 🟩
* Entry Zone: $443–$445 retest or reclaim above $450
* Target Levels: $455 → $462 → $470 (if squeeze triggers)
* Stop-Loss: Below $438 (invalidate short-term structure)
* Confirmation: Hold above 9EMA on 15-min with MACD histogram remaining green and RSI > 60
Bearish Setup 🟥
* Entry Zone: $450–$455 rejection zone
* Target Levels: $440 → $430 → $420
* Stop-Loss: Above $457 (invalidate bearish rejection)
* Confirmation: MACD red crossover + RSI divergence + 15-min CHoCH to downside
6. Closing Outlook for Oct. 24 (Friday)
Tomorrow’s session could be decisive. If bulls defend $440–$445 early and reclaim $450 with conviction, it opens the door to a Friday gamma squeeze into $460+. But if momentum fades and $440 gives way, expect a controlled retrace back into the $425–$430 demand.
Personally, I’m watching $450 as the battleground — it’s both a psychological level and a technical liquidity point tied to heavy options flow. Any strong break with volume could trigger dealer hedging upward. But failure to sustain above it might lead to a Friday fade, especially into the afternoon session when gamma neutralizes.
📈 Final Thought:
“TSLA is coiled between $440–$450 — and tomorrow, one side will get trapped. If bulls hold the floor, expect fireworks into $460+. If not, $425 retest is back on deck.”

Good morning trader, TSLA for tomorrow: 448.98Economic report
Bullish entry 450.00/452.00
Technical bearish entry 448.00. Let's hope the market follows.
Tesla - The massive triangle breakout!🪩Tesla ( NASDAQ:TSLA ) is breaking out:
🔎Analysis summary:
Last month, we witnessed an incredible but expected rally of about +35% on Tesla. Furthermore, with this move Tesla is attempting to break above the previous all time highs. After bullish confirmation, this would also lead to a massive triangle breakout.
📝Levels to watch:
$400
SwingTraderPhil
SwingTrading.Simplified. | Investing.Simplified. | #LONGTERMVISION

Tesla Wave Analysis – 23 October 2025- Tesla reversed from support area
- Likely to rise to resistance level 467.30
Tesla recently reversed from the support area located between the key support level 415.60 (which has been reversing the price from the middle of September) and the lower daily Bollinger Band.
This support area was further strengthened by the 38.2% Fibonacci correction of the upward impulse from August.
Given the strong daily uptrend, Tesla can be expected to rise to the next strong resistance level 467.30 (top of the previous impulse wave i).

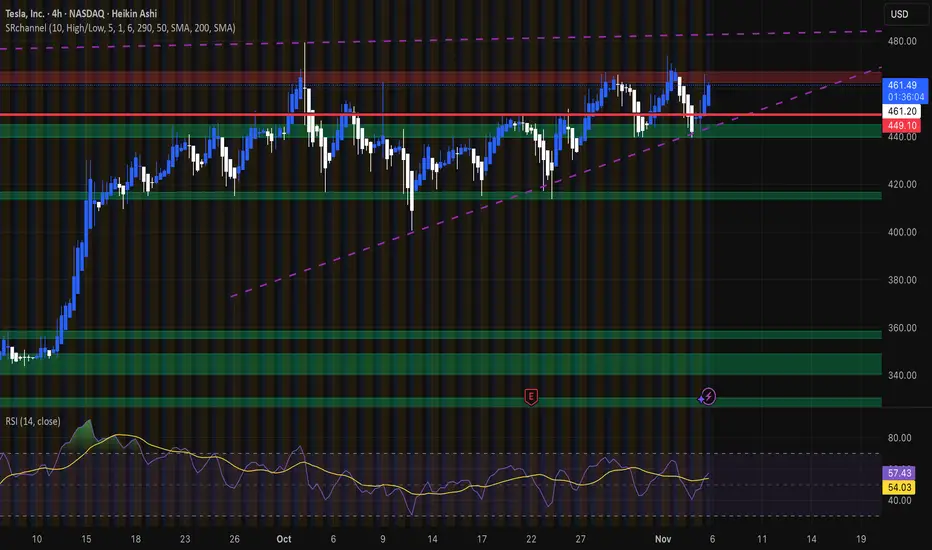
Dip to 449 and revers along with RSI divergenceTSLA can di tomorrow to 449 and reverse. a great swing possible with 449 entry l;eading to 460+
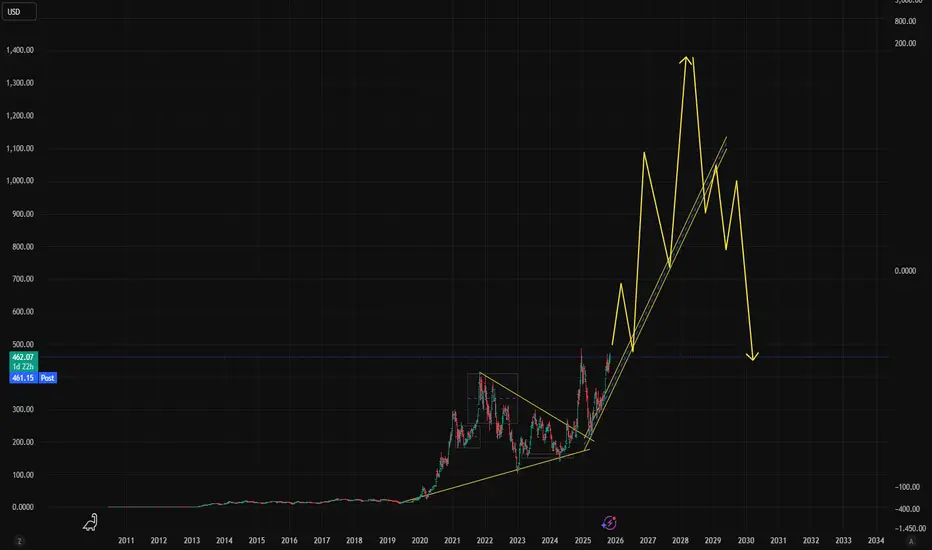
$TSLAHi we are back again with another banger: NASDAQ:TSLA
This is not financial advice but it is very much just key insight.
Here we have NASDAQ:TSLA trading at $462.07 with a potential %, which can bring 100%+ in profits.
Elon musk is doing great things for humanity, and TSLA is going to be a pillar of earths future success. With saying that we know Elon wont let earth of his NASDAQ:TSLA share holders down.
Possible bull market until the end of 2026 which is where we can start to see a break down in trend which would possibly be above $1000+ per share.
Don't forget to use your NASDAQ:TSLA shares to vote today :)
Thank You Elon Musk for everything !!
Don't forget to Comment Like & Share with a friend for good luck, peace out !!
A short-term buy tradeCould this be a short-term buy trade?
Stop loss below $411.
The target profit could be around $670. Exiting in case of a change in conditions midway is also possible.
