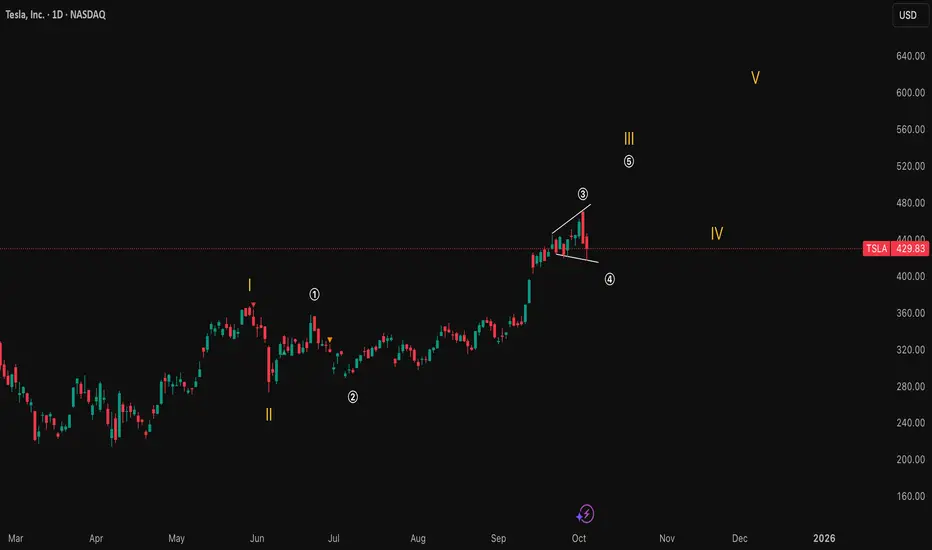
$TSLA | Medium-Term Elliott Wave Outlook (2025–2026)🔮 NASDAQ:TSLA | Medium-Term Elliott Wave Outlook (2025–2026)
Price action shows a mature 5-wave structure approaching completion.
The next probable phase is a corrective ABC retracement before a new expansion leg begins.
🧭 Base Case (Most Probable ~60%)
End of current impulse around $527–$540
Correction to $380–$400 region (Wave A–B–C)
Mid-to-long-term expansion toward $615 → $705 → $869+ by late 2026
⚙️ Technical & Macro Confluence
RSI + volume divergence confirming wave exhaustion
Macro liquidity compression aligns with corrective phase
Institutional demand re-entry near $395–$400 zone
Fibonacci & structure symmetry consistent with this projection
📊 Bias: Short-term bearish → Medium-term accumulation → Long-term bullish.
📅 Cycle Horizon: 2025–2026
“Correction isn’t collapse — it’s the reload before expansion.”
#TSLA #ElliottWave #Macro #VolanXDSS #WaverVanir
Trade ideas

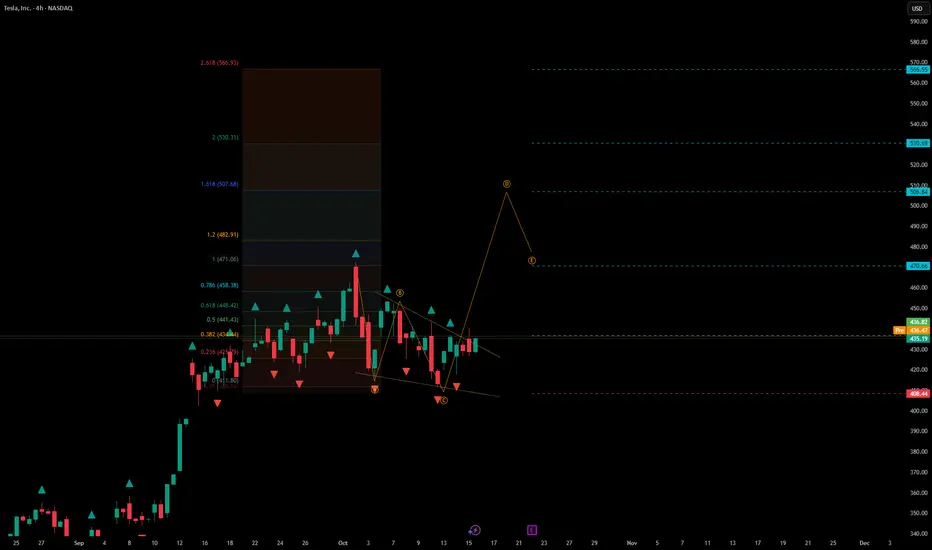
$TSLA | Wave Count Outlook: 2025–2026 Projection👇
🔮 NASDAQ:TSLA | Wave Count Outlook: 2025–2026 Projection
The larger structure is forming a clean Elliott Wave sequence, suggesting a potential top near the completion of Wave (5) before a corrective phase unfolds.
🧩 Structure Overview:
Primary impulse appears complete between $527–$540
Corrective phase (ABC) projected toward $384 → $332 → $319
If confirmed, this would align with the macro liquidity contraction and potential market re-pricing post-Fed actions
🔍 Technical Confluence:
Wave (5) targets align with 1.236–1.618 Fibonacci extensions
RSI divergence already forming — early weakness
Volume momentum decelerating across higher timeframes
🧭 Outlook:
Short-term bias: Neutral to bearish
Medium-term (1–3 months): Potential correction toward $380s
Long-term (Q2–Q3 2026): Bullish resumption possible if liquidity stabilizes
“Wave completion precedes transformation — patience pays.”
#TSLA #ElliottWave #TechnicalAnalysis #Macro #VolanXDSS #WaverVanir

TSLA – Calm Before the Storm or Just Another Dip Buy?Tesla (TSLA) is trading around $315, bouncing off recent lows, but this isn’t just a clean technical setup. With Elon Musk’s political drama escalating (hello, “America Party”) and ongoing tension with Trump, TSLA is becoming a battleground stock with serious volatility.
As swing traders, that’s exactly where we thrive.
📍 Entry Plan
✅ Entry #1 – $315
✅ Entry #2 – $300
• Previous breakout zone — ideal for dip buyers
✅ Entry #3 – $265
• Strong macro support; only activated if market correction deepens.
🎯 Profit Targets
• TP1: $335
• TP2: $355
• TP3: 400+ – if sentiment + volume align with narrative momentum (think: Robotaxi or AI catalyst)
If $265 gets hit, I’m not panicking, I’m preparing for high-reward setups.
⚠️ Disclaimer: This is not financial advice. I’m just sharing my plan and technical zones. Always do your own research and manage your risk.
📌 Follow for more ideas based on price, narrative, and timing. Trade smart — not loud. 🧭📈

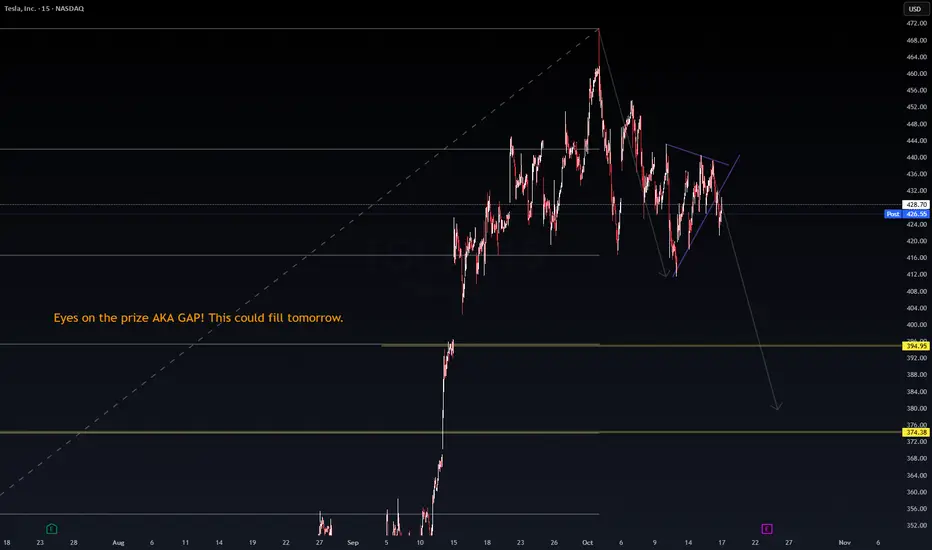
$TSLA Eyes on the prize — AKA the GAP NASDAQ:TSLA
Eyes on the prize — AKA the GAP 🧠
This imbalance could fill tomorrow if momentum continues downward.
RSI cooling off, structure leaning bearish, and that liquidity pocket below looks too tempting to ignore.
Just watching price react to the zone — not financial advice.
#TSLA #VolanX #GapFill #LiquidityZones #AITrading
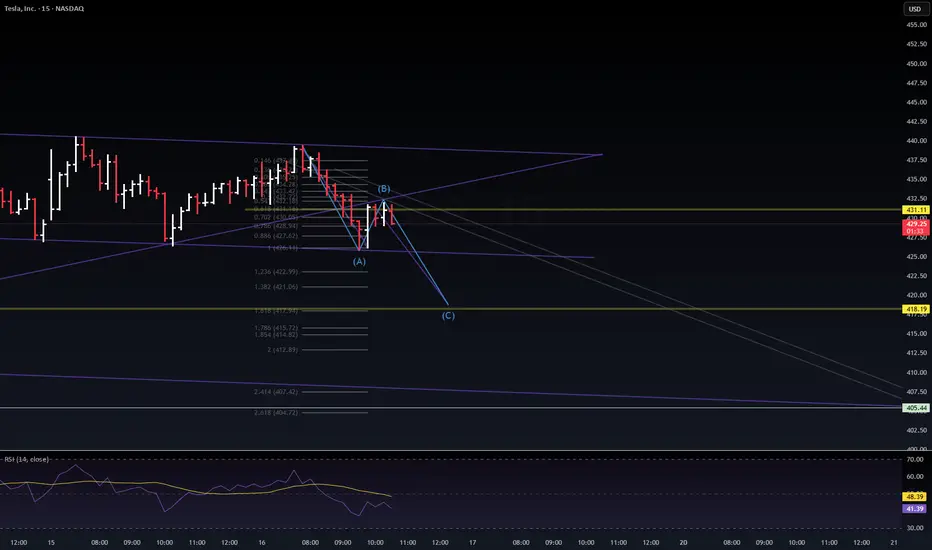
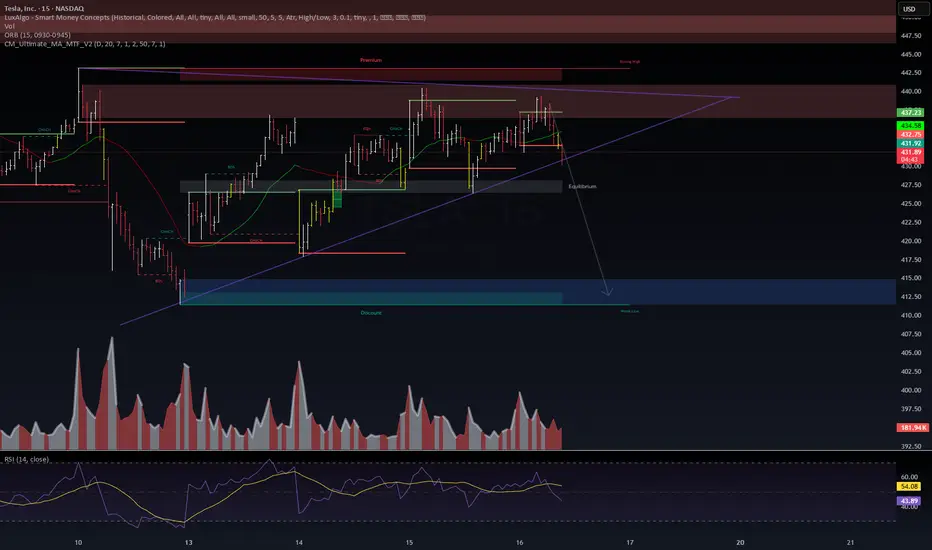
$TSLA Wave (B) rejection looks valid NASDAQ:TSLA
Wave (B) rejection looks valid — system preparing for Wave (C) extension. ⚠️
0.618 retrace rejection confirmed
RSI divergence remains bearish
Target → $418 → $405 liquidity zone
DSS short bias until structure breaks above $432
VolanX mode: “Drain before reversal.” 🧠
#VolanX #AITrading #TSLA #ElliottWave #SmartMoneyConcepts
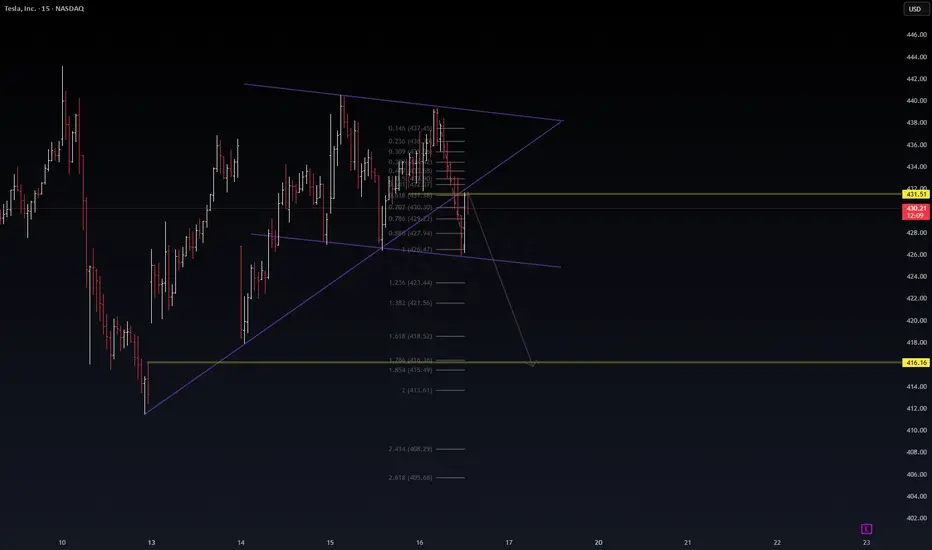
$TSLA Symmetrical wedge still holdingNASDAQ:TSLA
Symmetrical wedge still holding — but liquidity structure is breaking down. ⚠️
Loss of equilibrium → signals start of the drain phase
RSI mid-compression, sellers gaining control
Targeting $415 → $405 zone (liquidity collection)
Invalidation above $432
VolanX DSS bias: Short until liquidity reclaims 🧠
#VolanX #AITrading #LiquidityZones #SMC #TSLA

TSLA: Trying to draw all the algos I know. NASDAQ:TSLA
Clean breakdown forming from the wedge 🧠
Price rejected perfectly near 0.618–0.702 retracement
Targeting $416–$415 (liquidity pocket)
RSI turning down, sellers taking control
If bulls can’t reclaim $432, this could accelerate fast.
Bias → Short ⚡
#VolanX #LiquidityZones #AITrading #TSLA #SmartMoneyConcepts
TSLA ShortMarket Structure:
Tesla is currently in a bearish market structure following a failed attempt to sustain higher highs. After a Change of Character (CHoCH) around $443.55, price shifted from a bullish correctional phase into a downward sequence. The prior upward leg that established short-term higher highs has now been rejected decisively, and price is printing lower highs and lower lows, confirming bearish control. The recent Break of Structure (BOS) is expected near $411.44, indicating that sellers regained dominance and are likely targeting liquidity beneath recent lows.
Supply & Demand Zones:
The supply zone between $435.00 and $439.00 remains significant—price dropped sharply from here after a clean retest, showing strong institutional selling pressure and minimal buying defense. This zone remains structurally strong and continues to cap upside attempts. Below, the demand zone around $425.00–$421.00 has provided short-term support in the past, but the reaction there was weak, suggesting that buyers stepped in cautiously rather than with conviction. The next deeper demand zone lies around $411.00–$407.00, where buyers previously showed more commitment with larger wicks and impulsive upward movement.
Current Price Action:
Price is currently pushing down toward the $425.00–$421.00 demand zone after rejecting the supply above. The short-term expectation is for a minor pullback toward $428.00–$430.00, potentially forming a lower high, before a continuation lower toward the $411.00 zone. The projection on the chart aligns with this view, anticipating a temporary pause before renewed selling.
Bias & Outlook:
The trade bias is bearish, with expectation of continued downside movement toward $411.00–$410.00. A confirmed close above $439.00 would invalidate this view and shift short-term sentiment back to bullish. Until that happens, sellers remain in control.
Momentum & Candle Behavior:
Momentum currently favors the sellers, as seen in consecutive bearish candles with solid body structures and smaller wicks. Bullish candles show limited follow-through, indicating fading demand strength. No strong reversal patterns are visible yet; only mild compression before another expected impulse down.

TESLA EARNINGS OCT 16 2025Price action for Tesla is here. I have clearly explained my plan on how to trade tesla considering every factor in market.
STAY AWAY FROM TRADING TESLA
NOTE: OPTION WILL BURN YOUR CAPITAL

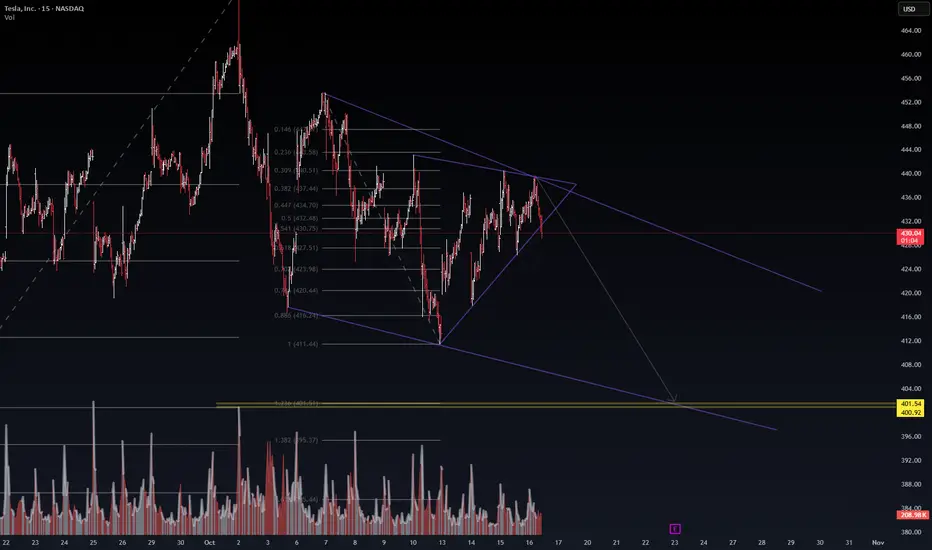
$TSLA: Symmetrical wedge breaking down. NASDAQ:TSLA
Symmetrical wedge breaking down. ⚠️
Volume confirms exit pressure — sellers controlling equilibrium.
Lower highs compressing liquidity.
Fib confluence supports a leg toward $411–$401 zone (1.0–1.272 extension).
RSI momentum flattening under 50.
DSS bias = short-term bearish continuation.
Target → $401–$400 liquidity pool
Invalidation above $436.50
This could be a slow liquidity drain before a bigger displacement. 🧠
#VolanX #LiquidityZones #AITrading #TSLA #SMC
TSLA: SHORTNASDAQ:TSLA
Setup aligning with VolanX DSS bias → short confirmation zone active.
Rising wedge pattern breaking structure
CHoCH under equilibrium, signaling early distribution
Volume increasing on sell-side
RSI divergence + loss of bullish momentum
Targeting $415–$412 liquidity zone (discount area).
Invalidation above $437.50 — clean risk box.
Bias: Short
Strategy: Wait for 15m BOS + volume spike confirmation 🧠
#VolanX #LiquidityZones #AITrading #SmartMoneyConcepts #TSLA
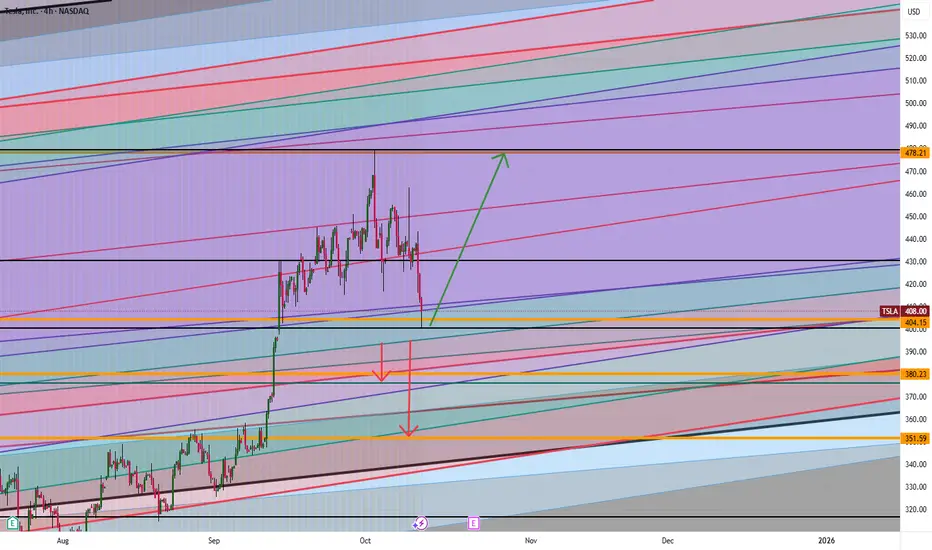
Tesla: Will It Blast Off or Fall Fast? The $404 Level Is the KeyTesla is at a big “make or break” point. If the price stays higher than $404, it could blast up to $437 or maybe even $478. But if Tesla drops below $404, watch out! It could fall down to $380 or even as low as $351.
Think about it:
What would you do if Tesla started moving toward those numbers? Do you think it will go up or will it go down?
If you’re not sure or have a question, send me a message! Sometimes asking one good question can help you make a smarter trade. What do you want to know about Tesla right now?
Mindbloome Exchange
TSLA last point of support before push UPWhere the sellers at? Support is holding well close to a local resistance. Unless buyers are exhausted and wait for a pull back, we're going up from here into selling zone
Tesla (TSLA) — Momentum Reload or Major Cooldown?The Next $400–$450 Decision Zone!
🧭 Weekly Chart — Big Picture Momentum
Tesla has printed one of the cleanest BOS (Break of Structure) patterns on the weekly timeframe since the post-2023 recovery, confirming that the macro downtrend has flipped into a sustained bullish expansion. The stock ripped from its $216 CHoCH base and is now consolidating above the prior macro breakout line near $425.
However, the latest weekly candle shows stalling momentum, forming a short-term distribution near the $430–$440 region. That zone lines up perfectly with the previous supply structure and fib confluence from 2022 highs.
The MACD histogram remains strongly positive but is beginning to flatten — early warning that buying pressure might be easing. Stoch RSI is also hovering near overbought at 85+, signaling the need for a short-term reset before the next leg.
* Bullish scenario: A weekly close above $436–$440 would confirm strength continuation toward $488–$500, the next liquidity zone.
* Bearish scenario: A close below $410 opens the door for a healthy pullback to $367–$376, a major equilibrium level with demand imbalance and previous BOS base.
Weekly takeaway: Trend remains bullish, but short-term overextension hints at a pause or mild retracement before another drive up.
⚙️ Daily Chart — Structure and Cooling Phase
The daily chart confirms Tesla’s minor pullback within the larger bullish wave. After breaking above $400 with strong momentum, price is now consolidating just above its breakout order block ($415–$420).
The BOS on daily shows continuation potential, but MACD has started printing red bars — suggesting that momentum is fading and a retest is underway. The Stoch RSI sitting high around 93 indicates the correction may continue until momentum rebalances.
* Bullish case: If TSLA can hold $416 and print a higher low, the next upside targets are $442 → $455, then $488 (supply zone).
* Bearish case: A daily close below $414 would invalidate near-term bullish control, triggering a slide toward $400–$397, a major demand block that aligns with GEX PUT support.
Daily summary: Still in bullish structure, but short-term retracement needed for healthy continuation. Watch for $415 hold as pivot.
⏱ 1-Hour Chart — Trading Plan
On the 1-hour chart, TSLA is forming a short-term consolidation wedge between $420 and $436 after multiple CHoCH and BOS flips. The stock is bouncing between mid-range liquidity pockets, showing clear indecision from both sides.
MACD is recovering from a previous bearish cycle, while Stoch RSI has crossed up from mid-levels — showing early signs of a micro-bounce in progress.
Volume confirms that buyers are active at $424–$425 zone, but strong resistance remains near $436–$440.
Trading Plan:
* Bullish setup: Enter above $436 breakout with target $445 → $455, stop at $425.
* Bearish setup: Short if $420 fails with downside target $405 → $400, stop at $430.
This structure allows swing-to-scalp flexibility — traders can lean bullish above $425 but must stay cautious until price reclaims $436 decisively.
💥 Options GEX & Institutional Positioning
Based on the Options GEX chart:
* Highest Call Wall: $450 — heavy resistance and likely magnet if bulls push higher.
* Next positive GEX zone: $445, where gamma flips positive and market makers chase delta hedges upward.
* Major PUT Wall: $400 — strong defense area, aligning perfectly with chart structure and demand.
* IVR 25.7 / IVx 67.7 → volatility premium moderate, favoring directional plays with limited spreads.
Gamma interpretation: As long as price holds between $425–$440, market makers maintain positive gamma, keeping price pinned and range-bound. A clean breakout above $440 could trigger a gamma squeeze toward $455–$460.
🎯 Option Strategy Ideas
1️⃣ Bullish Continuation Play:
* Buy $430C / Sell $450C (Oct 25 expiry) — risk ~$6 for a potential $14 reward if Tesla rallies to $450+.
* Aggressive intraday: Buy 0DTE/2DTE $430 Calls only if price reclaims $436 with volume.
2️⃣ Bearish Hedge:
* Buy $420P / Sell $400P (Oct 18 expiry) — ideal if $420 support fails and correction deepens.
3️⃣ Neutral Income Strategy:
* Expecting chop between $420–$440? Sell Iron Condor ($440C/$450C and $410P/$400P) to profit from time decay.
💬 Final Thoughts
Tesla remains one of the strongest setups in the market — the bullish macro trend is intact, but current levels are stretched. Expect sideways or minor correction before another breakout attempt. The $415–$425 area is the key battleground: lose it, and we test $400; reclaim $436+, and the rocket’s back on for $455–$480.
My TA continues to show high win-rate accuracy, and if you’ve followed previous analyses, you’ve seen how precise these levels play out.
If there’s any stock you want me to analyze next — even ones I don’t usually post — DM me and I’ll be happy to break it down for you.
This analysis is for educational purposes only and does not constitute financial advice. Always do your own research and manage your risk before trading.

TSLA Long due to Exhaustion of sellersSellers are exhausted close to the local Resistance. We're expecting a rally at least as large as the last Rally or a 30% improvement

Tesla reports Wednesday; analysts expect EPS of $0.55Tesla reports third-quarter earnings Wednesday after the close, with analysts expecting EPS of $0.55, down from $0.72 a year earlier, on revenue of $26.2B — up 4%. There’s room for an upside surprise after record Q3 deliveries of 497,099 vehicles, boosted by the now-expired $7,500 U.S. EV tax credit, which also trimmed inventories. Analysts will focus on Elon Musk’s plans for robotaxi scaling, autonomy progress, and upcoming models through 2026, along with updates on new “Standard” Model 3 and Y trims. Wall Street projects about 450,000 deliveries in Q4.
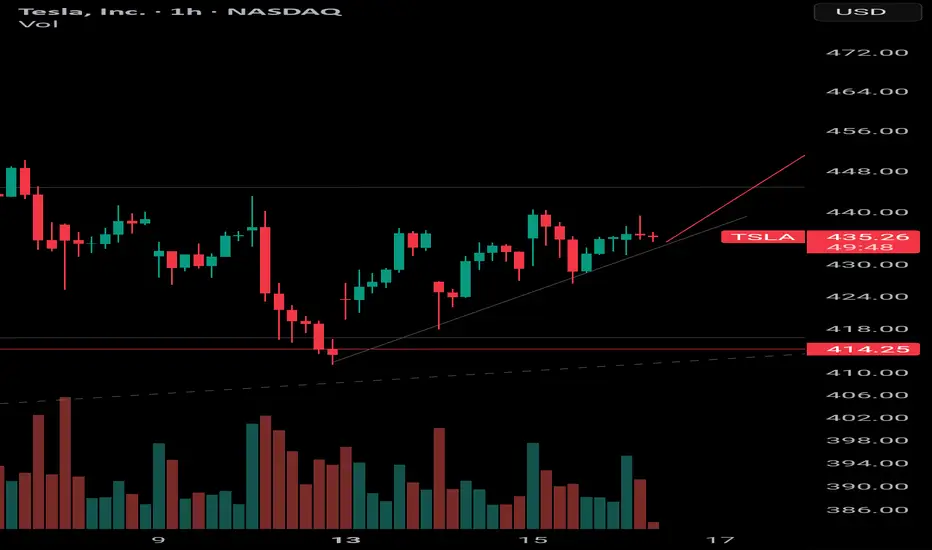
Tesla is holding firm near $418, with its RSI turning higher to signal improving momentum. A positive EMA crossover — along with clear angle and separation between the averages — would confirm a strengthening bullish trend.

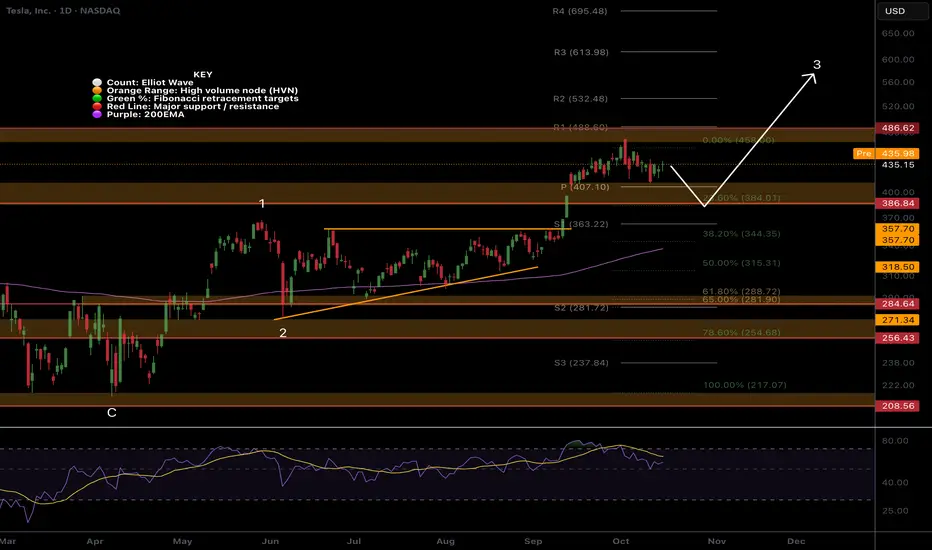
TSLA looks ready for higher in wave 3NASDAQ:TSLA found resistance at the all time High Volume Node and is trapped between that and the high volume support node.
The trend is up and strong. above the daily pivot and daily 200EMA with width.
I expect price to find support and continue into price discovery.
Safe trading
Tesla – ABC Formation as Trend Continuation#Tesla – ABC Formation as Trend Continuation
Current price: $435.8
Tesla is developing an ABC corrective structure that may act as a continuation pattern within the broader uptrend. Price action is consolidating after a strong impulsive leg, preparing for the next directional move.
🧩 Technical Overview
• The correction from the recent high appears to have formed a descending wedge, with the last swing down completing near the C-wave low.
• Price is now recovering from that area, suggesting a possible upward continuation phase.
• As long as the current low holds, the market structure supports bullish continuation through the upper Fibonacci levels.
📈 Scenario
• Structure: ABC correction completed; price attempting breakout to resume the dominant uptrend.
• Stop-loss: below the C-wave low (~$408).
• First upside objectives:
– $448–$458 — short-term resistance zone
– $470–$483 — key breakout area and prior swing high
– $507–$530 — potential extension zone if momentum builds
• A breakout above $470 would confirm trend continuation.
⚙️ Market Context
• The larger bullish trend remains intact after strong momentum from early September.
• Consolidation within the current wedge has reduced volatility — a typical setup before expansion.
• The pattern favors continuation as long as price holds above $408–$410 support.
🧭 Summary
Tesla is completing an ABC correction that could transition into the next bullish leg.
Holding above $408 keeps the structure valid for continuation toward $470–$530.
Breakout confirmation above $470 would reinforce the bullish scenario, while a drop below $408 would invalidate it.
Option Alert: $TSLA NOV 07 2025 $440 Calls – 78% ROI Potential WEnter: NASDAQ:TSLA NOV 07 2025 $440 CALLS
Buy in Price: $25.58 - $25.60
Take Profit: $45.53
Stop Bleeding: $22.51
ROI Potential: 78%
Exit Within: 2 Weeks

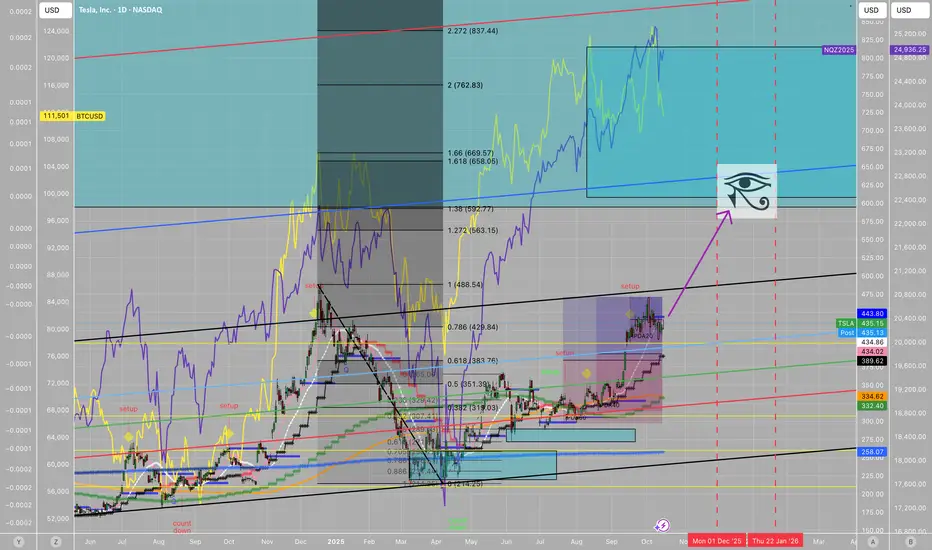
Timing of a $TSLA peaktiming of a NASDAQ:TSLA peak 12/1/2025 to 1/22/2026 based on astrology. target time zone between dotted vertical red lines.
price target is not specified but i expect some type of upper trendline hit along the fib channels.
wave 4 in a wave 3 I’m predicting this path for Tesla — we’re in wave 4 of a larger wave 3, so it might get a bit volatile before continuing upward toward 500–520 . We’ll see what happens ☀️
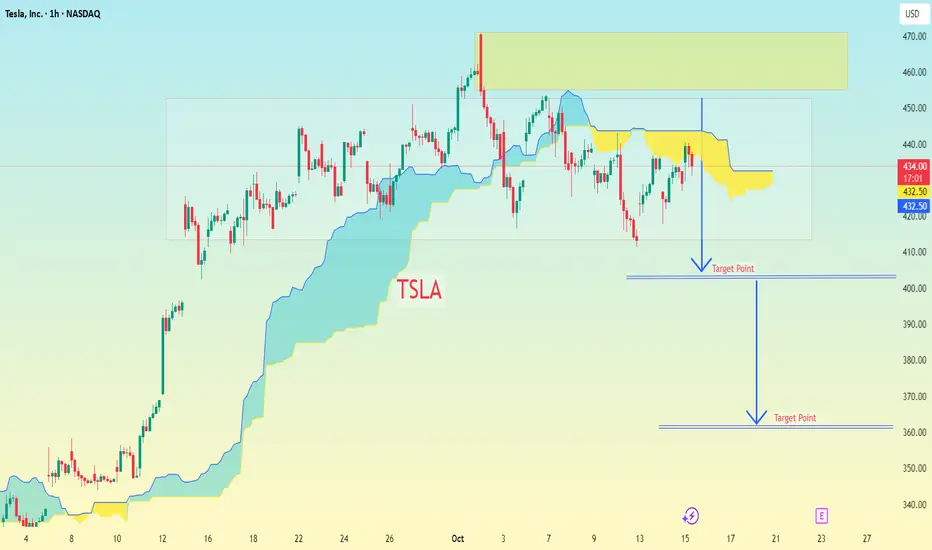
TSLA with Ichimoku Cloud...TSLA with Ichimoku Cloud and projected target points drawn below the current price.
Let’s break it down:
Current price on chart: around $434
Yellow zone (resistance): roughly $445–$465
First target line drawn: around $405–$410
Second (lower) target line drawn: around $365–$370
📊 Interpretation (based on my chart):
Target Level Approx. Price Meaning
1st Target $405–$410 Short-term support / take-profit zone
2nd Target $365–$370 Deeper correction / extended short target
⚠ Note:
These targets are based on my chart’s visual annotations, likely assuming price breaks below the Ichimoku cloud and moves toward lower support levels. This aligns with a bearish setup.
👉 Risk Management Tip:
If entering short, a stop loss just above the resistance zone ($450–$455) may be considered.
If entering long, these same levels can act as profit-taking or add-on zones.
$TSLA | Liquidity Grab or Reversal?⚡️ NASDAQ:TSLA | Liquidity Grab or Reversal?
Tesla’s 1H chart looks fragile.
Price rejected from the premium zone again.
Strong bounce today, but structure still favors the downside unless 450 is reclaimed.
Volume thinning near equilibrium — suggests a potential liquidity sweep before any major trend reversal.
RSI hovering near midline, no clear momentum shift yet.
📉 My bias: Short until November or unless we reclaim 450 cleanly. Watching 402–400 zone for reaction — that’s the next high-probability demand pocket.
🧠 Anything can happen — trade the reaction, not the prediction.
Not Financial Advice
#TSLA #Trading #VolanXDSS #AITrading #WaverVanir
