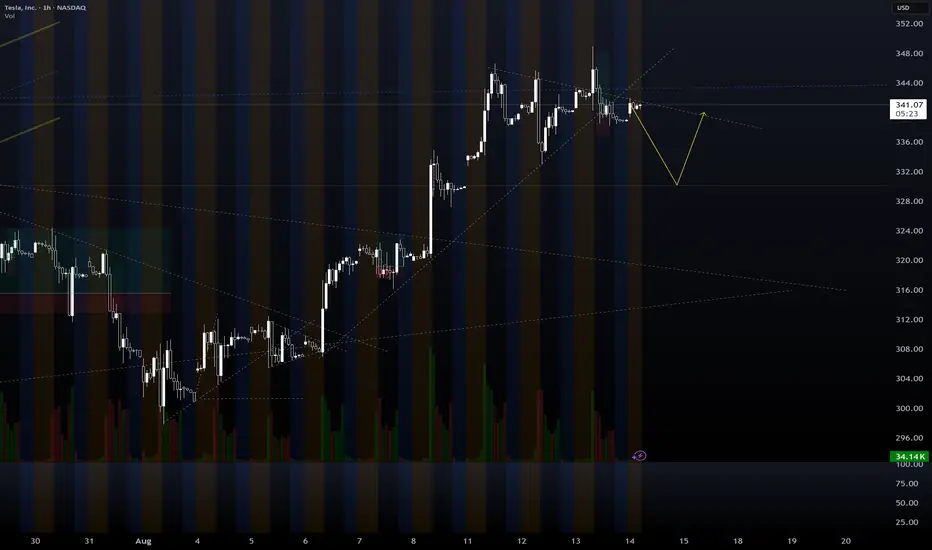
a flag breakout can be a bullish trade ideahere as per technical analysis , we can see several factor which can
aide a bullish take on TESLA stock on a very short term time frame .
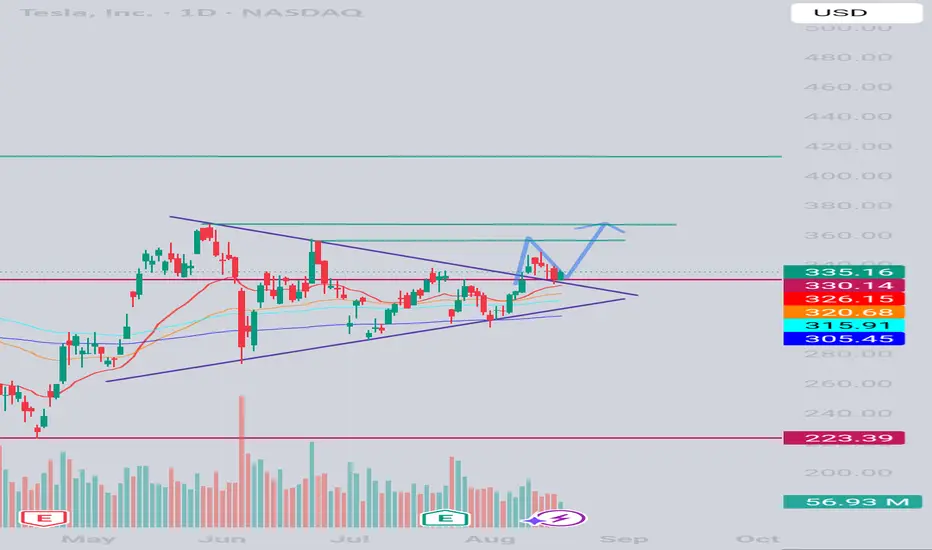
1) pole and flag
2) prices above 20 Day sma ( h)
3) monthly pivot ( traditional ) crossover upside
Pole and flag : a pole and flag which has a decreasing volume during the flag formation , and not having much of retracement , aides the bullish view here
20 DSMA :till the time prices are above the 20 day sma (high) , we can keep our bullish trade intact ,
Pivot level monthly : recently the stock has crossed over monthly pivot level ( traditional ) , in an assuring manner
prices forming a floor above floor structure , where the prices are showing their initial motive towards upside , and then correcting in a slow manner in a retracement manner . a good time has been spent in the shadow of the impulsive motive ( upside ) , which creates a stronger base for the prices and shows no major selling has been happening here , and the profit booked at the higher levels are being bought out again ( re-entry into the market )
break of structure , the lesser candles demand zone which actually created a break of strcuture was respected recently ,
action plan , as soon as the flag pattern is breached on the upside , with a good volume candle , one can have a bullish entry here .
stoploss level at 330 , target price : 15% after the breakout of the flag.
TL0 trade ideas

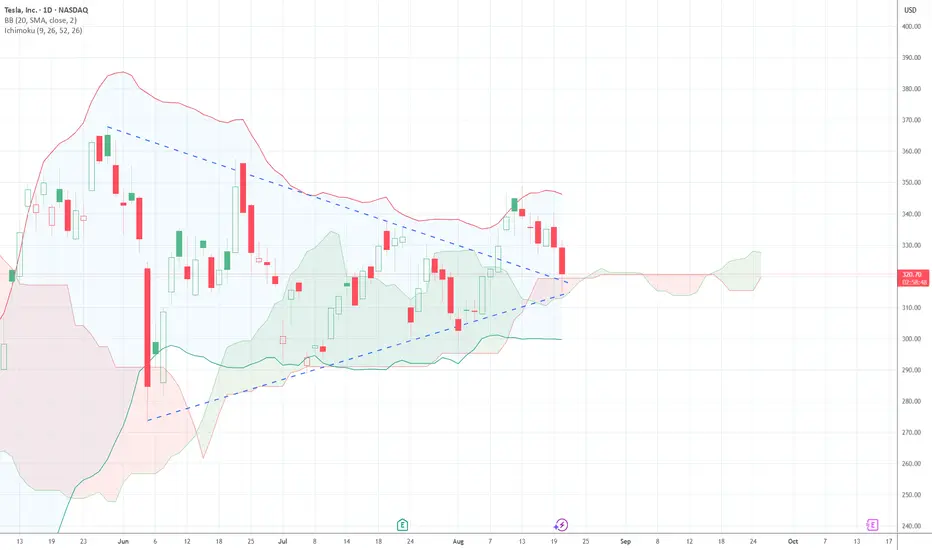
TSLA: WAVE CTSLA has been consolidating within a range since early June and is expected to breakout over the next few weeks. As the markets are due to end a minor wave 4, the final wave 5 should allow TSLA to breakout out to the upside to a potential target of $422.

Heads Will Roll (Tesla Bankruptcy)Imminent bankruptcy in Tesla.
Deep fraud under investigation, shortly to be published.

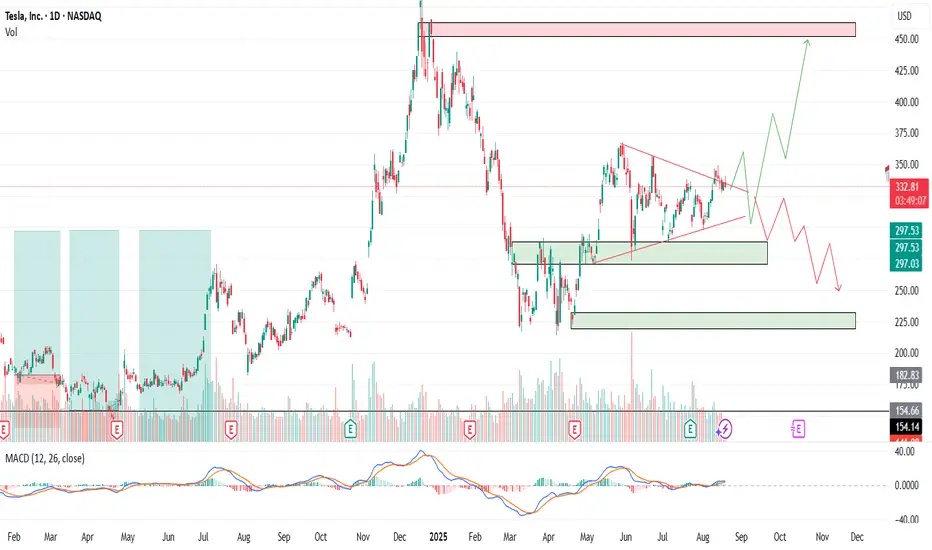
Tesla - NEED MORE TIME! We are a critical ranging market🔎 Weekly View
Tesla has been consolidating between $278 major support and the $337 resistance zone.
Support: Buyers continue to defend the $278–$300 demand region, which aligns with the 50-week EMA.
Resistance: The $337 level has repeatedly rejected price, acting as strong buy-side liquidity.
MACD: Showing weak bullish momentum — histogram fading, suggesting limited buying pressure unless a breakout confirms.
Bias: Neutral → Accumulation Phase until a decisive break occurs.
📉 Daily View
Price action shows a tightening range inside a contracting wedge.
Current Structure: Price tapped the $337 resistance and pulled back toward support ($316–$320).
Key Zone: $316 is acting as local support, but if broken, Tesla could revisit the major demand zone near $278.
Upside Projection: A breakout above $337 could fuel a run toward $380–$420 liquidity.
Bias: Range-Bound short term — watch $316 as immediate pivot.
⏱ 4H Intraday View
Tesla is trading choppy within liquidity sweeps.
Weak Buying Pressure after testing the top of the wedge.
Potential move: Price may dip back into support ($300–$316) before attempting a bullish push.
Breakout Path: A successful hold at support followed by a break of $337 unlocks buy-side liquidity toward $400.
Bias: Patience needed — Wait for either:
Bullish trigger above $337 → target $380/$420.
Breakdown under $300 → target $278 support.

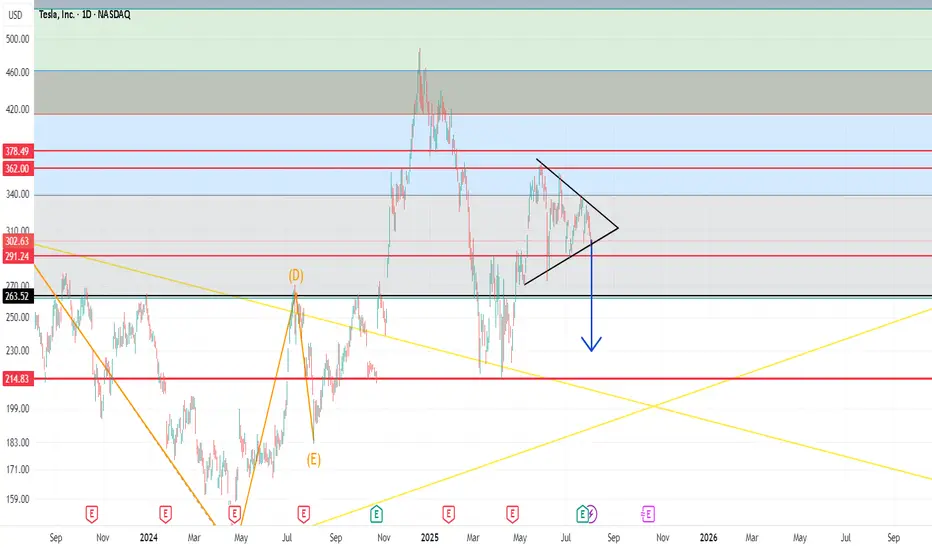
Bearish Triangle: TSLAWaiting for TSLA to breakout 292 to form a bearish triangle pattern.
Target price: 22X
TESLA 20TH AUGUST 2025price action for Tesla is here. I have clearly explained my plan on how to trade tesla considering every factor in market.
NOTE: OPTION WILL BURN YOUR CAPITAL

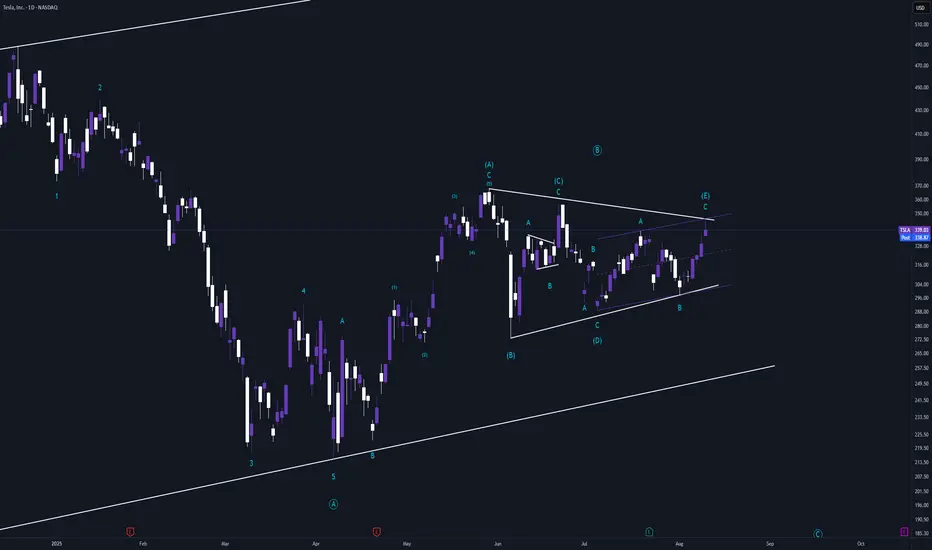
TeslaLooking at the current price action from today, we have a couple of options as to what is going on. The first one I want to discuss aligns with the orange count. This recent move lower could be the b wave of C of (B). If that is the case, then we should be headed higher very soon towards the orange box to finish out the intermediate (B) wave.
If that is not the case, then that would imply that we have started the c of (c) of A of (C). If the white count is correct, I would anticipate it to be strong move as it would be a c wave of multiple different degrees.
Either way, both moves that this could be, IMO, are each c waves of some degree. This implies that the next move should have some strength to it. I continue to favor the orange count, but as mentioned prior, they're both easily possible.

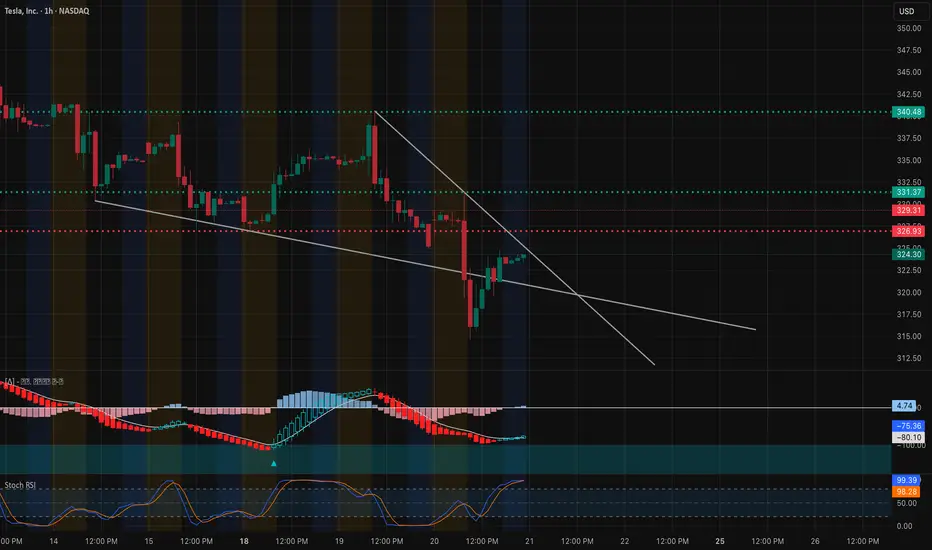
Tesla (TSLA) – Testing Critical Support Zones! Aug 21Technical Analysis (1H Chart)
TSLA is currently trading near $324–325, bouncing after a sharp drop from the $340+ region.
* Trendline & Structure:
Price is still under a descending trendline, which acts as immediate resistance. To shift bullish, TSLA must reclaim $331–332 (prior support turned resistance).
* Support Zone:
Buyers stepped in around $317–320, which is now the short-term demand zone. Losing this could open downside into $312–315.
* Resistance Levels:
First key resistance: $331–332, followed by $340–344 if momentum extends.
* Indicators:
* MACD: Bearish but showing signs of flattening out, suggesting momentum slowdown.
* Stoch RSI: Deeply oversold earlier, now pushing higher → potential for short-term bounce.
Scenarios:
* Bullish: If TSLA breaks above $331–332, momentum could push toward $340–344.
* Bearish: Rejection under $331 likely leads to retests of $320–317, with risk extending to $312–315.
Options Sentiment / GEX (1H)
From the GEX chart:
* Call Walls / Resistance:
* 340–345: Heavy call resistance zone (64%+ concentration) → strong cap unless major momentum shift.
* 348–350: Extreme resistance (GEX9 level).
* Put Walls / Support:
* 325: Highest negative NET GEX (dealer hedging zone), acting as strong support magnet.
* 320 / 317.5: Stacked put walls, critical defense area.
* 315: 2nd major put wall — losing this level could accelerate downside.
GEX Bias:
* Market makers pinned TSLA between 325 support and 340 resistance.
* Upside capped unless 332 is broken; downside risk grows sharply if 317 fails.
Trade Thoughts & Suggestions
* Bullish Setup: Calls only make sense above 332 (target 340–344).
* Bearish Setup: Favor puts if price rejects under 331 or breaks below 320 (target 317, then 315).
* Neutral chop likely if TSLA stalls between 325–331.
Disclaimer: This analysis is for educational purposes only and not financial advice. Trade at your own risk.
Possibilities NASDAQ:TSLA Long tern scenarios, anything is possible.$$350 is key to maintain for push up to $420++
TESLA is going to rise to 420$Based on my analysis, TSLA is going to reach to 420$ from almost 330$.
This is based on the trend that TSLA broke. It broke it upwards, then, retested the price again, and it will soon go up to 360$ after that it will reach 380$ then nothing will stop it until 420$.

TSLA daytrading (fill gap)1. tsla still have a gapp need to fill
2. tsla break down the trend line could pull back a little bit
* in the past tsla is not often fill fill the gap so just watch. dont put down
TSLA 4th Time's a CharmBouncing off the daily cloud, and backtesting the trendline. Looks good for a bounce...
TSLA shortsThis is a very overzealous profit target but the technical aspects are there and over the long term based on the technicals the trade idea is supported. I will look for signatures in price at various levels and determine if I'll hold the trade along the way.

TSLA: Resistance Retest Sets Up Two Clear Paths
Tesla (TSLA) is displaying strong bullish market structure with clear higher highs and higher lows on the 4-hour timeframe.
**Key Technical Observations:**
📈 **Trend Structure**: Higher highs and higher lows confirm the uptrend is intact.
💪 **Key Support Level**: Proven buyers established at $308.20.
🔄 **Resistance Break & Retest**: TSLA has broken through resistance and is now retesting it from above - a classic bullish signal.
**Potential Scenarios:**
1️⃣ **Retrace to Support**: The logical next step is to retrace to the proven buyers at $308.20 (bearish target at $308.30) before another leg higher. This would offer a lower-risk entry point.
2️⃣ **Direct Move Higher**: We could also just head up to $343.50 from here, either to break up higher or just retest the resistance there.
**Trading Approach:**
Currently retesting broken resistance. Be prepared for either scenario - a retrace to $308.30 or continuation to $343.50. Both paths remain valid within the current bullish structure.
*Not financial advice. Always do your own research and manage risk appropriately.*
TSLA (Tesla) LONG SET UPEntry Price 1: $324.00
Entry Price 2: $314.00
Stop Loss: $294.00
Take Profit 1: $340.00 (Close 25%)
Take Profit 2: $354.00 (Close 50%)
Take Profit 3: $368.00 (Close 75%)
Take Profit 4: $384.00 (Close 100%)

Tesla (TSLA) – Bearish Rejection at Key Resistance On the 4H chart, Tesla stock showed a sharp bullish rally but faced strong rejection around the $340 – $355 resistance zone.
A short position has been taken here with a target around $300, while the stop loss is placed above the recent high at $353.
🔹 Key points:
Short-term bullish trendline has been broken
Strong resistance zone confirmed
Attractive risk-to-reward ratio

TSLA Potential Triangle FinishSeeing a lot of pots around the TSLA breakout. The rejection off the top of the ABC channel starting in July makes me think that this triangle is in play and TSLA will begin heading back down from here. Invalidation above 357.
TSLA – Buy the Fear or Wait for the Setup?Tesla (TSLA) is once again in the spotlight. Between robo-taxi hype, new product launches, and ongoing political noise around Elon Musk, the stock has become one of the hottest trading stories on the market. But as always the chart tells us where to act.
Entry Levels
$330 – First line of defense, early buyers may step in here
$295 – Stronger support, better reward-to-risk zone
$255 – Deep pullback level, only triggered on market weakness
🎯 Profit Targets
TP1: ~$345 → ~5% move from $330 entry
TP2: ~$370–$380 → 12–15% move depending on entry
TP3: ~$400–$420 → 18–20% move on a sustained breakout
Tesla remains a trader’s stock: volatile, narrative-driven, and technically reactive. If it holds the $330 zone, momentum traders could see a quick bounce. If we dip to $295 or even $255, that could be the bigger opportunity for those with patience.
No one knows which path the market chooses, but the plan is set. Trade the structure, not the noise.
⚠️ Disclaimer: This is not financial advice. I’m sharing my personal analysis and trade levels. Always do your own research and manage risk responsibly.
Price returns to solid minor structure for a retest = BUY1. downtrend , fast and mixed with areas of high volitility
2. the buyers find price to be 'cheap' here and begin the move
up
3. this is an important moment, we defeat the strength of the sellers
from one and mark 2 as the most powerful entity on this chart-view
4. after defeating the sellers from one, we replaced the selling orders
with buying orders, sellers coming here are catipulted up to create a new
high 5
4. number 4 is now a solid low with it being proven to
a. be stronger than sellers who came in after the defeat of selling
point 1
b. have a strong cluster of volume, resistance turned support
c. we have a retest of the support and a bullish reaction
* what do I think will happen
* well, it looks like a case of switch and retest, with the former resistance
becoming support, a stop loss below the solid minor structure 4 ( 2 is the solid
major structure as 4 is part of the fractally smaller trend )
* MFI+ RSI + Accum/Dist indicator signal a divergence which is telling us to go to the downside, BUT , we also have the opposing divergence signal as well, so this nullifies the divergence signals and does not make me hesistate in the confidence of the analysis
* the highs and lows still follow the principle of supply and demand or exersion and exhustion, so we
can draw a horizontal line on mfi and rsi lows and see , from a significant low we also have a touch on the current price action
* overall this all concludes to me that a buy trade is in order and appropriate given the current information.
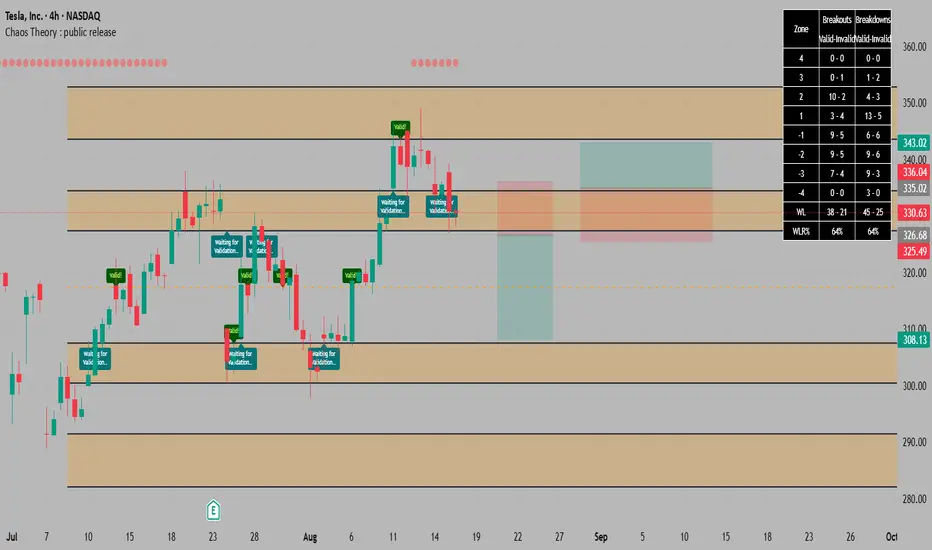
* we happen to have a 72% vs a 64 % , favouring the breakouts, if a candle closes, to follow through to the end of the zone , this gives us good confidence to have the target 2 zones up, with a breakeven point once price surpasses the first zone, due to the fact if it come back under, we have a 64% chance it'll come back to the genesis of our trade. you can reduce the lookback period and confirm the stats table for yourself, we only
count follow throughs which are possible in real time.

What Is an Iceberg Order, and How May It Be Used in Trading?What Is an Iceberg Order, and How May It Be Used in Trading?
An iceberg order is a type of execution strategy that hides the full size of a trade by revealing only small portions at a time. Used by institutions and large traders, it helps reduce market impact. Understanding how iceberg orders work, where they’re used, and their risks can help traders more accurately analyse market activity. This article breaks down everything you need to know about iceberg orders and their role in trading.
What Is an Iceberg Order?
An iceberg order is a type of order designed to execute large trades without revealing the full size to the market. Instead of placing one massive position that could disrupt prices, traders split it into smaller portions, with the rest hidden. As each portion gets filled, the next one is placed automatically until the full order is executed.
The key feature of this type of entry is that only a fraction—known as the display quantity—is visible in the order book at any given time. The rest remains hidden until it’s gradually revealed. This prevents other traders from immediately recognising the true size of the position, which helps avoid unnecessary market movements.
For example, if a trader wants to buy 50,000 shares of a stock, placing the full position in the market at once could cause prices to rise before execution is complete. Instead, they might set an iceberg order with a display size of 5,000 shares. Once the first 5,000 are bought, another 5,000 are automatically placed, repeating until the full 50,000 are executed.
They’re particularly useful for institutional traders, hedge funds, and high-net-worth individuals who want to build or reduce positions without attracting attention. However, some retail traders also use them when executing relatively large trades in markets that support this execution type. Many major exchanges, including those for equities, forex, and futures, allow icebergs, but their availability depends on the broker and trading platform being used.
How Iceberg Orders Work
The main idea of iceberg orders is clear but let’s consider how they work in detail.
Order Execution Process
When a trader places an iceberg order, they specify two key parameters:
Total size – The full amount they want to buy or sell.
Display size – The portion that will be visible at any given time.
For example, if a trader wants to buy 20,000 shares but only wants 500 to be visible at a time, the order book will show just 500 shares. Once those are bought, another 500 will appear at the same price (if still available), and the cycle continues until the entire 20,000 shares are filled.
Dynamic Execution
Some trading platforms and institutional brokers use smart order execution algorithms to optimise how these orders are placed. These algorithms might adjust the display size dynamically based on market conditions, ensuring the order gets executed efficiently without drawing too much attention.
Hidden Portions and Order Book Activity
Although most of the order remains hidden, experienced traders and high-frequency algorithms can sometimes detect iceberg levels. If they notice an order constantly refreshing at the same price level without an obvious large sell or buy position, they may infer that an iceberg is in play.
Where Iceberg Orders Are Most Popular
They are most popular in liquid markets where frequent trading activity allows the hidden portions to be executed smoothly. In less liquid markets, there’s a higher risk that the order will be only partially filled or take longer to execute, making alternative execution strategies more practical.
Why Traders Use Iceberg Orders
Iceberg orders help traders hide their full intentions from the market. Here’s why they’re commonly used:
Reducing Market Impact
When a large position enters the market, it can shift prices before the full trade is completed. This is particularly an issue in less liquid markets, where even moderate positions can cause price swings. By splitting a large trade into smaller, hidden chunks, iceberg orders prevent sudden moves that could work against the trader.
Avoiding Slippage
Slippage occurs when an order is executed at a worse price than expected due to market movement. Large trades placed all at once can exhaust available liquidity at the best price levels, forcing later portions to be filled at less favourable prices. Iceberg orders help mitigate this by allowing the trade to be executed gradually without consuming too much liquidity at once.
Maintaining Discretion
Institutions and high-net-worth traders often prefer to keep their trading activity under the radar. If other market participants see a massive buy or sell entry, they may react by adjusting their own strategies, making it harder for the original trader to get a good price. Icebergs keep most of the position hidden, preventing this from happening.
Reducing the Risk of Front-Running
High-frequency trading firms and aggressive traders actively monitor the order book for large transactions. When they spot them, they may enter positions ahead of the large trade, pushing prices in an unfavourable direction. By keeping most of the trade hidden, iceberg entries make it harder for others to exploit this information.
Identifying Iceberg Orders in the Market
Iceberg orders are designed to be discreet, but experienced traders and algorithmic systems can sometimes detect them by analysing order book activity and price movements. Since only a small portion of the total order is visible at any given time, certain patterns can reveal the presence of an iceberg in action.
Order Book Clues
One of the most obvious signs is a persistent order at the same price level. If a bid or ask keeps refreshing with the same quantity after being partially filled, it may indicate that a much larger hidden position is sitting at an iceberg level. This is particularly noticeable in less liquid markets where large trades are more disruptive.
Another telltale sign is a large trade volume without corresponding large visible orders. If significant buying or selling occurs but the order book only displays small entries, there’s a chance that a hidden order is gradually being executed.
Time and Sales Analysis
Traders can also look at time and sales data, which records every transaction. If the same price level repeatedly absorbs multiple trades without depleting, it suggests a hidden order replenishing itself after each execution.
Algorithmic Detection
Some trading algorithms are specifically designed to identify icebergs. These tools scan for patterns in order execution and attempt to infer hidden liquidity. While not always accurate, they can give traders an idea of when institutional activity is taking place.
Risks and Limitations of Iceberg Orders
While iceberg orders can help traders execute large trades discreetly, they are not without drawbacks. Market conditions, execution risks, and the rise of advanced trading algorithms can all impact their effectiveness.
- Incomplete Execution: If market conditions change or liquidity dries up, part of the position may remain unfilled. This is especially problematic in volatile or low-volume markets where price movements can accelerate unexpectedly.
- Detection by Algorithms: Sophisticated trading algorithms actively scan for hidden orders. High-frequency traders (HFTs) may detect it and adjust their strategies, making it harder to execute at a favourable price.
- Increased Trading Costs: Splitting a large entry into multiple smaller ones can lead to higher transaction costs. Exchanges and brokers may charge fees per executed trade, meaning an iceberg entry could end up costing more than a single bulk position.
- Slower Execution in Fast Markets: When markets move quickly, the visible portions of an iceberg might not fill fast enough before the price changes. This can lead to slippage, where later parts of the order get executed at worse prices than intended.
- Limited Availability: Not all brokers or exchanges support icebergs, particularly in smaller or less liquid markets. Some platforms also impose minimum position size requirements, restricting their use for smaller traders.
The Bottom Line
Iceberg orders enable traders to execute large trades discreetly, minimising market impact and enhancing execution quality. While they offer advantages in managing liquidity, they also carry risks such as detection by advanced algorithms and potential slippage. Traders should exercise caution and conduct thorough market analysis.
FAQ
What Is an Iceberg Order?
An iceberg order is a type of order that splits a large trade into smaller visible portions, with the remaining size hidden from the order book. As each visible portion is filled, the next one is automatically placed until the full order is executed. This helps traders avoid moving the market or revealing their full position size.
How Do You Identify an Iceberg Order?
Traders can spot icebergs by looking for repeated small trades at the same price level. If an order keeps refreshing after partial fills without a visible large order in the book, it may indicate hidden liquidity. Time and sales data, as well as algorithmic tools, can help detect these patterns.
What Is the Difference Between an Iceberg Order and a Basket Order?
An iceberg order breaks a single large entry into smaller, hidden parts, while a basket order consists of multiple different trades executed together, often across various assets or instruments. Basket orders are used for portfolio adjustments, whereas iceberg entries focus on reducing market impact.
What Is an Iceberg Order in Crypto*?
In crypto* markets, iceberg entries function the same way as in traditional markets—hiding large trades to prevent price fluctuations. Many exchanges offer this feature, particularly for institutional traders handling large positions.
How Do I Place an Iceberg Order?
Availability depends on the broker or exchange. Traders typically set the total position size and the visible portion, allowing the system to execute the trade in smaller segments.
What Is the Iceberg Order Strategy?
The strategy involves using iceberg orders to accumulate or distribute large positions without drawing attention. It helps reduce slippage, maintain discretion, and avoid triggering unnecessary price movement.
*Important: At FXOpen UK, Cryptocurrency trading via CFDs is only available to our Professional clients. They are not available for trading by Retail clients. To find out more information about how this may affect you, please get in touch with our team.
This article represents the opinion of the Companies operating under the FXOpen brand only. It is not to be construed as an offer, solicitation, or recommendation with respect to products and services provided by the Companies operating under the FXOpen brand, nor is it to be considered financial advice.

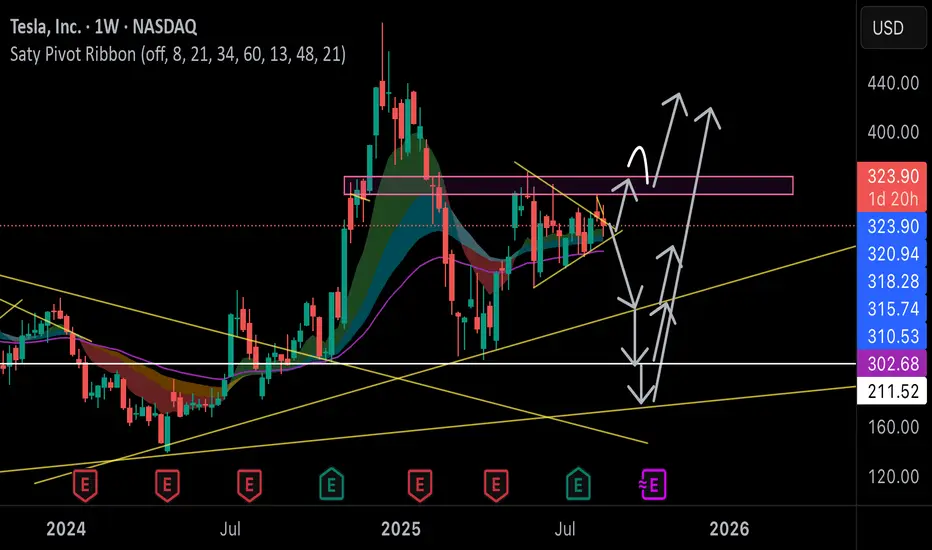
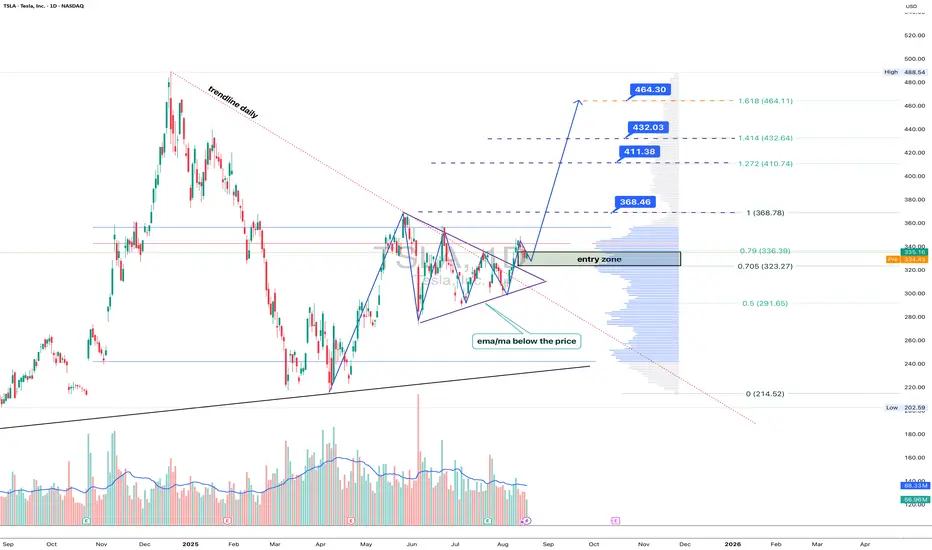
Tesla: breakout mode, Elon’s rocket fuel for the chartTechnically , Tesla broke out of a symmetrical triangle while holding above EMA/MA supports, which confirms bullish control. The breakout unlocks targets at 368.46 (Fibo 1), followed by 411.38, 432.03, and the 1.618 extension at 464.30. Volume profile confirms strong accumulation below, leaving the upside path less crowded.
Fundamentally , Tesla keeps investor attention alive. EV sales stabilized, but the focus has shifted to AI and robotaxi — Musk’s latest promises of disruption. With Fed rates peaking and yields easing, growth stocks regain momentum. Risks remain from Chinese competitors, yet Tesla’s margins are still leading the industry.
Tactical plan : entry zone stands at 323–336. As long as price holds above it, buyers target 368.46 → 411.38 → 464.30. A break below 323 would flip the bias back toward 291.
Bottom line: Tesla’s chart looks ready for lift-off. Musk might be dreaming of Mars, but for now, bulls are happy if he just launches the stock a few hundred dollars higher.
Tesla, Inc. $TSLA ~ Very Concerning (Not much left)...Tesla, Inc. engages in the design, development, manufacture, and sale of electric vehicles and energy generation and storage systems. It operates through the Automotive and Energy Generation and Storage segments. The Automotive segment includes the design, development, manufacture, sale, and lease of electric vehicles as well as sales of automotive regulatory credits. The Energy Generation and Storage segment is involved in the design, manufacture, installation, sale, and lease of solar energy generation, energy storage products, and related services and sales of solar energy systems incentives. The company was founded by Jeffrey B. Straubel, Elon Reeve Musk, Martin Eberhard, and Marc Tarpenning on July 1, 2003 and is headquartered in Austin, TX.
Is it time to hop on the Elon's Robovan and ride the waveNASDAQ:TSLA 's chart has been forming this triangle since mid May, and has finally made up it's mind to head north. On the daily chart you can see the breakout on top and retest of support. Tomorrow I'll be entering swings with 8/22 & 8/29 $350 calls with a PT at 356 for the 8/22 contracts & PT 365 for the 8/29 contract.