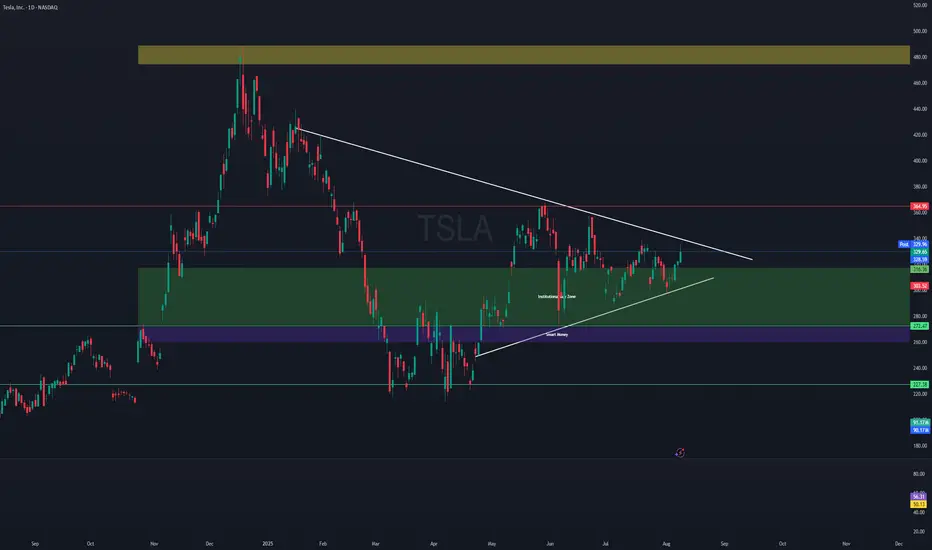
Telsa! Fake out or Buy now?We have been showing we are consolidating for a while now and we are very close to a break out and although we all want to buy into this stock, is it the right time?
Well looking at this chart there is a chance we get a Bearish Breakout towards the lower Support and facing lower Demand zones showing were there is a higher demand of Buyers.
Saying that there is every possibility that we could buy this Breakout now and get the positive response we are all hoping for. Tonight market open shall give us a strong sentiment of what the close future of Tesla is holding for us all
Good luck to any traders that follow this chart pattern
TL0 trade ideas

Tesla's Consolidation Suggests Breakout Potential—Act Current Price: $329.65
Direction: LONG
Targets:
- T1 = $336.50
- T2 = $343.00
Stop Levels:
- S1 = $326.00
- S2 = $322.00
**Wisdom of Professional Traders:**
This analysis synthesizes insights from thousands of professional traders and market experts, leveraging collective intelligence to identify high-probability trade setups. The wisdom of crowds principle suggests that aggregated market perspectives from experienced professionals often outperform individual forecasts, reducing cognitive biases and highlighting consensus opportunities in Tesla.
**Key Insights:**
Tesla is currently in a crucial consolidation phase, reflected through a wedge pattern that indicates mounting pressure for a directional breakout. The company continues to impress investors with innovations such as its progression toward robo-taxi certification and mobility expansion via its Texas ride-share license. These developments, coupled with its robust growth narrative, make Tesla an attractive asset. However, technical indicators suggest that traders should monitor key resistance and support levels to capture the market's next move effectively.
Furthermore, the stock is positioned in a high-volatility zone, where its MACD crossover and RSI steadying near 50 emphasize the possibility of a bullish breakout. Analysts suggest that a breach above $335 could unlock upside momentum, while a failure to hold $326 might trigger temporary pullbacks.
**Recent Performance:**
Tesla has displayed strength despite broader market volatility, posting a 2.2% gain over the last week as the tech sector corrected from recent highs. The stock has stayed within the $325–$335 range, consolidating gains from earlier upward movements. This stability contrasts with the momentum seen in other tech giants, suggesting Tesla might be gearing up for its next leg higher. Institutional investors appear to be eyeing this stock as a value play within the stretched valuation landscape of mega-cap peers.
**Expert Analysis:**
Experts view Tesla's consolidation as a bullish wedge, where lows are climbing and highs are becoming narrower. This formation often precedes breakout events, and the setup aligns with Tesla's steady operational performance. Sales growth in key Asian markets has remained strong, countering lukewarm European results. With external catalysts such as macroeconomic data and Fed decisions percolating in the background, Tesla's rebound potential could align seamlessly with improving overall market sentiment.
The $335–$345 range is identified as a breakout area; sustained movement above this level could shift into higher gear. Sentiment, which has recently flipped neutral-positive, supports a move to retest $343 in the near term.
**News Impact:**
Tesla's innovation spree and operational wins, such as advancements in its autonomous driving technology, along with receiving new mobility certifications in Texas, provide bullish tailwinds.However, mixed international sales add a hint of caution to the growth story. Still, its position as a leading innovator in the renewable energy and EV space ensures consistent market attention.
**Trading Recommendation:**
Tesla's consolidation presents a compelling risk-reward scenario. A long trade is recommended with entry near $329.65, targeting $336.50 and $343.00. Stops should be placed at $326.00 and $322.00 to mitigate downside risks. This strategy aligns with technical setups and the company's overall growth narrative. As sentiment improves and fundamentals align, Tesla could be poised for its next major move upward. Timing a breakout entry is crucial, so traders should remain vigilant for confirmation signals this week.

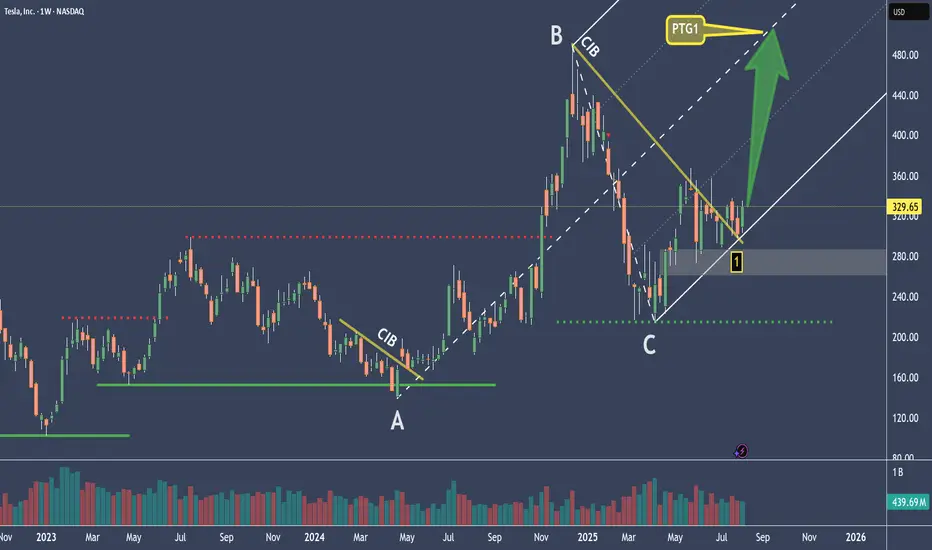
TESLA Is Counting Down The Clock – Moonshot?The red and green lines nicely illustrate what true support and resistance look like.
At the moment, it appears that the market has formed support again (1), but we can’t really confirm this since we don’t have a higher high that has been broken. So we can only assume that the base is at the C point.
We’ve been trading within the fork for several months now, which suggests that we’re once again in a longer-term upward movement.
If that’s the case, then we look for a nice profit target (PTG1) at the CL, because we know there’s over an 80% chance of reaching it.
An open and close outside the fork would be an exit signal, and could indicate a possible reversal to a short position.
I’ll explain further details in the YT video.
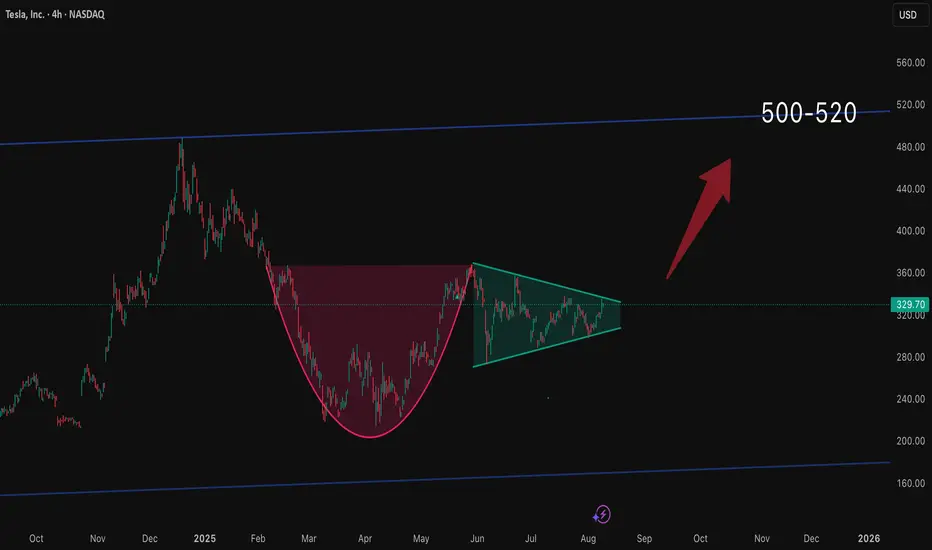
$TSLA Bullish WedgeWeekly Chart Consolidation Pattern: TSLA has formed a clear triangle consolidation pattern after the significant pullback from its 2025 highs around $440. Price is currently testing the upper boundary of this triangle at $329.65, suggesting potential for a breakout.
Key Support Levels Holding: The stock has established strong support at $273.38, which has been tested multiple times and held firmly. This creates a solid foundation for a bullish move.
Momentum Shift: TSLA recently breaking above its descending trendline resistance, indicating a shift in short-term momentum from bearish to bullish.
Higher Lows: On both daily and weekly charts, TSLA has been forming higher lows since April 2025, suggesting accumulation and strengthening bullish sentiment.
Fundamental Catalysts
Several fundamental factors support a bullish outlook:
Robotaxi Progress: Recent news confirms TSLA received a Texas Robotaxi permit (August 9th), allowing it to launch a ride-hailing service with safety drivers, competing directly with Uber and Lyft in the autonomous vehicle space.
Q2 Earnings Beat: The July 23rd earnings report showed TSLA beating expectations with EPS of $0.40 (14.29% above estimates) and revenue of $22.5B (slightly above estimates), demonstrating the company's resilience despite challenging market conditions.
Production Plans on Track: During the earnings call, Tesla confirmed "plans for new vehicles that will launch in 2025 remain on track, including initial production of a more affordable model in 1H25." This addresses a key market concern about Tesla's product roadmap.
Strong Analyst Support: Despite mixed ratings, several prominent analysts remain highly bullish, with Wedbush maintaining a $500 price target (approximately 52% upside from current levels). RBC Capital also raised their price target from $319 to $325 recently.
AI and Technology Leadership
TSLA's AI initiatives offer significant upside potential:
FSD Progress: Elon Musk stated during the earnings call that "unsupervised FSD likely to be available for personal use by end of year," which could be a major competitive advantage.
Samsung Partnership: The company secured a $16.5 billion chip deal with Samsung for next-gen AI chips, positioning Tesla for continued leadership in autonomous driving technology.
Supply Chain Resilience: Tesla is "localizing supply chains to mitigate geopolitical risk," making it the only automaker sourcing batteries at scale through non-Chinese routes, according to Piper Sandler.
Price Action and Potential Targets
The recent price action suggests TSLA is preparing for a potential upward move:
Immediate Resistance: The $340.24 level shown on your chart represents the first significant resistance. A decisive break above this level could trigger a run toward the $400 psychological level.
Intermediate Target: If momentum continues, the next target would be a retest of the 2025 high near $440.
Current Price Action: The stock has recently crossed above the descending trendline that had been in place since January 2025, which is typically a bullish signal.
Risks to Monitor
While maintaining a bullish bias, it's important to acknowledge potential risks:
AI Team Changes: Recent news indicates Tesla scrapped its Dojo Supercomputer AI team, which could impact some AI development initiatives.
Competition: Chinese EV makers and traditional automakers are intensifying efforts in both EV and autonomous driving spaces.
Technical Support: The $275-280 zone remains critical - a break below could invalidate the bullish thesis.
In conclusion, TSLA's technical setup across multiple timeframes, combined with positive fundamental developments in robotaxi, AI initiatives, and upcoming product launches, creates a compelling bullish case for the stock in the near to medium term. The stock appears positioned for a potential upside move as it tests key technical resistance levels with strong support established below current prices.

TESLA BACK TO $400+?NASDAQ:TSLA is starting to look good once again, here's what's likely around the corner!

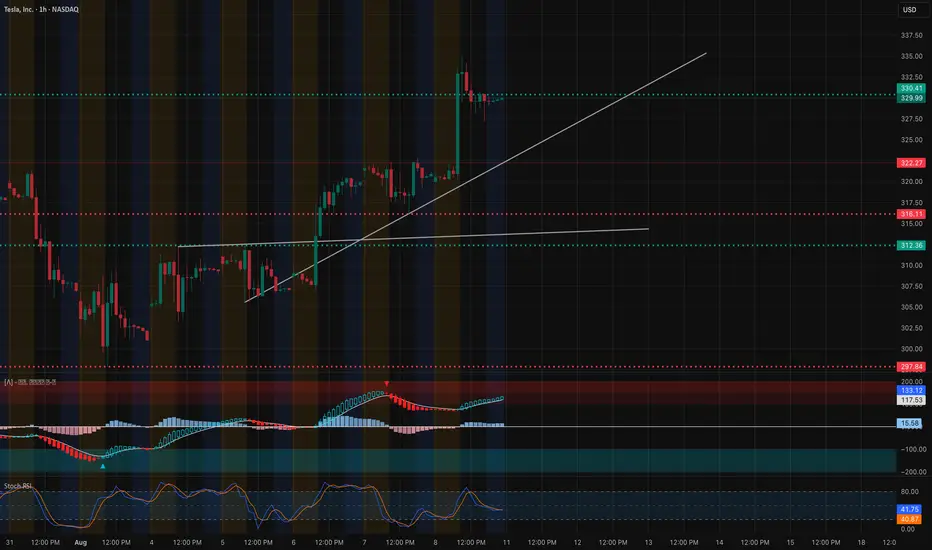
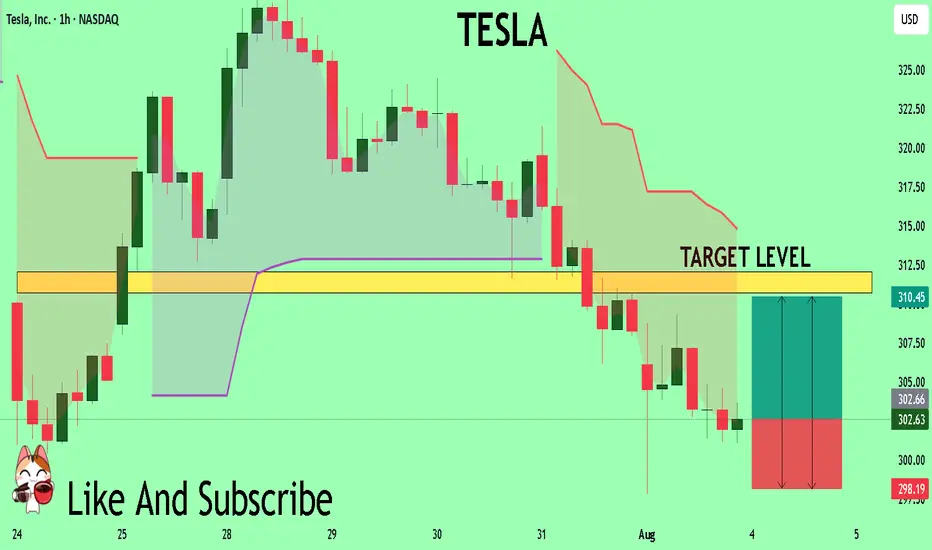
TSLA — Holding Momentum at Critical Levels. Aug. 11TSLA — Holding Momentum at Critical Levels: Can Bulls Push Through? 🚀
Technical Analysis (1H Chart)
TSLA has maintained a steady uptrend, respecting the rising trendline support from early August. The recent breakout above 325 pushed price into the 330–335 resistance zone, which aligns with a prior supply level and the high from earlier this month. Momentum indicators are still favoring bulls — MACD histogram remains positive and Stoch RSI is curling up from mid-range, hinting at potential continuation if price sustains above 330.41.
Immediate support is at 325 trendline confluence; a breakdown here could lead to a retest of 322.27 and deeper support at 316.11. Holding above 330 keeps the bullish bias intact with room toward 337–340 as the next technical target.
GEX / Options Sentiment
* Key Resistance (Calls / Gamma Walls):
* 335.00 → Highest positive NetGEX & major call wall resistance.
* 345.00 → GEX7 (47.48%), secondary upside barrier.
* 370.00 → GEX10 extreme bullish zone, unlikely without strong catalyst.
* Support (Puts / HVL Zones):
* 321.28 → HVL & strong support cluster.
* 310.00 → First PUT wall; loss here would open downside toward 300.
* 300.00 → Major PUT support (-16.97%), key bear target if breakdown occurs.
* Sentiment: Calls outweigh puts at 48.8%, IVR is low at 4.7 (cheap options), suggesting directional plays could be favored over premium selling.
Trade Thoughts:
* Bullish Scenario: Hold above 330.41 → Targets 335 then 345. Use 325 trendline as stop guide.
* Bearish Scenario: Break below 325 trendline → Targets 322.27 and 316.11, with possible extension toward 310.
* Options Angle: Low IVR supports debit strategies (buying calls/verticals) for bullish bias. Put spreads may work if breakdown starts below 325 with momentum confirmation.
Disclaimer: This analysis is for educational purposes only and does not constitute financial advice. Always do your own research and manage risk accordingly.
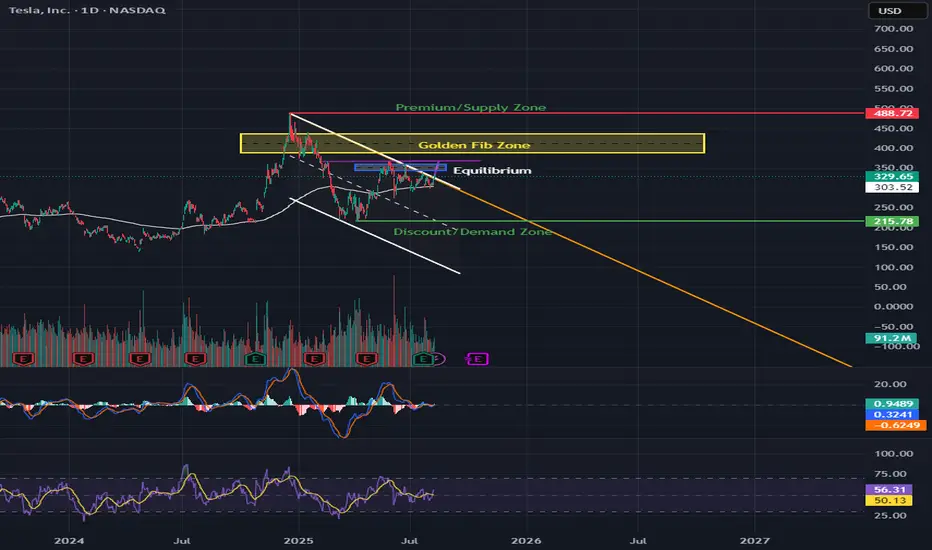
TSLA Golden Zone Test: Cup & Handle Breakout Ahead?📊 Market Breakdown
TSLA is trading at $329.65 and is caught between major zones — the Golden Fib Zone ($365–$385) above and the Equilibrium ($294) below.
Trend: Price recently broke out of a descending trendline but is still inside a bigger channel.
Pattern Watch: There’s a potential cup & handle forming. If confirmed, this could be the fuel that launches us toward the $365–$385 resistance area.
Momentum: MACD is flattening near zero (possible bullish crossover brewing), and RSI at 56 gives us room to push higher before overbought territory.
🛒 CALLS (Bullish Scenario)
Buy Zones:
🎯 Aggressive Entry: Bounce from $320–$325 support
✅ Confirmation Entry: Daily close above $340 with strong volume
Take Profits:
1️⃣ $365 – First target at the start of Golden Fib Zone
2️⃣ $385 – Fib Zone top and key resistance
3️⃣ $488 – Long-term premium/supply zone
Stop-Loss: $315 (just below recent support)
Why This Works: A breakout above $340 also breaks the handle of the cup, unlocking room to run toward $365+.
🛑 PUTS (Bearish Scenario)
Sell Zones:
🚨 Rejects $340 resistance with heavy selling
📉 Breakdown and daily close under $315
Take Profits:
1️⃣ $294 – Equilibrium
2️⃣ $250 – Key psychological level
3️⃣ $215–$220 – Discount/Demand Zone
Stop-Loss: $330 (above rejection point)
Why This Works: A failed breakout with a close under $315 breaks short-term bullish structure, opening the door for a drop back toward $294 equilibrium.
🔍 Technical Highlights
Cup & Handle Potential: Neckline around $340; break = bullish continuation.
EMA 200 ($219.82): Still far below, showing this is more of a swing/mid-term momentum play.
Volume: Recent spikes suggest institutions are active at these levels.
Macro Watch: TSLA moves with tech sentiment; keep an eye on NASDAQ trend.
⏳ Option Expiration Strategy:
1 Week: For quick bounce or rejection plays at $340
2 Weeks: Breakout targeting $365
3 Weeks: Full push toward $385–$488 supply zone
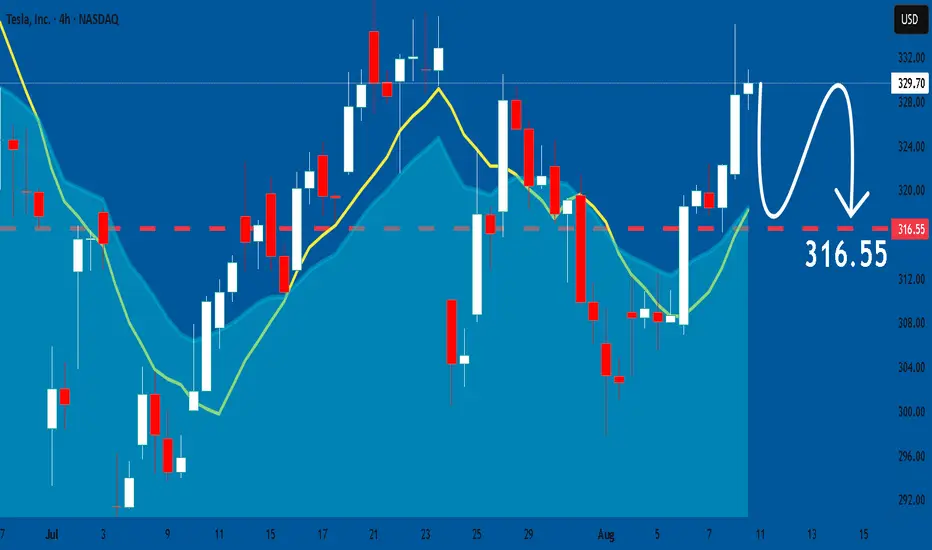
TESLA What Next? SELL!
My dear friends,
My technical analysis for TESLA is below:
The market is trading on 329.70 pivot level.
Bias - Bearish
Technical Indicators: Both Super Trend & Pivot HL indicate a highly probable Bearish continuation.
Target - 319.77
Recommended Stop Loss - 335.01
About Used Indicators:
A pivot point is a technical analysis indicator, or calculations, used to determine the overall trend of the market over different time frames.
Disclosure: I am part of Trade Nation's Influencer program and receive a monthly fee for using their TradingView charts in my analysis.
———————————
WISH YOU ALL LUCK

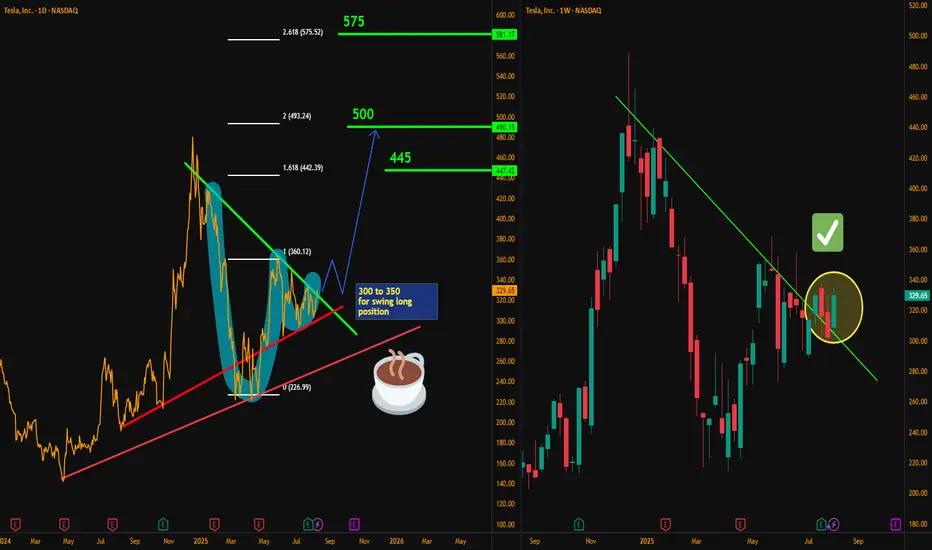
Tesla Roadmap: From $300 Zone to $575Hello traders, here’s my latest analysis on Tesla (TSLA) based on the weekly and daily timeframes. On the weekly chart, I have drawn a downtrend line starting from December 2024, and the recent price action shows a breakout above this line on a weekly close. This breakout is a promising sign that an uptrend may be developing in the medium term.
On the daily chart, we can see a cup & handle pattern forming, which is a bullish continuation structure. However, the daily downtrend drawn from the December 2024 highs remains unbroken, so I will need to see a weekly close above the $332 resistance level to confirm a swing long setup.
My preferred positioning zone for longs is between $300 and $350, using a multi-entry approach to average into the trade. My upside targets are $366, $445, $500, and finally $575. These levels align with inverse Fibonacci projections, with “safety 1” at $360 and “0” at $227, pointing toward the 161, 200, and 261 extensions as key objectives.
For stop-loss placement, patient traders who are willing to hold through volatility may consider a weekly close below $265 as their invalidation point. For faster or more short-term oriented traders, a weekly close below $300 could be used as a tighter stop level. Although I believe it is unlikely for price to drop this far, even if it does, I expect strong buying interest and a potential rebound from the $265 support zone.
Risk management remains crucial for this setup. I recommend not risking more than 10% of your capital, scaling in over multiple entries, and always confirming with your own strategy before committing to the trade. Position sizing and discipline will be key to managing volatility and protecting capital.
NASDAQ:TSLA
$TSLA 3rd Time's a CharmI bottom called NASDAQ:TSLA twice in a row. About to do it a third time today. 312.5C 8/8 @ 4.47 were just bought for $1.3 million.
Is the wait over?Time to rise and shine off the couch? Cup and handle will hopefully be complete soon.
Preferably want to see the price above 370 for it to be valid.
But already at 340 it’s a mini buy signal.
We’ll see what the future brings us.
☀️🫶
TESLA: Expecting Bearish Movement! Here is Why:
Balance of buyers and sellers on the TESLA pair, that is best felt when all the timeframes are analyzed properly is shifting in favor of the sellers, therefore is it only natural that we go short on the pair.
Disclosure: I am part of Trade Nation's Influencer program and receive a monthly fee for using their TradingView charts in my analysis.
❤️ Please, support our work with like & comment! ❤️
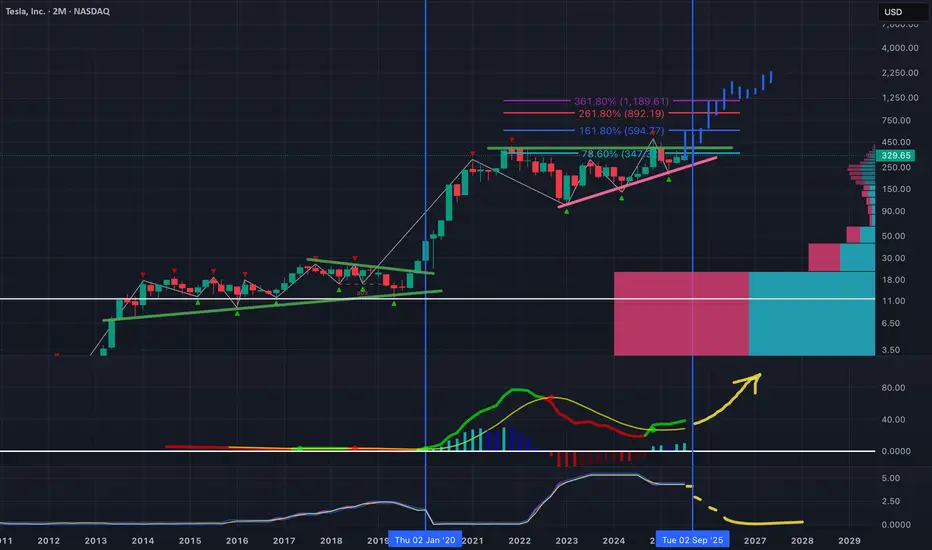
$TSLA - High CAGR Strikes againTesla’s long-term bullish structure remains intact on the 2-month logarithmic chart, with price breaking out of a two-year ascending triangle capped near $350. This move tests the 78.6% retracement level at $347, opening the door to Fibonacci extension targets at approximately $595, $892, and $1,189 if momentum follows through.
The volume profile highlights strong historical support in the $180–$250 range, a key zone to defend on any pullback. Notably, the macro backdrop adds a tailwind — the last significant Fed rate cut in early 2020 coincided with Tesla’s parabolic advance, and the next major cut is projected for late 2025.
Long-term momentum indicators are turning higher, suggesting the early phase of a new bullish cycle. A sustained hold above $300 on any retest would reinforce the breakout, while a drop back under $280 risks a move toward $200–$220.
I wouldn't want to be short long term.
TSLA is looking ready for breakout NASDAQ:TSLA is making higher lows, looks like getting ready to be a rocket. keep an eye on 340 break and retest.
TESLA ABC Trap ZoneTesla’s price action has been exhibiting a period of consolidation characterized by lateral movement, forming a pattern commonly identified as a triangular structure. Triangular formations, by their nature, have the potential to break out in either direction—upward or downward—depending on market dynamics. However, my focus is particularly on recognizing this pattern within the context of an Elliot Wave ABC corrective structure.
Specifically, the second wave in this sequence appears to manifest as a triangle, suggesting a phase of market indecision and consolidation. This phase is typically followed by a final impulsive move downward, which would serve to complete the overall corrective pattern. Understanding this sequence is critical, as it provides insight into the potential continuation or reversal of Tesla’s price trend after the correction concludes.

TESAL HEADING TO $500+ RANGE ANALYSIS HERE Afternoon Trading Fam
So here is our in-depth look at Tesla: Currently the monthly trend is bullish giving us levels of $500 and above.
Locally though we can break this $338 top expect to see $444 and $480 getting hit next
If we need to correct and we break the lows of $319 expect to see the levels of $307 then $301 being hit
Happy Trading
Trade Smarter Live Better
Kris

Trading TSLA1:39 am 8/8/25Bullish Entry: 324.00 / 328.00 Bullish Stop 330.00 Bullish Target 330.00
Bearish Entry: 318.00 / 316.00 Bearish Stop 321.50 Bearish Target 312.00.....................Note: Supply zone 335.50/338.00

TSLA nearing breakout TSLA’s been winding tighter for weeks, and we’re finally pressing right up against the top of this symmetrical triangle on the 4H chart. Sitting at $333 price level after breaking out of that $315 area with some momentum behind it. Volume’s picking up, RSI’s pushing north of midline, and the MACD just flipped bullish.
If we can get a clean break and hold above that $335–$340 range, there’s room to stretch toward $367–$370, basically a retest of those June highs. But if we get rejected here, we probably stay stuck in this coil a bit longer. This is one of those decision point moments for TSLA where the next few candles could tell the story.

TSLA LONGQuite a simple set up. Confirmation is still needed on 3d, and daily. Bullish candles and volume is desperately needed for validation of symmetrical setup.
Volatility incoming. Break of ATH with strength leads to price discovery into $500+.

Tesla - The all time high breakout!🚗Tesla ( NASDAQ:TSLA ) will break out soon:
🔎Analysis summary:
For the past five years Tesla has overall been consolidating between support and resistance. But following the recent bullish break and retest, bulls are slowly taking over control. It is actually quite likely that Tesla will soon break above the previous all time highs.
📝Levels to watch:
$400
🙏🏻#LONGTERMVISION
SwingTraderPhil

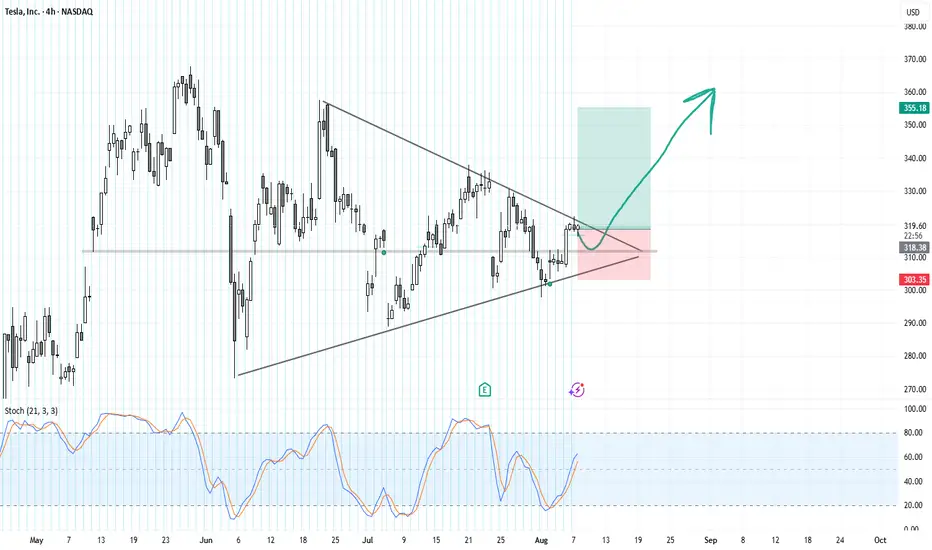
TSLABased on the provided 4-hour chart of TSLA, here is a brief summary and outlook.
Tesla's stock price has been consolidating within a symmetrical triangle pattern since late May. The price is currently trading near the upper boundary of this triangle, which is a critical resistance level. The stochastic indicator is showing a bullish crossover and is trending upwards, but it is not yet in the overbought territory.
The chart presents two potential scenarios for the immediate future. A bullish breakout (green arrow) would occur if the price successfully breaks above the upper trendline and the resistance around $320. This could lead to a significant move towards the next target, potentially around $355, as indicated by the length of the triangle's base. Conversely, a bearish scenario (red shaded area) would see the price fail to break out and instead fall back towards the lower support trendline, possibly testing the support level around $303.
The key to the next move is a decisive breakout from the current pattern. Traders should monitor for a clear break above or below the trendlines with increased volume to confirm the direction. A successful breakout to the upside would signal a continuation of the previous uptrend, while a breakdown to the downside would suggest a potential bearish reversal. The support and resistance levels marked on the chart are key reference points for managing risk and setting targets.
TESLA Sellers In Panic! BUY!
My dear friends,
TESLA looks like it will make a good move, and here are the details:
The market is trading on 302.63 pivot level.
Bias - Bullish
Technical Indicators: Supper Trend generates a clear long signal while Pivot Point HL is currently determining the overall Bullish trend of the market.
Goal - 310.73
Recommended Stop Loss - 298.19
About Used Indicators:
Pivot points are a great way to identify areas of support and resistance, but they work best when combined with other kinds of technical analysis
Disclosure: I am part of Trade Nation's Influencer program and receive a monthly fee for using their TradingView charts in my analysis.
———————————
WISH YOU ALL LUCK
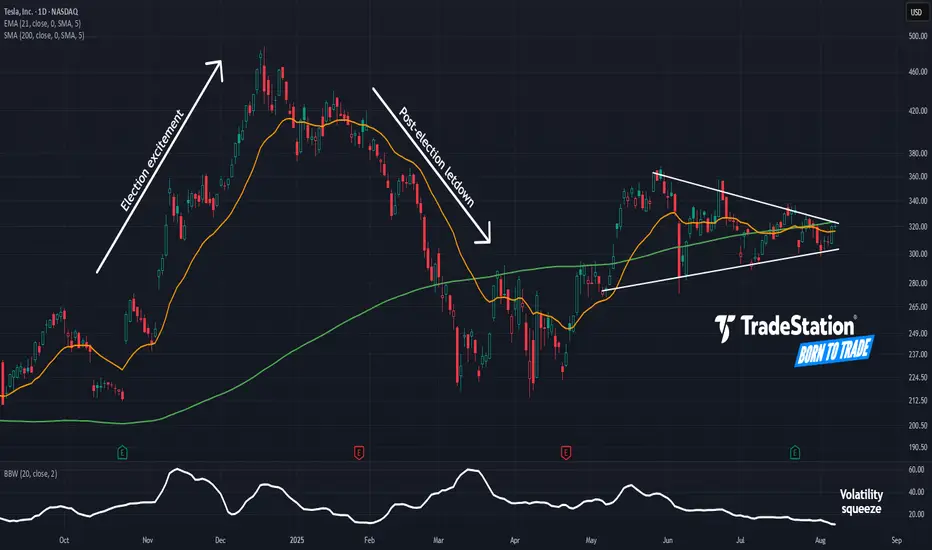
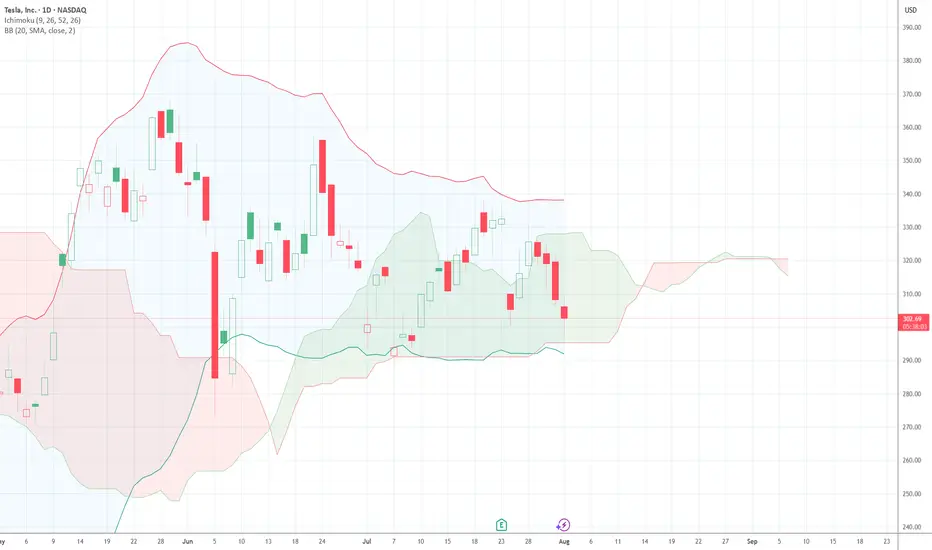
Tight Squeeze in TeslaTesla rallied sharply in late 2024, followed by a drop in the first quarter. Now, after a long period of consolidation, some traders may think the EV maker is getting ready to move again.
The first pattern on today’s chart is the series of higher lows and lower highs since May. That converging triangle may give TSLA breakout potential.
Second, Bollinger Bandwidth has squeezed to a 13-month low. Will that price compression give way to expansion?
Third, the rising 200-day simple moving average may suggest a longer-term uptrend remains in effect.
Next, prices are trying to push above the 21-day exponential moving average. That may be consistent with increasing bullishness in the short term.
Finally, TSLA is a highly active underlier in the options market. (Its average daily volume of 2.3 million contracts ranks behind only Nvidia in the S&P 500, according to TradeStation data.) That may help traders take positions with calls and puts.
TradeStation has, for decades, advanced the trading industry, providing access to stocks, options and futures. If you're born to trade, we could be for you. See our Overview for more.
Past performance, whether actual or indicated by historical tests of strategies, is no guarantee of future performance or success. There is a possibility that you may sustain a loss equal to or greater than your entire investment regardless of which asset class you trade (equities, options or futures); therefore, you should not invest or risk money that you cannot afford to lose. Online trading is not suitable for all investors. View the document titled Characteristics and Risks of Standardized Options at www.TradeStation.com . Before trading any asset class, customers must read the relevant risk disclosure statements on www.TradeStation.com . System access and trade placement and execution may be delayed or fail due to market volatility and volume, quote delays, system and software errors, Internet traffic, outages and other factors.
Securities and futures trading is offered to self-directed customers by TradeStation Securities, Inc., a broker-dealer registered with the Securities and Exchange Commission and a futures commission merchant licensed with the Commodity Futures Trading Commission). TradeStation Securities is a member of the Financial Industry Regulatory Authority, the National Futures Association, and a number of exchanges.
Options trading is not suitable for all investors. Your TradeStation Securities’ account application to trade options will be considered and approved or disapproved based on all relevant factors, including your trading experience. See www.TradeStation.com . Visit www.TradeStation.com for full details on the costs and fees associated with options.
Margin trading involves risks, and it is important that you fully understand those risks before trading on margin. The Margin Disclosure Statement outlines many of those risks, including that you can lose more funds than you deposit in your margin account; your brokerage firm can force the sale of securities in your account; your brokerage firm can sell your securities without contacting you; and you are not entitled to an extension of time on a margin call. Review the Margin Disclosure Statement at www.TradeStation.com .
TradeStation Securities, Inc. and TradeStation Technologies, Inc. are each wholly owned subsidiaries of TradeStation Group, Inc., both operating, and providing products and services, under the TradeStation brand and trademark. When applying for, or purchasing, accounts, subscriptions, products and services, it is important that you know which company you will be dealing with. Visit www.TradeStation.com for further important information explaining what this means.