Trade ideas

C calls set to expire on Friday (5/8/2020)I think C could make a move up to 50 or above this week. I saw some really cheap calls on C this afternoon just before market close. At a 0.03 premium, I picked up call contracts for the 52 strike set to expire 8 May 2020.
I'll be looking to sell the contracts if price makes a move to 50 or above.
I'm risking less than 1% (0.0935%) of my account balance.

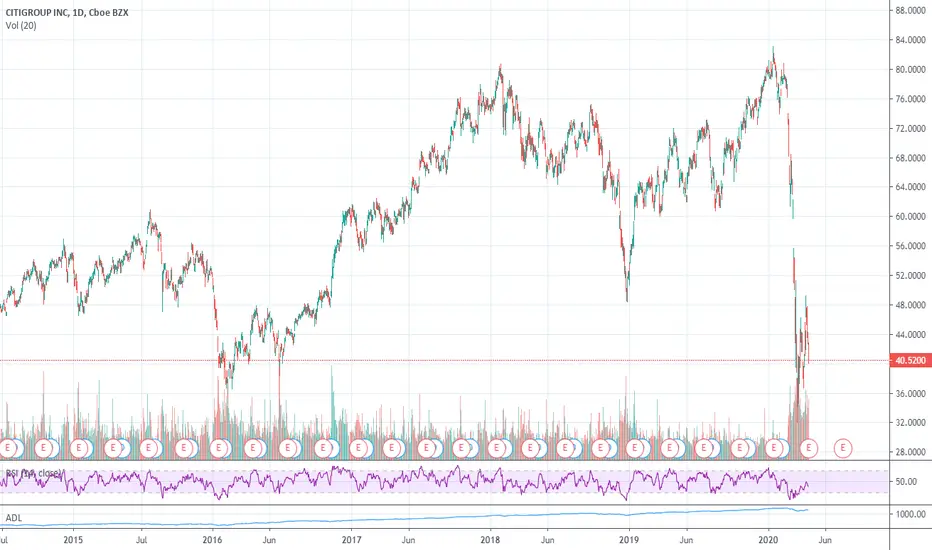
C - watch yellow line - swing calls or putsHere on the daily chart you can easily see the case for put options if stock closes below yellow line. There is one lower support on a line chart (dashed line connecting closing prices). For the bigger picture, see a long term monthly chart.
Citigroup stock can head down to 30, up to 60. Keep watch on the daily RSI. Right now indicators are leaning towards puts.

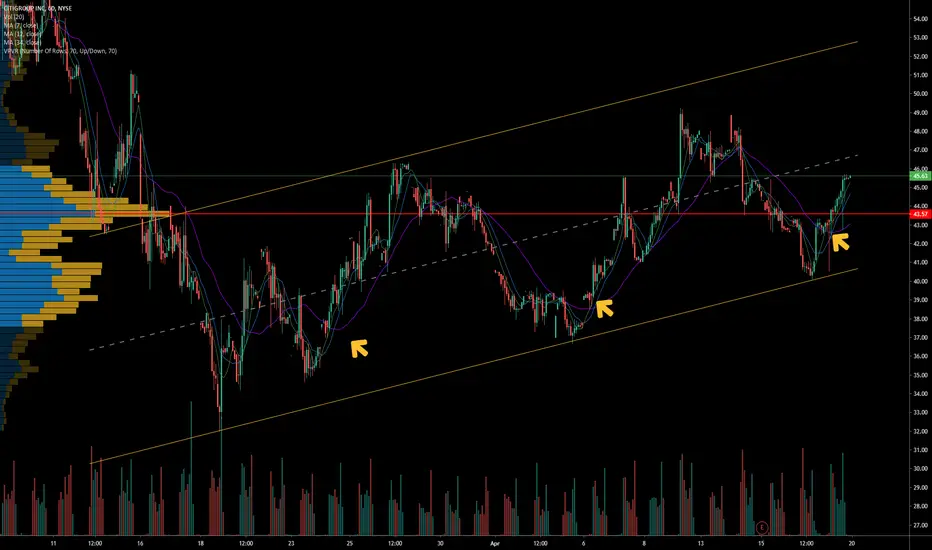
CITIGROUP (C) IN A CLASSIC FLAG FORMATION
after a strong bearish wave, we see a steady recovery on CITI.
the price is steadily going up within a rising parallel channel called a bearish flag pattern.
its called bearish because even if the sentiment is locally bullish, on a long run stock is falling and we keep our bearish bias.
we don't know how long the price will be within, the only trigger for us is the breakout.
daily candle close below is the perfect signal to look for a short trade, expecting a continuation to current structure low
with a potential rally to the downside!
keep watching citi and try to catch a perfect swing short!
good luck!

NYSE:CitibankI don't like this 174 weeks double top pattern. Last week's closing had it retested the neckline but failed to turn resistance into support. Proceed with caution. I have a short target of $18 in future.
Anything above $50.60 invalidates this view.

$C Citigroup very bullish session
Upside target to the 50 day moving average and historical resistance.
Sector is benefiting from some rotation out of big tech.
PLEASE DROP US A LIKE IF YOU FIND THIS HELPFUL, THANKS

CITIGROUP stock likely to go up .NYSE:C is likely to go up to the 50 area soon .It might even reach the 67 level if it is successful to close significantly above the 50 area in an upcoming day .

$C Citigroup bullish channel
Nice ascending channel formed
Bullish moving avergaeg crossing
Rotation int he markets and signs of economy starting to gradual open up are positives.


Expecting a bounce for Y) wave b4 it may make a low 32 again?Market Commentary:
First have an look for the positional trend i shared here previous....if you are a follower of me...and sometimes i will share the counter trend trade also in 15 mins and 1hr...but that is risky ones...so if the trend is bearish or bullish, if i am expecting the correction...book the profit there and wait the correction to end and again go with the trend....DONT TRADE THE COUNTER TRADE SETUP...you will took loss too...try to identify the sort term pull back and the long term pull back after that took small lots in the short term PB with strict stop and go with big lots in the trend side that is long term.
Read the market commentary inside the chart what i shared here carefully and try to learn Elliott waves...otherwise its tough to understand the market commentary and my analysis. I wont give a entry, stop loss and take profit in my chart...it is only for EDUCATIONAL PURPOSE and i am sharing how i am analysing the pair and labelling them according to the Elliott wave theory...I AM JUST SHOWING THE TREND HOW IT MAY GO AND MY VIEW(it may wrong too)..so DON'T FOLLOW BLINDLY MY CHART..take this as a reference and if it correlate to you strategy took the trade as per your strategy...DON'T ASK ABOUT YOUR RUNNING TRADES i wont comment on them and I WONT SUGGEST TO TAKE MY TRADE SETUP.

DB bethaighl kaiser.
From Orange A to Yellow C, colect at Green A
I can hardly believe a long on DB.
I have posted 'death raddled before.
Fantasies? nahh, optimism.


Citigroup C Bulls BuyingCitigroup looks ready to break out after a massive decline. Looking for a breakout above $44.50.

C DAILY H&S PATTERNStrong buyers with volume broke supply area, also made a reverse head and shoulders pattern

$C Citigroup Fibonacci channel tarde levelFor as long as the markets stage a recovery the beaten down banks look set fro some nice gains


Input Probability Analysis at 4H TF at CITIGROUP stocks Hi friends,
In this zone, I would choose to enter the LONG position, the reason is that it is located on a pretty nice support, thanks to which we create a strong position with a solid probability, the volume profile corresponds to the zone, Market at higher TF in UP trend
