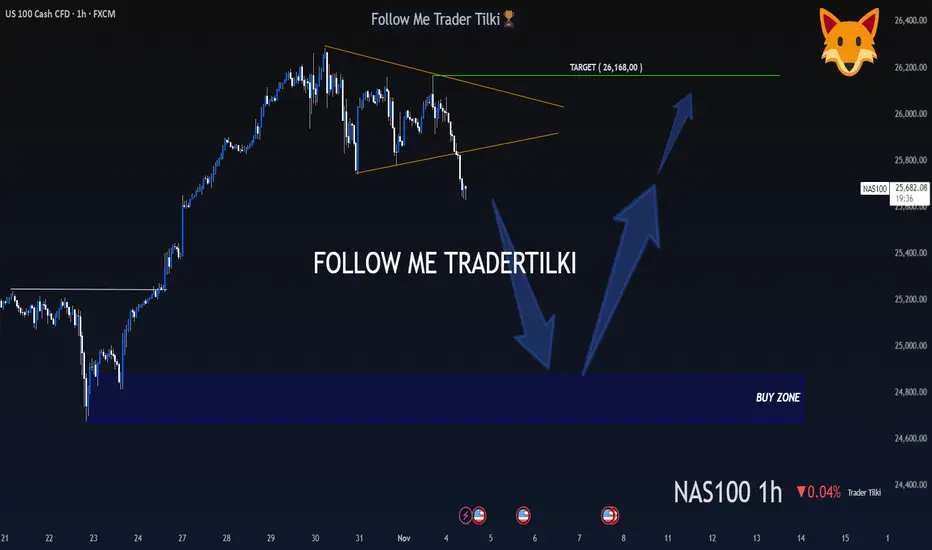
A Hunter Waits Patiently, Then Strikes Like a Lion - US100 - 1HMy dear friends, greetings,
My friends, I have set the buy levels for US100 at 24,872 and 24,677.
I will never enter a trade or put myself at unnecessary risk before these levels are reached.
My friends, in order to consistently win in this market and to become a successful trader, patience is essential.
If you act with patience and strategy, you will always be a winning trader, just like me.
I would also like you to know that my target is set at the 26,168 level.
My friends, every single like from you is my greatest motivation to share these analyses.
I sincerely thank everyone who supports me with their appreciation.
With my respect and love.
Trade ideas
Personal Account vs Prop firm TradingHere’s where a lot of traders miss the point.
Prop firms sound good on paper — funded accounts, big leverage, short-term payout structure. That’s attractive to retail and newer traders. But let’s be honest — true SMC traders see deeper.
A prop firm is a classroom. A personal account is freedom.
⚖️ Prop Firms:
• Beginner-friendly, structured, and can help build discipline early.
• But they come with strict rules — max drawdown, time limits, no weekend holds, no high-impact news trading.
• These rules can kill genuine SMC plays, because Smart Money often holds setups that develop midweek and deliver through Friday.
• Some prop firms even close trades automatically during volatile pullbacks — meaning your well-timed institutional entry could be cut off early.
Prop firms test you on rule-following, not market mastery.
💼 Personal Accounts:
• You control risk, timing, trade management, and exposure — full freedom.
• You can hold trades through the weekend, manage partials your way, and let multi-day structures complete.
• You can size positions sustainably — not recklessly, but with intent — and manage equity growth over time.
• It demands mastery, discipline, and emotional control — but that’s the essence of becoming a true trader, not a funded participant.
“Prop firms build discipline. Personal accounts build legacy.”
🧭 My Take:
I respect prop firms — they have their place. But I’m a personal account believer.
Why? Because Smart Money Concepts require freedom to express trade ideas dynamically, without artificial restrictions.
A true SMC trader isn’t trying to pass a challenge — he’s trying to understand and move with the market.
Prop firms serve the student. Personal accounts serve the master.
✍️ Closing Statement
“The real education starts when you stop testing history and start studying live footprints.
Prop firms can train your discipline, but personal mastery is built when your decisions shape your own equity.
Trading is not about probabilities — it’s about reading precision, cause, and intent. That’s the Smart Money way.”

NASDAQ 100-15m Bullish Setup/RiskyChartStructure Breakdown:
Liquidity Sweep: The equal lows taken out near 25,050 indicate engineered liquidity collection.
Displacement: Bullish impulse broke short-term structure, confirming buyers stepping in.
Fair Value Gap (FVG): The shaded blue zone marks the imbalance target where price may rebalance before deciding next direction.
Target Zone: 25,420–25,450 (FVG midpoint / supply area)
Invalidation: A clean 15m close below 25,050 would invalidate bullish bias.
Setup Type: Liquidity Sweep + Displacement + FVG Target
Entry Idea: Buy within the discount range (gray zone) after bullish confirmation
Take Profit: 25,420
Stop Loss: Below 25,050
Risk–Reward: ≈ 1:3 potential

US100 Resistance Ahead!
HI,Traders !
US100 is making a
Nice bullish correction
After a sharp local flash-crash
But a local horizontal resistance
Level is ahead at 25185.8
So after the retest we will
Be expecting a local
Bearish correction !
Comment and subscribe to help us grow !

Is this OTE or the beginning of a bear market?Is this OTE or the beginning of a bear market?
ICT OTE Theory defines the .62 retracement of a given range as the Optimum entry for the continuation of the bullish trend. Seeking Liquidity above the previous high.
We can compare this to the supply and demand theory using SMA 10 20 50. The moving averages indicate. Price currently sits below the value area between the 10 and 20 and has reacted off the 50.
Which put us in No mans land.
the 10 & 20 being above the 50 indicate the a bullish Bias.
If we are going bearish then we want to see the 10 & 20 below or crossing the 50 and price below the 50. This would be a strong setup and signal to go short. with price targets of 24224 & 22683.
HTF analysis : The M,W,D charts are still extremely bullish.
Current Sentiment: You tube videos and News reports are warning of a reversal and/or short term bearish move lower.
My Conclusion: WE are Bullish until proven differently. Next week will either support my conclusion or prove otherwise. So Stay flat and/or hedge your current positions to protect yourself the market response.

US100 FREE SIGNAL|SHORT|
✅US100 is pushing towards the premium supply zone and after a liquidity sweep above short-term highs we will expect continuation toward the next downside inefficiency as sell-side liquidity gets targeted on Monday!
—————————
Entry: 25,115.5$
Stop Loss: 25,200$
Take Profit: 24,900$
Time Frame: 3H
—————————
** SHORT🔥
✅Like and subscribe to never miss a new idea!✅

US Tech 100 (1H) Trade PlanUS Tech 100 (1H) Trade Plan
Price has completed a clean sweep of sell-side liquidity and is now showing strong displacement toward the upside. The recent break in structure confirms short-term bullish intent.
If price returns to the fair value gap or discount zone, I’ll look for confirmation to enter in alignment with the intraday bullish flow.
My first target remains the internal liquidity zone, and the potential extended target is the previous day’s high where buy-side liquidity rests.

nas100🔹 Overall Outlook and Potential Price Movements
In the charts above, we have outlined the overall outlook and possible price movement paths.
As shown, each analysis highlights a key support or resistance zone near the current market price. The market’s reaction to these zones — whether a breakout or rejection — will likely determine the next direction of the price toward the specified levels.
⚠️ Important Note:
The purpose of these trading perspectives is to identify key upcoming price levels and assess potential market reactions. The provided analyses are not trading signals in any way.
✅ Recommendation for Use:
To make effective use of these analyses, it is advised to manually draw the marked zones on your chart. Then, on the 15-minute time frame, monitor the candlestick behavior and look for valid entry triggers before making any trading decisions.

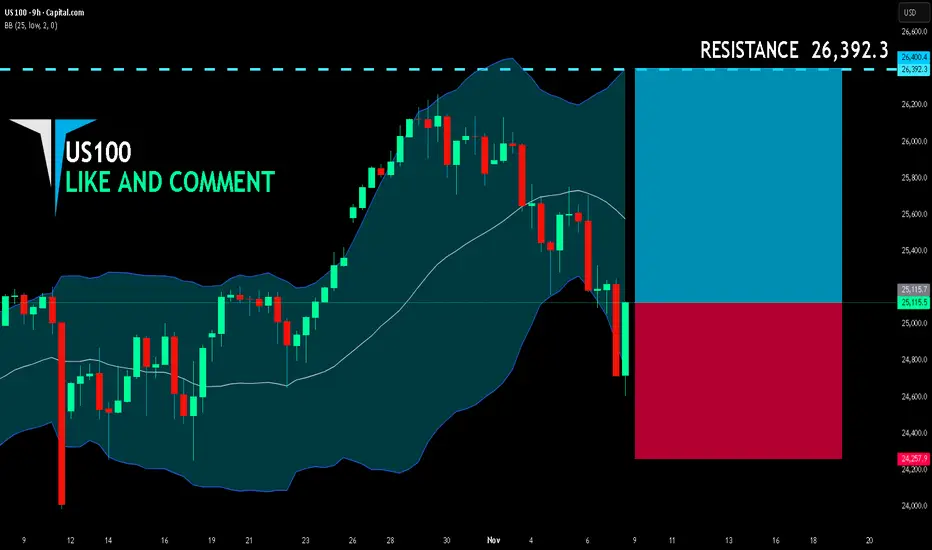
US100 LONG FROM SUPPORT
US100 SIGNAL
Trade Direction: long
Entry Level: 25,115.7
Target Level: 26,392.3
Stop Loss: 24,257.9
RISK PROFILE
Risk level: medium
Suggested risk: 1%
Timeframe: 9h
Disclosure: I am part of Trade Nation's Influencer program and receive a monthly fee for using their TradingView charts in my analysis.
✅LIKE AND COMMENT MY IDEAS✅
NAS100 Rejection last 4H candle# 📊 NAS100 (SPOT NASDAQ100) Rejection TECHNICAL ANALYSIS 🎯
## Week of November 10-14, 2025 | Intraday & Swing Trade Setup
Close Price: 25,121 | Entry Point: November 8, 2025, 12:54 AM UTC+4 💹
---
## 🔍 EXECUTIVE SUMMARY - MULTI-TIMEFRAME PERSPECTIVE
The Nasdaq-100 index exhibits a compelling convergence of technical signals across all analyzed timeframes. Elliott Wave structure suggests we're navigating wave cycles with potential breakout scenarios emerging through harmonic pattern confirmations. Bollinger Bands are contracting, indicating volatility consolidation before directional expansion. RSI readings across 5M-1H timeframes show overbought extremes transitioning to neutral zones, creating premium entry opportunities for disciplined traders. Volume analysis reveals institutional interest patterns correlating with Ichimoku Cloud positioning.
---
## 📈 TIMEFRAME-BY-TIMEFRAME ANALYSIS
### 5-MINUTE (Intraday Scalping) ⚡
Candle Pattern: Japanese candlesticks reveal micro-trend reversals with consecutive hammer formations suggesting buyer rejection zones. Evening Star patterns detected at resistance levels.
Elliott Wave: Sub-wave completion suggests wave 4 consolidation before wave 5 impulse move. Wave structure favors breakout traders targeting 25,280-25,420 resistance confluence.
Bollinger Bands: Middle band acts as dynamic support; lower band rejection patterns create high-probability short setups. Band squeeze indicating imminent volatility breakout.
RSI (14): Oscillating between 35-65 range—avoiding extremes. Divergences between price highs and RSI highs signal potential reversals at 25,180 and 25,240 levels.
Support & Resistance: Micro S/R zones at 25,095 | 25,140 | 25,180 | 25,220 | 25,280. Volume nodes clustered around 25,150.
VWAP: Price oscillating around session VWAP—each touch generates scalp opportunity. Aggressive traders fade upper band extremes.
### 15-MINUTE (Quick Swing) 🎢
Candlestick Analysis: Three-candle patterns emerging—flag continuation structures with potential for 60-80 pip breakouts. Engulfing bars confirming directional bias shifts.
Harmonic Patterns: Gartley Pattern formation detected—potential reversal zone (PRZ) at 25,165-25,195. Risk-reward ratio favorable at 1:2.5 for harmonic traders.
Wyckoff Theory: Accumulation phase evident with volume concentration and price consolidation. Distribution signs emerging—caution at resistance clusters.
Bollinger Bands: Band squeeze tightening—historical data shows 40-120 pip moves follow. Upper band resistance at 25,285; lower band support at 25,085.
Volume Analysis: Volume profile reveals point of control (POC) at 25,140—high-probability rejection zone. Volume surge required for breakout confirmation above 25,250.
Ichimoku Cloud: Price above cloud (bullish). Tenkan-sen at 25,205 acts as dynamic support. Kijun-sen (25,160) provides secondary support for pullback traders.
### 30-MINUTE (Intraday Swing) 🔄
Pattern Formation: Symmetrical Triangle formation with apex target at 25,290. Ascending triangle variant shows bullish bias—breakout above 25,270 targets 25,380-25,420 extension.
Dow Theory: Confirming higher highs & higher lows structure. Secondary trend remains bullish; pullbacks to moving average (EMA 20) present optimal entry zones.
RSI Divergence: Positive RSI divergence confirmed—price making lower lows while RSI forms higher lows at 42 level. Classic reversal setup targeting 25,260 minimum.
Exponential Moving Average: EMA 9 above EMA 21—bullish alignment. Price hugging EMA 9 (25,125) indicates strong intraday uptrend. EMA 50 (25,080) provides stop-loss anchor.
Support Zones: 25,080 (EMA 50) | 25,120 (EMA 9) | 25,160 (Kijun-sen) | 25,200 (Demand Zone)
Resistance Zones: 25,250 (Breakout trigger) | 25,290 (Triangle apex) | 25,350 (Weekly resistance)
### 1-HOUR (Core Swing Trade) 🎯
Elliott Wave Complete Picture: Primary trend shows potential Wave 3 completion near 25,350. Wave 4 correction (current consolidation) targeting 25,140-25,180 support zone. Wave 5 breakout anticipated—target: 25,450-25,520.
Pennant Pattern: Bullish Pennant formation within consolidation—breakout confirmation above 25,280 validates pattern. Minimum target: 25,450 (measured move from pole).
Bollinger Bands (1H): Upper band at 25,380 represents squeeze breakout target. Middle band (25,200) = bullish support. Lower band rejection creates risk-reward optimization point.
VWAP Daily: Price trading above VWAP—bullish gradient confirmed. Each hourly candle close above VWAP strengthens trend continuation probability. Rejection below VWAP = caution signal.
Volume Profile: Heavily traded at 25,150-25,180 (support) and 25,240-25,280 (resistance). Imbalances favor upside—low volume zone above 25,300 suggesting vacuum to fill.
Ichimoku Alignment: Price above Senkou Span A & B—cloud thickness indicates strong support. Chikou Span lag above candles = bullish confirmation. Cloud color shift (bullish green) reinforces uptrend.
Gann Theory: 45-degree angle trendline from swing low confirms rally angle. Resistance at 38.2% Fibonacci extension (25,280) precedes aggressive breakout phase.
### 4-HOUR (Swing Trade Foundation) 💼
Daily Chart Alignment: 4H timeframe shows potential Inverse Head & Shoulders pattern—right shoulder completing (current zone: 25,120-25,180). Breakout above 25,280 neckline targets 25,450-25,520 extension.
Wyckoff Accumulation: Institutional buying evident—small barometer move (SBM) triggers accumulation phase. Spring tests below support anticipated 25,080-25,100 zone.
RSI 4H: RSI at 54-60 range—neutral bullish. Still room for upside extension without extreme overbought. RSI above 70 targets 25,350+. Below 30 requires defensive posturing.
Cup & Handle Pattern: Potential bullish Cup formation completing—handle stabilization near 25,150-25,200. Breakout above handle (25,280) targets cup depth extension = 25,420.
EMA Ribbon: EMA 8, 13, 21, 50, 200 = bullish alignment. Compression and expansion cycles indicate momentum phases. Ribbon support at 25,120 = critical hold level.
Support Tiers 4H: 25,050 (structural) | 25,120 (EMA 8) | 25,160 (EMA 21) | 25,200 (demand cluster)
Resistance Tiers 4H: 25,280 (key breakout) | 25,350 (extension) | 25,420 (major target) | 25,500 (weekly projection)
### DAILY CHART (Swing Trade Thesis) 📅
Macro Elliott Wave: We're potentially in Wave 3 of a larger cycle—still room for aggressive expansion. Wave structure favors break of 25,350 targeting 25,500-25,650 daily close.
Double Bottom Recognition: Historical pattern shows Double Bottom formation near 25,000 support—confirmed breakthrough above 25,250 neckline triggered. Second target near 25,450-25,500.
Bollinger Bands Daily: Upper band at 25,480 = realistic daily target. Mean (25,200) = healthy pullback support. Band slope indicates volatility expansion—expect 250-400 pip daily ranges.
Volume Signature: Daily volume profile shows strong buying volume bar at 25,050-25,100 zone (institutional accumulation marker). Selling volume decreasing—demand controlling.
Ichimoku Daily: Cloud thickness growing—bullish trend strengthening. Cloud support around 25,150-25,200. Kumo Breakout anticipated—targets cloud top edge at 25,350-25,420.
Harmonic Analysis: Butterfly Pattern potential completion—PRZ at 25,280-25,320 suggests reversal zone OR breakout confirmation. Confluence amplifies probability.
Gann Angles & Fibonacci: 50% retracement (25,100) + 61.8% extension (25,420) = key reversal zones. Gann fan angles suggest 25,350-25,400 as structural resistance before continuation.
Key Daily Support: 25,000 (psychological/structural) | 25,050 (accumulation) | 25,140 (weekly midpoint) | 25,200 (demand zone)
Key Daily Resistance: 25,280 (breakout trigger) | 25,350 (extension) | 25,420 (measured move) | 25,500 (weekly target)
---
## 🎪 TRADING SETUP PLAYBOOK - NOV 10-14
### BULLISH SCENARIO (Probability: 72%) ✅
Trigger: 4H candle close above 25,280 + volume surge + RSI above 55
Entry Zone: 25,200-25,250 (with breakout confirmation)
Target 1: 25,350 | Target 2: 25,420 | Target 3: 25,500
Stop Loss: 25,120 (below EMA support)
Risk/Reward: 1:2.8 (excellent entry)
### BEARISH SCENARIO (Probability: 28%) ⚠️
Trigger: Daily close below 25,200 + volume increase + RSI divergence
Entry Zone: 25,280-25,300 (short setup)
Target 1: 25,200 | Target 2: 25,140 | Target 3: 25,050
Stop Loss: 25,350 (above resistance)
Risk/Reward: 1:2.1 (acceptable but lower probability)
---
## ⚠️ VOLATILITY & OVERBOUGHT/OVERSOLD CONDITIONS
Current Volatility Status: Moderate compression → Expect expansion soon
5M/15M: RSI in 40-65 range (neutral)—room for 25-40 pip moves
30M/1H: RSI near 55-60 (bullish bias, not extreme)
4H: RSI 54-62 range—still room to run without overbought
Daily: RSI 58-68 (approaching caution zone)—be defensive if daily RSI>75
Overbought Recognition Points:
Watch for RSI>75 combined with Band upper rejection + Ichimoku cloud top break fails. Take profits on technical extremes.
Oversold Setups:
RSI<30 on 1H + price below EMA 50 = high-probability bounce back to 25,200-25,250.
---
## 🎯 ENTRY & EXIT OPTIMIZATION
### OPTIMAL ENTRY TIMING
For Bullish Scalpers (5M): RSI bounce from 40-45 zone after Band lower touch = 15-25 pip scalp target
For Swing Traders (15M-30M): 15M candle close above 25,250 with 4H alignment = 60-120 pip swing target
For Core Swings (1H-4H): 4H pennant breakout above 25,280 on volume = 150-300+ pip target (hold 24-48 hours)
For Position Traders (Daily): Daily close above 25,350 = continuation play targeting 25,500-25,650 (hold 5-7 days)
### EXIT STRATEGIES
Take Profit Levels: 1. Fibonacci 38.2% = 25,280 | 2. Harmonic PRZ = 25,320 | 3. Daily Band upper = 25,420 | 4. Weekly target = 25,500
Stop Loss Placement: Below most recent swing low + 10 pips (risk management priority)
Trailing Stops: Activate at 25,350—trail with 40-50 pip buffer for 4H+ trades
Breakeven Exit: Move stops to entry after 1:1 risk/reward achieved—reduce emotional trading
---
## 🔔 REVERSAL & BREAKOUT RECOGNITION CHECKLIST
### REVERSAL SIGNALS TO WATCH:
RSI divergence (lower highs on price, higher lows on indicator)
Candlestick engulfing patterns at resistance/support zones
Volume breakdown (declining volume on breakout attempts)
Ichimoku Cloud rejection (price fails to penetrate cloud layer)
Harmonic pattern completion (Gartley/Butterfly PRZ exact hit)
Elliott Wave 5th wave failure (truncation pattern)
### BREAKOUT CONFIRMATION RULES:
Close beyond resistance on high volume (>20% volume increase)
RSI confirms breakout direction (above 55 for bullish, below 45 for bearish)
VWAP crosses align with directional move
Bollinger Band breakout with band expansion (squeeze release)
Multiple timeframe confluence (5M + 15M + 1H aligned)
Ichimoku Cloud break (price clears all clouds smoothly)
---
## 💡 WEEK FORECAST SUMMARY - NOV 10-14
Monday (10th): Consolidation continuation—watch for range break direction. European open volatility catalyst expected.
Tuesday-Wednesday: Breakout window opens—25,280 represents key decision point. Expect 150-250 pip daily moves.
Thursday: Potential pullback/consolidation after breakout (profit-taking). Support retest of 25,250-25,200.
Friday (14th): Weekly close pattern formation—extension run anticipated if above 25,350. Week target: 25,420-25,500.
---
## 📍 CRITICAL CONFLUENCE ZONES
25,080-25,100: Major support (accumulation zone, Wyckoff spring testing area)
25,140-25,180: Secondary support (EMA 9, Ichimoku, volume POC)
25,200-25,250: Entry zone (demand cluster, Cup handle support)
25,280-25,320: KEY BREAKOUT ZONE (all timeframe resistance, harmonic confluence)
25,350-25,420: Primary upside target (Elliott Wave 5, daily Band, measured move extension)
25,500+: Weekly resistance/extension target
---
## 🏆 RISK MANAGEMENT SUMMARY
✅ Never risk >2% account per trade
✅ Use 1:2+ risk/reward minimum on all entries
✅ Scale profits at 1:1 and 1:2 levels
✅ Maintain tight stops (10-15 pips on 1H trades)
✅ Avoid breakout FOMO—wait for close confirmation
✅ Respect daily support zones—psychological holds matter
---
## #TRADINGSETUP #NAS100 #TECHNICALANALYSIS #NASDAQ100
#ELLIOTTWAVE #HARMONICPATTERN #BREAKOUTTRADING #SWINGTRADER
#DAYTRADING #INTRADAY #FOREX #TRADING #ANALYSIS #TRADINGVIEW
#BOLLINGER BANDS #RSI #ICHIMOKU #VWAP #TRADINGSTRATEGY
#WYCKOFFMETHOD #GANNTHEORY #DOWTHEORY #TECHNICALS
#SUPPORTANDRESISTANCE #VOLUMEANALYSIS #OVERBOUGHT #OVERSOLD
---
Disclaimer: This analysis is educational only. Always conduct your own research and use appropriate risk management. Past performance ≠ future results. Trade at your own risk.
Analysis Created: November 8, 2025 | Valid Through: November 14, 2025

Nasdaq completed market cycle and bounced back from supportNasdaq completed market cycle and bounced back from support.

Nasdaq Short: Peak Confirmed; Bear Market ConfirmedIt is now clear that the bull market ended on 30th Oct and that we have already seen the first completed wave down for Nasdaq that unfolded in clear 5-wave structure. The sub-waves also showed clear 5-wave structure themselves.
We are currently in a wave 2 retracement that is facing the first real support-turned-resistance. However, take note that wave 2 can technically go all the way up to the start of wave 1 without invalidating the idea. So look out for reversal signal or confirmation before you short.

NAS100 SELL SIGNALWait for price to reach AOI & wait for rejection. Go on lower timeframes to confirm CHOCH. Wait for a signal of sellers coming in (bearish engulfing - maybe) then enter SELLS.

Nasdaq - The most important structure!💰Nasdaq ( TVC:NDQ ) perfectly respects structure:
🔎Analysis summary:
Over the course of the past couple of months, the Nasdaq has been rallying an expected +50%. Still, until the Nasdaq will retest the upper channel resistance trendline, this rally won't be over. Therefore, we can still see a rally of another +10% in the very near future.
📝Levels to watch:
$25,000 and $30,000
SwingTraderPhil
SwingTrading.Simplified. | Investing.Simplified. | #LONGTERMVISION

NAS100 - BullishNAS100 is bullish on 4H timeframe is currently bouncing from trendline support. Buying at current market price.

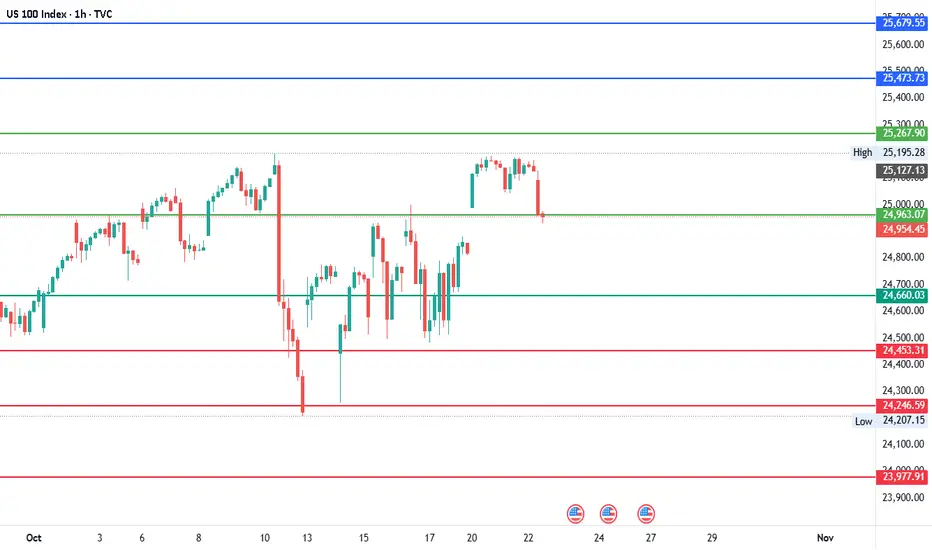
#NDQ - Short-term Range $26,216 - $23,709 | 1000 Points Move?Date: 22-10-2025
#NDQ - Current Price: $24,963.00
Pivot Point: $24,963.07 Support: $24,660.03 Resistance: $25,267.90
Upside Levels:
L1: $25,473.73 L2: $25,679.55 L3: $25,948.23 L4: $26,216.91
Downside Levels:
L1: $24,453.31 L2: $24,246.59 L3: $23,977.91 L4: $23,709.23
#TradingView #Nifty #BankNifty #DJI #NDQ #SENSEX #DAX #USOIL #GOLD #SILVER
NAS100 Bullish divergence on 1HNAS100 is showing a Bullish divergence in RSI in a 1H chart. This can be confirmed if the neckline breaks the LH at around 25270 points.

NAS100 1500 pips secured!Set up played out perfectly, breaking structure to during London session, sweep BSL, followed by internal IFVG to target 1500 pips

US NAS 100 BIG FALLPreferably suitable for scalping and accurate as long as you watch carefully the price action with the drawn areas.
With your likes and comments, you give me enough energy to provide the best analysis on an ongoing basis.
And if you needed any analysis that was not on the page, you can ask me with a comment or a personal message.
Enjoy Trading ;)

NAS100 H1 | Bullish Bounce off Key SupportNAS100 is falling towards our buy entry at 24,841, which is a swing low support level that aligns with the 161.8% Fibonacci extension level.
The stop loss is at 24,664, which is a swing low support level, while the take profit is at 25,102, which is a pullback resistance level.
Stratos Markets Limited (tradu.com/uk ):
CFDs are complex instruments and come with a high risk of losing money rapidly due to leverage. 68% of retail investor accounts lose money when trading CFDs with this provider. You should consider whether you understand how CFDs work and whether you can afford to take the high risk of losing your money.
Stratos Europe Ltd (tradu.com/eu ):
CFDs are complex instruments and come with a high risk of losing money rapidly due to leverage. 70% of retail investor accounts lose money when trading CFDs with this provider. You should consider whether you understand how CFDs work and whether you can afford to take the high risk of losing your money.

NAS100 Trade Set Up Nov 7 2025Price remains bearish so i will only looking for sells either after price sweeps internal BSL or London highs BSL before looking for 1m-5m IFVG/CISD to take sells to lower SSL levels

Nasdaq slides as volatility growsNasdaq was pushed down to the local support area, as the sentiment for the stock market has worsened due to a certain degree of deleveraging for stocks and investors moving to safety.
VIX (S&P 500 volatility index) has climbed above 20, which pushes the market’s volatility expectations higher and may trigger nervous reactions for tech stocks. The longest duration of downswings for Nasdaq is about 15-17 days, which allows us to project the downward move to a longer time period, with a further development of the bullish pullback, as shown at the chart.
Don't forget - this is just the idea, always do your own research and never forget to manage your risk!

USNAS100 – Bearish Bias Below 25230 | Targeting 24850–24350USNAS100 | Overview
Wall Street futures struggled for traction at the end of a wobbly week, as optimism around artificial intelligence—which helped drive markets to all-time highs earlier this year—has been tempered by growing concerns over monetization challenges and circular spending within the tech sector.
Technically:
The index maintains a bearish momentum while trading below the pivot line at 25230.
Currently, price action suggests a possible break below 25010, which would confirm a continuation toward 24850, with an extended downside target near 24350.
However, a 1H close above 25230 would indicate renewed bullish momentum, signaling a potential recovery toward 25430 and 25700.
Pivot Line: 25180
Resistance: 25430 · 25700
Support: 24860 · 24760 · 24350
Outlook:
USNAS100 remains bearish while below 25230, targeting 24850–24350 in the short term.
A confirmed 1H close above 25230 would shift bias to bullish continuation, eyeing 25430–25700.
