US100: Ready To Start a Downward Move?US100: Ready To Start a Downward Move?
A few days ago I posted an bullish forecast for US100.
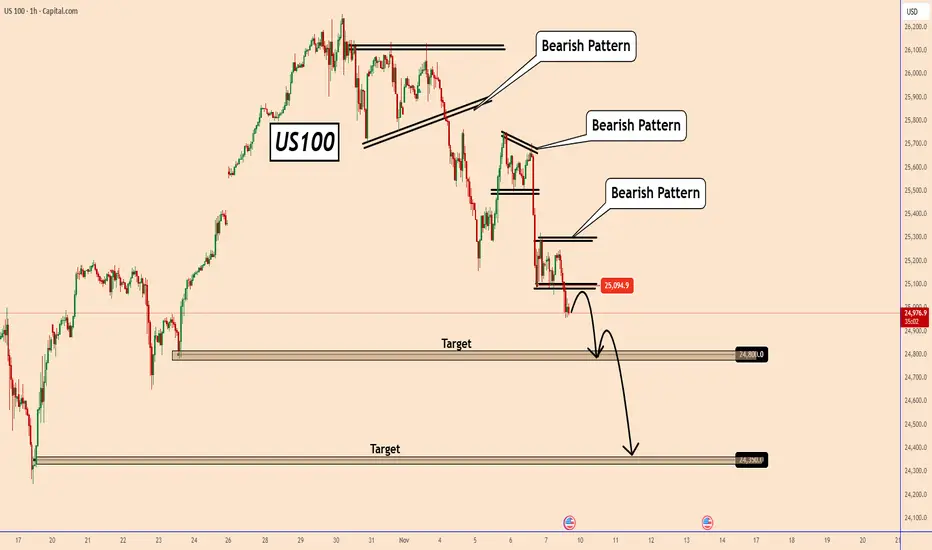
US100 couldn't manage to break above the triangle pattern, and the price turned bearish.
Currently, we can see several bearish patterns one after the other. This sell-off started yesterday and may continue further in the coming days.
It could be related to earnings reports, AI bubble fears, etc. However, all indices were also heavily overvalued.
If the price respects this new bearish structure, we could see US100 falling to 24800 and 24350 first.
I will keep you all updated.
You may find more details in the chart!
Thank you and Good Luck!
❤️PS: Please support with a like or comment if you find this analysis useful for your trading day❤️
Trade ideas
Nasdaq: Sharp tech drop sets up critical support testNasdaq slid 2% yesterday in its sharpest tech-led drop since late summer—are we looking at a healthy correction, or could there be a deeper move ahead?
Caution returned to tech stocks as AI valuations and a handful of Big Tech earnings disappointed. The broader market also retreated, with traders watching for the next move from both the Fed and the earnings calendar.
Key drivers:
AI and semiconductor leaders like Nvidia, AMD, and Palantir led the selloff as investors questioned how much further the AI trade can run.
Hawkish remarks from multiple Fed officials raised doubts about any imminent rate cuts, even after the recent 25bp cut, fuelling profit-taking in volatile growth names.
Top Wall Street banks cautioned about stretched valuations, warning a 10–20% correction was possible as positioning remains crowded in mega caps.
Technically, the Nasdaq is pulling back from historic highs, testing median channel support with RSI retreating toward neutral. Key resistances are near 25500 and 25750, with support showing at 25200 and then under 25k.
Stay nimble and respect the potential range between 25450 and 25870 as pivotal for the next Nasdaq swing. Wait for strong resistance confirmation, but don’t ignore bounce risk if earnings and data surprise to the upside.
This content is not directed to residents of the EU or UK. Any opinions, news, research, analyses, prices or other information contained on this website is provided as general market commentary and does not constitute investment advice. ThinkMarkets will not accept liability for any loss or damage including, without limitation, to any loss of profit which may arise directly or indirectly from use of or reliance on such information.

NASDAQ100 HIGH PROBABILITY SETUP SOON!!!🚨 NAS100 HIGH PROBABILITY SELL/BUY SETUP 🚨
* Here We Can See Clearly The Next Potential Moves For US100 Coming Hours/Days.
* Keep Your Eyes Close On Your Trading Positions.
* Happy PIP Hunting Traders.
FXKILLA.

US100How to become successful in forex and stock trading:
1.Master fundamentals and technical analysis.
2.Build and follow a solid trading plan.
3.Apply strict risk management (4–6% rule).
4.Stay disciplined—control fear and greed.
5.Record and analyze every trade.
6.Focus on high-quality setups only.
7.Diversify across assets and markets.
8.Keep evolving—study, adapt, and grow daily.

USNAS100 | Buyers Hold Control Above 25440USNAS100 | Overview
The price reached the resistance zone after stabilizing above 25440.
Currently, it appears to be retesting 25440 before attempting another push higher toward 25700 – 25820.
A 1H close above 25820 would confirm further bullish momentum toward the all-time high (ATH) at 26170.
However, a move below 25440 would indicate renewed bearish pressure toward 25220, with a confirmed break below 25220 activating a broader downward trend.
Pivot Line: 25700
Resistance: 25820 · 25960 · 26170
Support: 25440 · 25230 · 25010
Outlook:
Bullish while above 25440, targeting 25700–25820.
Bearish scenario activates only below 25220.

US100 consolidation a bullish Phase TrendThe US100 remains within a short-term bearish trend, though recent price action suggests a potential recovery phase if support levels hold.
Technically Wall Street futures gained on Monday, marking a positive start to November. The move was supported by renewed optimism around oil demand and hopes of progress in U.S.–China trade relations, boosting overall risk appetite.
Key technical levels:
Resistance: 26,400 — A sustained move above this level could confirm bullish momentum and open the path for further gains. 25,700 If prices retrace to this zone and hold, we could see renewed buying pressure as investors position for a rebound a decisive break below 25,700 would likely signal a continuation of the downtrend, inviting further downside. In the short term, expect some volatility as the index tests these critical levels. If buying interest remains strong near support, the US100 could resume an upward correction, giving investors an opportunity to take short- to mid-term profits.
You may find more details in the chart.
Trade wisely best of Luck Buddies.
Ps; Support with like and comments for better analysis Thanks for Supporting.

Nasdaq Fails to Return to Record HighsOver the past six trading sessions, the Nasdaq index has begun to show a notable bearish correction of more than 2.6% in the short term, reinforcing a downward bias that remains active at this stage. So far, the selling pressure has persisted as the market grows increasingly concerned about the performance of several companies linked to artificial intelligence, which have maintained significant valuations without yet reporting profits strong enough to justify those price levels. This situation has started to raise warning signals and trigger a short-term decline in confidence, which, if sustained, could become a key driver of stronger selling pressure in Nasdaq movements over the coming sessions.
Uptrend Still Holding
Despite recent corrections, the Nasdaq index has managed to preserve a steady upward trendline since around April 14 of this year, and so far, there has not been a strong enough sell-off to cause a meaningful break of this trend in the short term. However, if the current selling pressure continues, it could increase the risk of weakening the buying trendline, which has recently entered a phase of consolidation or pause over the past few sessions.
RSI
The RSI indicator line remains oscillating close to the 50 level, suggesting a technical balance between buying and selling strength over the average impulses of the last 14 trading sessions. As long as this behavior persists, the market may enter a more pronounced phase of indecision in the short term, reflecting the absence of a clear directional bias in price movements.
MACD
The MACD indicator, meanwhile, has started to show a neutral pattern, as its histogram continues to approach the zero line. This indicates indecision in the strength of short-term moving averages and could be signaling the formation of a more significant technical neutrality, where the market seeks an equilibrium point before defining a new directional move.
Key Levels to Watch:
26,000 points – Main resistance: Corresponds to the recent record highs and stands as the most important bullish barrier to watch. Movements that manage to hold above this level could confirm a stronger buying bias, potentially allowing the uptrend to continue on the chart.
25,115 points – Near support: This zone coincides with the most recent price retracements and could act as a technical barrier against potential short-term downward corrections.
23,800 points – Critical support: This level corresponds to the 23.6% Fibonacci retracement on the chart. Bearish movements that reach and break below this area could put the current trendline at risk and generate a stronger selling bias in the short term.
Written by Julian Pineda, CFA – Market Analyst

NASDAQ POTENTIAL LONG 2 NOV 2025SWING TRADE
4H structure remains BULLISH
Waiting for the swing PB to look for longs at marked potential entry areas if 15m structure shifts BULLISH in either of these zones.
15m structure is currently BEARISH and will wait for MSS before looking for longs.
I am not interested in shorting the PB but instead going with the trend.
Currently up +-2000 points on NSDQ for SEP and OCT.
Follow me TRADINGVIEW
Insta garethxsavage

US100 – 1H Demand Zone Bounce | Bullish Reversal SetupTechnical Outlook
Price tapped into a clean 1H demand block.
Early bullish reaction from intraday support.
Potential retracement targets: 25,800 → 26,200
Setup invalid if price closes below 25,270
💰 Trade Plan (Example)
Entry: 25,380–25,400
Stop Loss: Below 25,270
Take Profit: 26,200
🧠 Bias: Bullish (Short-term bounce expected)
🎯 Focus on confirmation candle or structure break above 25,600 for momentum continuation.
#US100 #NASDAQ100 #Indices #TradingView #TechnicalAnalysis #PriceAction #SmartMoneyConcepts #SwingTrade #StockMarket #IndexTrading

US NAS 100 BIG FALLPreferably suitable for scalping and accurate as long as you watch carefully the price action with the drawn areas.
With your likes and comments, you give me enough energy to provide the best analysis on an ongoing basis.
And if you needed any analysis that was not on the page, you can ask me with a comment or a personal message.
Enjoy Trading ;)

USNAS100 – Bearish Bias Below 25230 | Targeting 24850–24350USNAS100 | Overview
Wall Street futures struggled for traction at the end of a wobbly week, as optimism around artificial intelligence—which helped drive markets to all-time highs earlier this year—has been tempered by growing concerns over monetization challenges and circular spending within the tech sector.
Technically:
The index maintains a bearish momentum while trading below the pivot line at 25230.
Currently, price action suggests a possible break below 25010, which would confirm a continuation toward 24850, with an extended downside target near 24350.
However, a 1H close above 25230 would indicate renewed bullish momentum, signaling a potential recovery toward 25430 and 25700.
Pivot Line: 25180
Resistance: 25430 · 25700
Support: 24860 · 24760 · 24350
Outlook:
USNAS100 remains bearish while below 25230, targeting 24850–24350 in the short term.
A confirmed 1H close above 25230 would shift bias to bullish continuation, eyeing 25430–25700.

US100 Free Signal! Sell!
Hello,Traders!
US100 is expected to soon retest the horizontal supply area before continuing its bearish move toward the target zone.
---------------------
Stop Loss: 25,877$
Take Profit: 25,607$
Entry: 25,728$
Time Frame: 2H
---------------------
Sell!
Comment and subscribe to help us grow!
Check out other forecasts below too!
Disclosure: I am part of Trade Nation's Influencer program and receive a monthly fee for using their TradingView charts in my analysis.

US100 Will Hit Resistance Soon!
HI,Traders !
#US100 keeps growing
And the price will soon
Hit a horizontal resistance
Of 25817.8 from where
A local bearish correction
Is to be expected !
Comment and subscribe to help us grow !

NAS100 Trade Set Up Nov 6 2025Price is bullish making HH/HL on the 1h and BOS of the Asia range so i will wait for price to sweep internal SSL and/or tap into 1h FVG to then look for 1m-5m IFVG/CISD to take buys to PDH and daily FVG to fill the imbalance

US NAS 100Preferably suitable for scalping and accurate as long as you watch carefully the price action with the drawn areas.
With your likes and comments, you give me enough energy to provide the best analysis on an ongoing basis.
And if you needed any analysis that was not on the page, you can ask me with a comment or a personal message.
Enjoy Trading ;)

How to Trade NASDAQ NAS100 Retracements Into An Imbalance🚀 NASDAQ NAS100 Analysis – Watching for a Bullish Opportunity 📈
I'm currently focused on the Nasdaq NAS100. On the weekly timeframe, it remains in a strong bullish trend 💹. Recently, however, we've seen a sharp and aggressive retracement. Given that the market was overextended, this pullback is healthy and expected, as price seeks to tap liquidity pools and rebalance ⚖️.
Zooming into the 4-hour timeframe, we can clearly identify a bullish imbalance 🔹. This area serves as my key point of interest for a potential move lower. The ideal scenario is for price to hold above the imbalance low and then break structure bullishly 🔼.
Key conditions for a high-probability long trade:
Price must not break below the imbalance low 🚫⬇️
Price must establish higher highs and higher lows to confirm bullish momentum 🔝
If these conditions align, I will be looking for a long entry opportunity. ⚠️ Not financial advice – this is purely market analysis for educational purposes.

NASDAQ - Signal#NASDAQ - Signal
H4 - Formation of the 3rd wave + trend line breakout. Stop at the low of the 1st wave.
Entry: 25758.3
TP: 26252.9 - 26916.2 - 27341.2 - 28019.1
Stop: 25142.7

Weakness PersistsI'm loathe to make a prediction here since I've been wrong so many times but I feel that today might be a bull trap. I still feel strongly the NASDAQ is in a bubble and I do hold a short in SNAS.AX. I'm thinking a close today below the rising blue trend line implies the breakdown is still in effect.

NASDAQ BullishOne of the remarkable characteristics of the NASDAQ is its ability to sustain rallies even at all-time highs. This resilience is largely driven by the “Big 7” tech companies, which collectively account for roughly 40% of the index’s weight. Their constant innovation continues to fuel long-term bullish momentum across the sector.
Heading into next week, I anticipate the potential formation of new all-time highs, particularly if price breaks and trades above 25,859.8 — Thursday’s daily rejection candle and the vicinity of the -27% Fibonacci extension level.
#NASDAQ #US100 #Indices #TechnicalAnalysis #TradingView

US100 - BULLISH POSSIBILITYPrice constantly forming higher lows which indicate a strong uptrend tendency. Possibility of stronger confirmation if you decide to wait for price to break above 25,750. This is purely ideas purpose only and should not be used alone to take on a trade. Good profits traders.

NAS100 – Bullish Setup Alert (Inverse Head & Shoulders on 30min)#NAS100 has been moving sideways on the higher time frames, showing consolidation after recent volatility. However, on the 30-minute chart, it’s now forming a clean Inverse Head & Shoulders pattern, which is a classic bullish reversal signal.
Key Levels to Watch:
Neckline Breakout Zone: Watch for a breakout above the neckline for confirmation of bullish momentum.
Entry Plan: Wait for a break and retest of the neckline before entering a long position.
Targets: Short-term resistance zones and Fibonacci extensions can be used for profit booking.
Risk Management: Always use a tight stop-loss below the right shoulder to protect capital.
Technical Outlook:
Once the neckline is broken with volume confirmation, it may trigger a strong bullish continuation move — aligning with broader market momentum.
What’s your view on this setup?
Do you see a breakout coming soon, or another fakeout before the move? Share your thoughts below
#NAS100 #Trading #PriceAction #ChartAnalysis #TechnicalAnalysis #HeadAndShoulders #Forex #Indices #DayTrading

US NAS 100Preferably suitable for scalping and accurate as long as you watch carefully the price action with the drawn areas.
With your likes and comments, you give me enough energy to provide the best analysis on an ongoing basis.
And if you needed any analysis that was not on the page, you can ask me with a comment or a personal message.
Enjoy Trading ;)

NAS BEARISH SETUP Price has broken the ascending channel after rejecting new highs clearly on D1 chart. A fall towards 24.500 is forecast. Early entries a valid now but price might test 25.718 first before it falls
