US NAS 100Preferably suitable for scalping and accurate as long as you watch carefully the price action with the drawn areas.
With your likes and comments, you give me enough energy to provide the best analysis on an ongoing basis.
And if you needed any analysis that was not on the page, you can ask me with a comment or a personal message.
Enjoy Trading ;)
Trade ideas

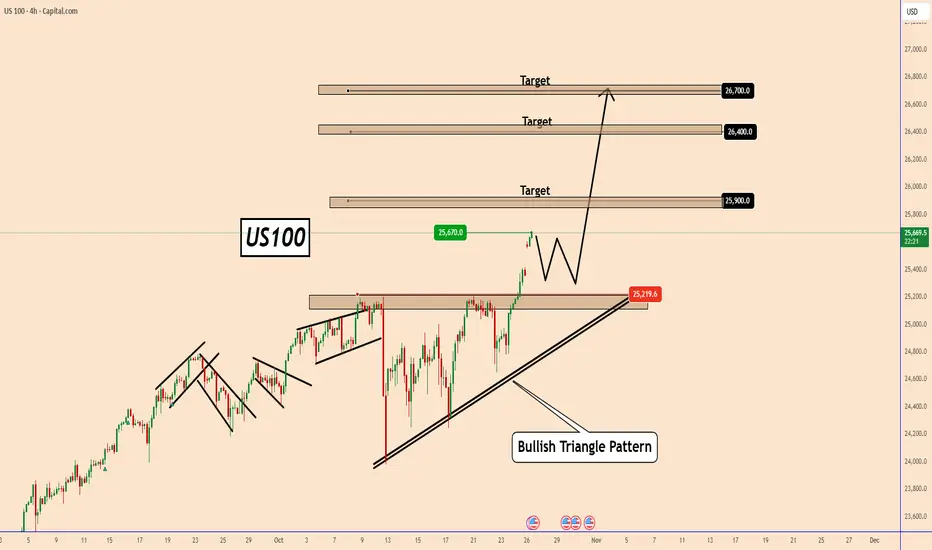
US100 Breaks Out as Trade Optimism and Fed Expectations Fuel MomUS100 Breaks Out as Trade Optimism and Fed Expectations Fuel Momentum
Over the weekend, US President Donald Trump said that the US and China will reach a deal.
US President Donald Trump said that the US and China are ready to "reach" a trade deal, as he is expected to meet with Chinese President Xi Jinping later this week in South Korea during his Asia tour.
This decision gave the market a breather and increased optimism about an improvement in business sentiment. The indices came out of consolidation to create new record highs.
US100 has already reached 25670 and looks set to rise further as shown in the chart with targets:
25900; 26400 and 26700
This week, the FED is also expected to cut rates by 25 basis points to 4% from 4.25%.
These expectations should help indices to rise further
US100 may test 25300 again before moving further. So, take note of this.
However, so far, US100 remains strong, and this momentum could continue to grow further.
You may find more details in the chart!
Thank you and Good Luck!
❤️PS: Please support with a like or comment if you find this analysis useful for your trading day❤️
NasdaqNasdaq is showing a correction pattern after a previous upward movement. The price closed below the old support zone and was rejected, confirming a resistance zone at 25,923.4.
The loss of this support reinforces the continuation of the corrective movement, with a projected drop towards the next support zone at 25,569.8, a point where there is convergence with the previous low and a potential area for absorbing buy orders.

NAS100 Trade Set Up Nov 7 2025Price remains bearish so i will only looking for sells either after price sweeps internal BSL or London highs BSL before looking for 1m-5m IFVG/CISD to take sells to lower SSL levels

US100US100 is in bearish trend.
Potentially printing LH and LL.
No sign of reversal .
Alligator mouth open which also confirm trend will go down.
We sell at CMP.

US100 MARKET OUTLOOK!US100 had a sharp drop in price recently from in yesterday’s trading session. From the H4 perspective , we’re beginning to see a bearish momentum kick in. I’m looking forward to seeing more price drops. Therefore, a sell opportunity is envisaged.

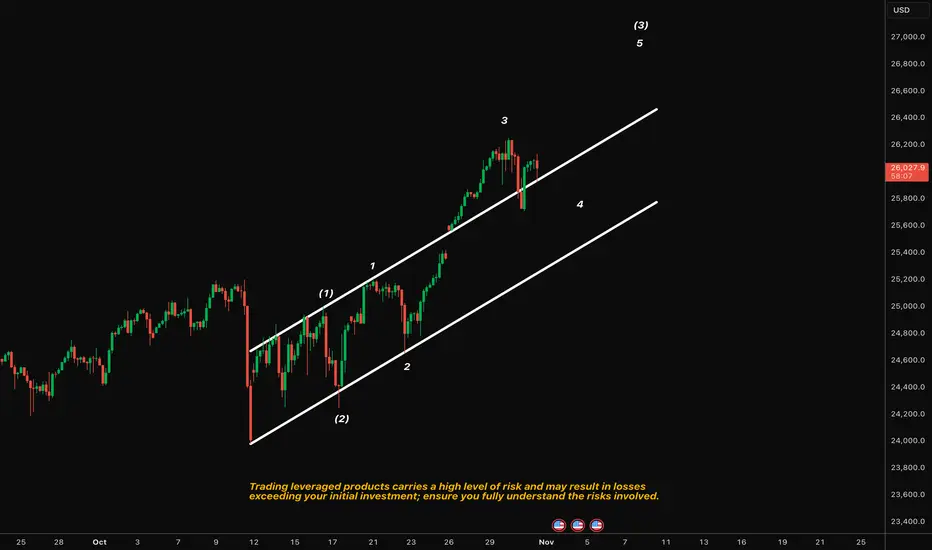
NASDAQ100 | Wave 4 Correction Within ChannelPrice has respected a clean ascending channel, completing a clear 1–2–3 wave sequence. We’re now seeing a corrective pullback that aligns with the wave 4 region — testing the midline support of the channel. As long as this structure holds, the broader wave (3) remains intact.
Scenarios:
Scenario A: If the lower channel and wave 4 region hold → potential continuation higher toward wave 5 and the upper boundary near 26,600–26,800.
Scenario B: If the channel support breaks → deeper correction likely toward 25,800 before any potential resumption of trend.
NAS100 Trade Set Up Nov 5 2025Price remains under bearish pressure as long as price respects this 4h FVG i will look for internal bearish structure on the 1m-5m to take sells to SSL/Asia lows

NDQ100 (15M) Bullish Analysis. (SMC)🧩 Market Context
After a strong bearish move marked by a 1H Fair Value Gap (FVG), the market started to show institutional accumulation.
A Change of Character (ChoCh) and a Break of Structure (BOS) confirm a shift to bullish momentum.
The identified Order Block (OB) acts as a key mitigation point supported by a well-defined support zone.
💥 Entry Idea
• Buy: 25,124
• Stop-Loss: 24,979
• Take-Profit: 25,530
• Risk/Reward: 1 : 2.6
After a Fake Out (bearish liquidity trap), price shows strong bullish reaction, indicating institutional intention to mitigate the OB and reach the Buy-Side Liquidity above.
📊 Technical Confirmations
• The SMA starts to act as a dynamic support.
• Rejection from the OB validates structure change.
• The target (25,530) aligns with a distribution zone and liquidity pool, perfect for partial or full take-profit exits.
🧭 Conclusion
Clean structure, strong institutional logic, and confluences in harmony.
This setup illustrates the accumulation → mitigation → distribution sequence, where the market sweeps liquidity before expanding upward.
A perfect example of professional market reading. 🚀
GOOD LUCK TRADERS 🦾🤓✌🏻

NDX - POTENTIAL PULLBACK IN PLAY - SHORT SHORT INTO LONGGood Morning,
Always trade with risk assessment in mind. You can lose money quickly without an exit strategy. I choose a 7% stop based on my risk.
We are looking for a .5% exhaustion gap into todays market to show initiation of the pullback.
Trade Safely
Enjoy!

NasdaqBullish nasdaq as price went to restest the strong demand zone ans respected the price zone. Now more bullish momentum expected till our initial resistance.

US100 Price is near a strong selling zone.
I expect a possible rejection from this level.
Targets are shown in the attached analysis.
This is not financial advice, just personal analysis.

why Us100 will Target 25800why Us100 will Target 25800
Order Flow Legs in 15 M Chart
Swing Low
CHOCH
FVG

NAS100 | Bearish Momentum Extends The Nasdaq 100 fell about 2.1% (~500 points) as projected, maintaining a bearish outlook while technology stocks continued to weigh on market sentiment.
Below 25,700: Bearish continuation towards 25,340 → 25,230 → 25,000.
Above 25,700: Short-term recovery towards 25,820 → 26,170.


bullish or bearish continuation Idea for todaygoing down
Based on 1 hour trend reversal
Im only writing this because trading view wants more of a description

Nasdaq NAS100 Bulls Regain Control: What I’m Watching Next📈 On the 4-hour NASDAQ chart, we can clearly see a break in structure to the upside, signaling strong bullish momentum entering the market. 🟩 The buyers are showing strength, and I’ll be looking to capitalize on this momentum — but only if we see a confirmed break of the current swing high, followed by a retracement into the retest zone. 🔁
However, patience is key. ⏳ I’ll only look to engage if today’s New York session data release aligns with and supports the bullish bias. Fundamentals and technicals must work together before I take a position.
As mentioned in the video, if the anticipated price action fails to materialize, we’ll simply abandon this setup and move on — staying disciplined is crucial. 🚫
⚠️ Disclaimer: This analysis is for educational purposes only and not financial advice.

Nasdaq 100 – A Quiet Accumulation Before the Next PushThe Nasdaq 100 (US100) is showing early signs of a structural rebalancing after the recent correction. Price is currently hovering near 25,600, retracing modestly after a short-term rebound from the 25,280 demand zone — a level where Smart Money seems to have re-entered quietly.
💭 1️⃣ Market Structure – A Story of Displacement and Repricing
The current chart reveals a clear Break of Structure (BOS) followed by a corrective pullback.
After the previous sell-off, price found support at the 25,280 – 25,300 range — a discount zone aligning with both an order block and a trendline confluence.
This zone likely served as institutional demand, where Smart Money began accumulating long positions before the upward displacement.
The recent retracement, however, remains within a corrective structure, meaning we could still see one more liquidity sweep before the market decides its next major leg.
🩶 2️⃣ Supply & Demand Zones – The Footprints of Institutions
Karina is currently tracking three zones that matter most to the structure:
Demand Zone:
25,280 – 25,300: The base of institutional accumulation and current structural support.
Supply Zones:
25,970 – 26,160: A major bearish order block where Smart Money previously distributed positions — likely the next liquidity target.
The most probable scenario: a retest of the lower demand → a liquidity grab → bullish displacement toward 25,970 – 26,160 → reversal back to equilibrium.
🧭 3️⃣ Liquidity Flow – The Path of Least Resistance
Above the current range lies buy-side liquidity resting at 26,000+, while below, sell-side liquidity has already been swept near 25,280.
This suggests that the next move could be an engineered push upward — designed to collect liquidity above 25,970 – 26,160 before potential continuation back into the demand zone.
Such a move would mirror the classic SMC liquidity cycle:
Accumulate → Displace → Manipulate → Distribute.
🌙 4️⃣ Trading Outlook – Patience Before Precision
Karina’s bias for the day is moderately bullish, anticipating a short-term expansion toward the upper liquidity pool.
However, she remains cautious — waiting for confirmation near the demand zone before entering long.
Buy Idea:
Entry: 25,280 – 25,300
Stop Loss: below 25,200
Target 1: 25,970
Target 2: 26,160
If the liquidity sweep at 26,160 completes, Karina expects a controlled retracement — a potential short setup back into equilibrium around 25,400.
🌷 5️⃣ Reflection – When the Market Whispers, Smart Money Listens
The chart right now feels calm, methodical — like the quiet before a decisive wave.
Smart Money rarely rushes. It absorbs, manipulates, and moves when most traders stop paying attention.
For Karina, this is one of those moments where patience becomes the most powerful strategy.
The next move will not be random — it will be precise, intentional, and elegant, just like the rhythm of liquidity itself 🌙
This analysis reflects Karina’s personal perspective and is not financial advice.
How do you see the US100’s next move? Is Smart Money gearing up for another liquidity sweep above 26k? Let’s discuss below 💬


NAS100 | US100 (Nasdaq 4H) – Technical OutlookUS100 (Nasdaq 4H) – Technical Outlook
📊 Market Structure:
Price has recently formed a weak high around 26,200, rejecting from a premium / supply zone, signaling potential short-term bearish pressure.
The previous upward structure showed a BOS (Break of Structure) near 25,000, confirming bullish intent earlier — but now momentum is slowing as price returns below the PDH (Previous Day High).
The current 4H candles show strong bearish reaction, indicating sellers defending the premium zone.
📉 Key Levels:
Supply Zone (Premium Area): 26,000 – 26,200
Equilibrium Zone: Around 24,800 – 25,000
Immediate Support: 25,800 (current PD level)
Weekly Pivot (PW): 25,400 (potential short-term target)
📈 EMA Confluence:
Price has rejected from above the 89 EMA (blue) and is now testing below it.
The 200 EMA (yellow) continues to trend upward, showing long-term bullish momentum, but the shorter EMAs suggest a short-term pullback.
As long as price stays below 89 EMA, bias remains bearish to neutral in the near term.
🎯 Trade Scenarios:
Scenario 1 – Short-Term Sell Setup:
Entry Zone: 25,950 – 26,100 (retest of premium area or EMA rejection)
Take Profit: 25,400 (PW)
Stop Loss: Above 26,250
Confluence: Supply zone + weak high + bearish EMA alignment
Scenario 2 – Bullish Continuation (after retracement):
Wait for price to retrace to the equilibrium zone (24,800–25,000)
Look for bullish reaction with confirmation from Stochastic RSI divergence
Target: Return to 26,000
📊 Indicators Insight:
Stochastic RSI: Currently dropping from overbought territory, indicating possible continuation of short-term downside.
Momentum slowing — ideal for short retracement trades before potential reversal.
Summary:
US100 is rejecting from premium resistance near 26,200.
Short-term bias: bearish retracement toward 25,400 or deeper 25,000 equilibrium zone.
Long-term bias remains bullish, supported by 200 EMA structure — watch for confirmation before re-entry buys.

Nasdaq bullish momentum continuesNasdaq bullish momentum continues. US economy and Technology stocks are fundamentally strong.

NAS100 H1 | Bullish Bounce off Key SupportNAS100 is falling towards our buy entry at 24,841, which is a swing low support level that aligns with the 161.8% Fibonacci extension level.
The stop loss is at 24,664, which is a swing low support level, while the take profit is at 25,102, which is a pullback resistance level.
Stratos Markets Limited (tradu.com/uk ):
CFDs are complex instruments and come with a high risk of losing money rapidly due to leverage. 68% of retail investor accounts lose money when trading CFDs with this provider. You should consider whether you understand how CFDs work and whether you can afford to take the high risk of losing your money.
Stratos Europe Ltd (tradu.com/eu ):
CFDs are complex instruments and come with a high risk of losing money rapidly due to leverage. 70% of retail investor accounts lose money when trading CFDs with this provider. You should consider whether you understand how CFDs work and whether you can afford to take the high risk of losing your money.
