Nasdaq 100 Awaits Breakout After Earnings ReactionUSNAS100 – Overview
On Thursday, the Nasdaq saw only slight moves as investors assessed Nvidia’s quarterly earnings. Price action is consolidating around a key support level.
Technical Outlook
If price holds above 23,560, bullish momentum remains in place, targeting 23,690 → 23,870.
A drop below 23,560 would keep the index range-bound between 23,560 – 23,435.
A confirmed breakdown requires a close below 23,435, which would signal bearish continuation.
Key Levels
Resistance: 23,560 – 23,435.
Support: 23,690 – 23,870.
Trade ideas


NAS100 H4 | Bearish Reversal off Pullback Resistance"NAS100 is rising towards the sell entry at 23,679.28, which is a pullback resistance and could reverse from this level ot the take profit.
Stop loss is at 23,939.64, which is a swing high resistance.
Take profit is at 23,292.38, which is a pullback support that alignss with the 50% Fibonacci retracement.
High Risk Investment Warning
Trading Forex/CFDs on margin carries a high level of risk and may not be suitable for all investors. Leverage can work against you.
Stratos Markets Limited (tradu.com ):
CFDs are complex instruments and come with a high risk of losing money rapidly due to leverage. 65% of retail investor accounts lose money when trading CFDs with this provider. You should consider whether you understand how CFDs work and whether you can afford to take the high risk of losing your money.
Stratos Europe Ltd (tradu.com ):
CFDs are complex instruments and come with a high risk of losing money rapidly due to leverage. 66% of retail investor accounts lose money when trading CFDs with this provider. You should consider whether you understand how CFDs work and whether you can afford to take the high risk of losing your money.
Stratos Global LLC (tradu.com ):
Losses can exceed deposits.
Please be advised that the information presented on TradingView is provided to Tradu (‘Company’, ‘we’) by a third-party provider (‘TFA Global Pte Ltd’). Please be reminded that you are solely responsible for the trading decisions on your account. There is a very high degree of risk involved in trading. Any information and/or content is intended entirely for research, educational and informational purposes only and does not constitute investment or consultation advice or investment strategy. The information is not tailored to the investment needs of any specific person and therefore does not involve a consideration of any of the investment objectives, financial situation or needs of any viewer that may receive it. Kindly also note that past performance is not a reliable indicator of future results. Actual results may differ materially from those anticipated in forward-looking or past performance statements. We assume no liability as to the accuracy or completeness of any of the information and/or content provided herein and the Company cannot be held responsible for any omission, mistake nor for any loss or damage including without limitation to any loss of profit which may arise from reliance on any information supplied by TFA Global Pte Ltd.
The speaker(s) is neither an employee, agent nor representative of Tradu and is therefore acting independently. The opinions given are their own, constitute general market commentary, and do not constitute the opinion or advice of Tradu or any form of personal or investment advice. Tradu neither endorses nor guarantees offerings of third-party speakers, nor is Tradu responsible for the content, veracity or opinions of third-party speakers, presenters or participants.

Nas100 market analysis #NAS100 technical analysis. Price has dropped down to our trend line in support levels. Price should continue to go up here back to resistance levels.

SHORT ON NAS100Using the 1h, 15m, and 5m bearish fvg the market need fill the gaps above 50% Fib range. Targeting the lows as the TPs

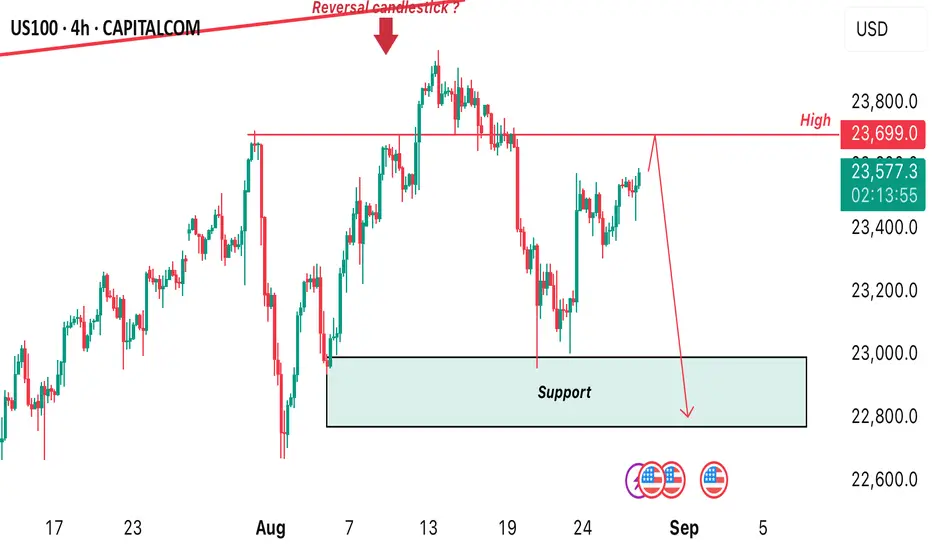
A POTENTIAL SELL IS EXPECTED TO OCCUR IN US100!!!I expect a potential decline in price of upto 3.5% from the price some of 23699.0. Technically, I can notice how price is gradually shifting in structure from intraday bullish to bearish! I expect price to decline significantly from that price zone. A sell opportunity is envisaged around that level of 23699.0
US100 – Elliott Wave Long-Term Outlook (Monthly)Key Points – US100 (Monthly, Elliott Wave)
🌐 Wave (1): Dot-com bubble peak (2000).
📉 Wave (2): Crash to 2002 lows.
🚀 Wave (3): Massive bull run (2009–2025), +4400%.
⚠️ Wave (4) – Expected Correction:
Possible 70–80% retracement.
Targets: 11,500 → 6,500 → 4,770–4,081.
📈 Wave (5) – Future Projection:
Potential long-term expansion toward 250,000+.
🔑 Levels to Watch:
Current support: 23,400.
Major resistance: 35,300.
Long-term target: 261,800

ict conceptsTrading foreign currencies can be a challenging and potentially profitable opportunity for investors. However, before deciding to participate in the Forex market, you should carefully consider your investment objectives, level of experience, and risk appetite. Most importantly, do not invest money you cannot afford to lose.
There is considerable exposure to risk in any foreign exchange transaction. Any transaction involving currencies involves risks including, but not limited to, the potential for changing political and/or economic conditions that may substantially affect the price or liquidity of a currency. Investments in foreign exchange speculation may also be susceptible to sharp rises and falls as the relevant market values fluctuate. The leveraged nature of Forex trading means that any market movement will have an equally proportional effect on your deposited funds. This may work against you as well as for you. Not only may investors get back less than they invested, but in the case of higher risk strategies, investors may lose the entirety of their investment. It is for this reason that when speculating in such markets it is advisable to use only risk capital.

watching 15m chartno news, we pushed pretty down just now. going to watch 1m for entry to short. if 1m close too high won't enter.
Same trade 2 days back, but yesterday was good.
if price goes up here, looking to short it to tp. or half way from 1m high and low.

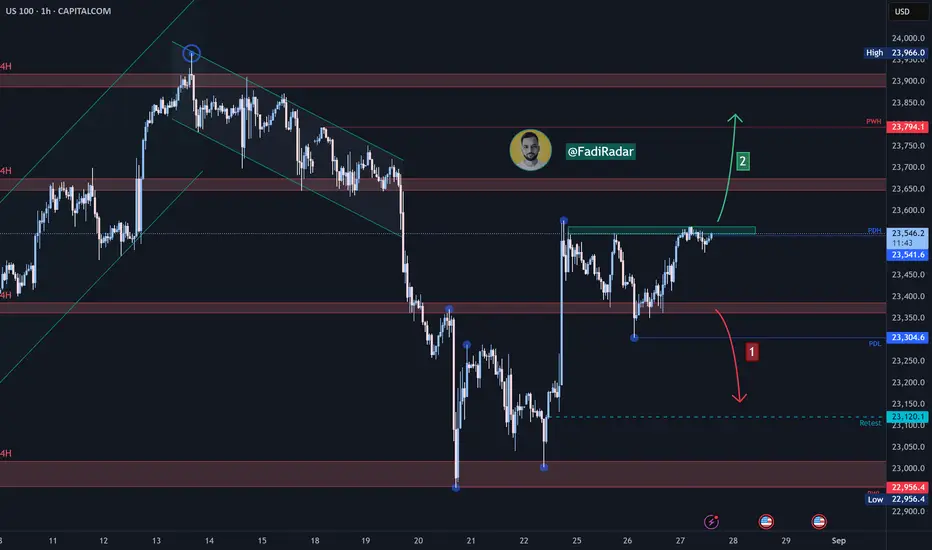
Nas100 Trade Set Up Aug 27 2025FX:NAS100
www.tradingview.com
Price is making HH/HL in the 1h and is currently at a 1H FVG so if price closes above 50% of the FVG i will look for a 1m-2m IFVG to target higher BSL levels but if price closes under 50% of the 1h FVG i will look for sells towards SSL or PDL

NAS100 - Potential TargetsDear Friends in Trading,
The red indicated resistance will need serious quality and momentum to be breached.
Firstly, wait for a clear breakout, re-test and hold (show demand) of PIVOT zone.
Take profits at or before resistance zones.
and/or
If PIVOT sends the price back down,
I will wait to see price react to previous demand or support areas.
Keynote:
Even though BIG TF BIAS is bullish, price can always correct deeper to collect liquidity.
I sincerely hope my point of view offers a valued insight.
Thank you for taking the time study my analysis.

Nasdaq to 23,050RECENT TRENDLINE, as you can see, is broken. Next stop is 23,050 to the recent major support, because economy cracks under Trump administration...good luck

Nasdaq 100 Rebounds From Pivot Ahead of Nvidia EarningsUSNAS100 – Overview
Bullish Momentum Ahead of Nvidia Earnings
The Nasdaq 100 reversed from its pivot line and is showing renewed bullish momentum ahead of Nvidia’s earnings — a potential key catalyst for the index.
🔹 Technical Outlook
As long as price trades above 23,525, the bullish trend remains intact, with upside potential toward 23,690 → 23,870.
✅ A confirmed 1H close above 23,690 would strengthen bullish momentum and open the way to higher levels.
⚠️ A 1H close below 23,525 would weaken sentiment, with downside targets at 23,430 → 23,295.
🔹 Key Levels
Pivot: 23,525
Resistance: 23,690 – 23,870
Support: 23,430 – 23,295
✅ Summary:
USNAS100 is holding bullish momentum above the pivot, with Nvidia earnings acting as a major driver. Watch 23,525 as the decision level — staying above supports the bullish case, while a break below shifts focus back to 23,430 and 23,295.

NASDAQ Index Analysis (US100 / NASDAQ)The index is currently trading near the resistance level of 23,550.
🔺 Bullish Scenario:
• A breakout and consolidation above 23,550 may support further upside toward 23,650 as the initial target, with a possible extension to 23,800 if momentum continues.
🔻 Bearish Scenario:
• If the price fails to break and hold above 23,550, it is likely to head towards 23,375, which is considered a potential rebound zone.
NSDQ100 ovrsold rebound supported at 23350US equities advanced, with the S&P 500 +0.41%, closing just shy of record highs, as solid US data offset Fed uncertainty. Conference Board consumer confidence (97.4 vs. 96.5 exp) and core capital goods orders (+1.1% vs. +0.2% exp) signaled resilience, while the Richmond Fed index (-7 vs. -11 exp) improved.
Focus today is Nvidia earnings, which could be pivotal for NASDAQ 100 given its AI leadership and sensitivity to US-China trade tensions. Asian tech strength overnight reflects bullish positioning ahead of results.
Meanwhile, hedge funds are running record shorts in VIX, betting on low volatility—an extreme stance that has historically preceded sharp market moves, something to watch around Nvidia’s release.
In the UK, BoE’s Mann argued for keeping rates high for longer, but impact is limited for US tech trading focus.
For NASDAQ 100: near-record highs, tech sentiment riding on Nvidia, but positioning risk in volatility markets could amplify any surprise.
Key Support and Resistance Levels
Resistance Level 1: 23700
Resistance Level 2: 23830
Resistance Level 3: 23920
Support Level 1: 23350
Support Level 2: 23250
Support Level 3: 23100
This communication is for informational purposes only and should not be viewed as any form of recommendation as to a particular course of action or as investment advice. It is not intended as an offer or solicitation for the purchase or sale of any financial instrument or as an official confirmation of any transaction. Opinions, estimates and assumptions expressed herein are made as of the date of this communication and are subject to change without notice. This communication has been prepared based upon information, including market prices, data and other information, believed to be reliable; however, Trade Nation does not warrant its completeness or accuracy. All market prices and market data contained in or attached to this communication are indicative and subject to change without notice.
