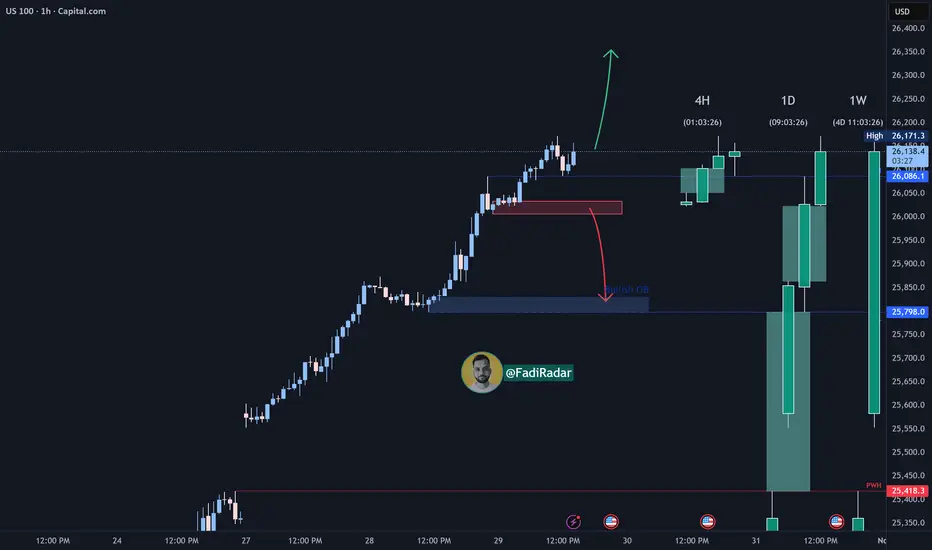
NASDAQ Index Analysis (US100)The NASDAQ index continues its strong bullish trend, currently trading near a new all-time high around 26,140.
📉 A minor correction is expected toward the 26,000 support zone.
If the price breaks and holds below this level, a further decline toward 25,800 is likely.
📈 However, if the price bounces from 26,000, the index may retest the recent high or even create a new record high.
💡 Key Trading Levels:
✅ Buy: On confirmed bounce from 26,000 or 25,800.
🔻 Sell: Below 26,000 after confirmation.
Trade ideas
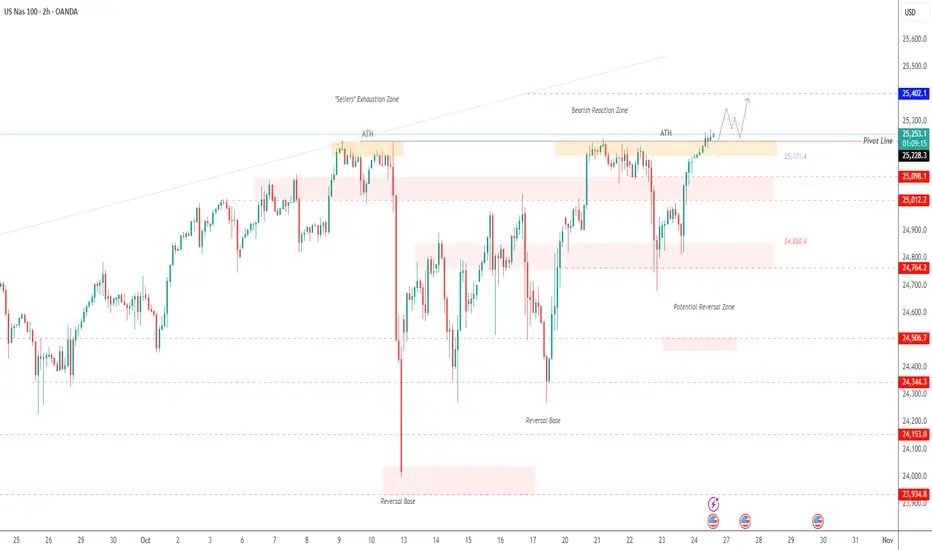
USNAS100 Extends Rally to New All-Time Highs?USNAS100 | Bullish Continuation Toward New Highs
The index recorded a new all-time high (ATH) and has already stabilized above it, supporting further bullish momentum toward 25,400 → 25,550.
The main driver behind the move remains strong corporate earnings.
However, to confirm a bearish reversal, the price must close a 1H candle below 25,170, which would expose 25,100 → 25,010.
A sustained break below those levels could extend the decline toward 24,850.
Pivot Line: 25,230
Resistance: 25,400 – 25,550
Support: 25,100 – 25,010 – 24,860
USNAS100 ForecastThe US100 chart shows strong bullish momentum, breaking above key resistance levels. Price is expected to retrace slightly toward the 25,750–25,500 support zone before resuming its upward move toward the 26,400–26,500 target area. Overall trend remains bullish with higher highs and higher lows formation.
"Thank you for your support! If you found this idea valuable or learned something new, please consider liking and leaving a comment. I’d really appreciate hearing your feedback and thoughts."

NasdaqHello traders! Last Friday, we had a major selloff in the 25,000 region, which quickly sent the Nasdaq crashing by more than 4% in just a few hours. In technical analysis, 24,000 is a price that has been broken previously and is now being tested as weekly support. If we expand this movement, we project a target price of 26,000, continuing the upward movement. The technology sector remains promising with advances in artificial intelligence, and we have no news of a Federal Reserve interest rate hike. Happy trading!

NAS100 ShortElite analysis
Both possibilities played out
Price liquidated NY high
Price reacted off of 4h structural liquidity
Targets lower liquidity pools

US100 MARKET OUTLOOK!Price continues to make new highs in NASDAQ100 we’re looking forward to seeing more bullish price action develop away from the current market price. We’re bullish in US100. A buy opportunity is envisaged.

US NAS 100Preferably suitable for scalping and accurate as long as you watch carefully the price action with the drawn areas.
With your likes and comments, you give me enough energy to provide the best analysis on an ongoing basis.
And if you needed any analysis that was not on the page, you can ask me with a comment or a personal message.
Enjoy Trading ;)

US100 Will Keep Growing!
HI,Traders !
#US100 made a bullish
Breakout of the key horizontal
Level of 177.327 and the
Breakout is confirmed so
We are bullish biased
And we will be expecting
A further bullish continuation !
Comment and subscribe to help us grow !

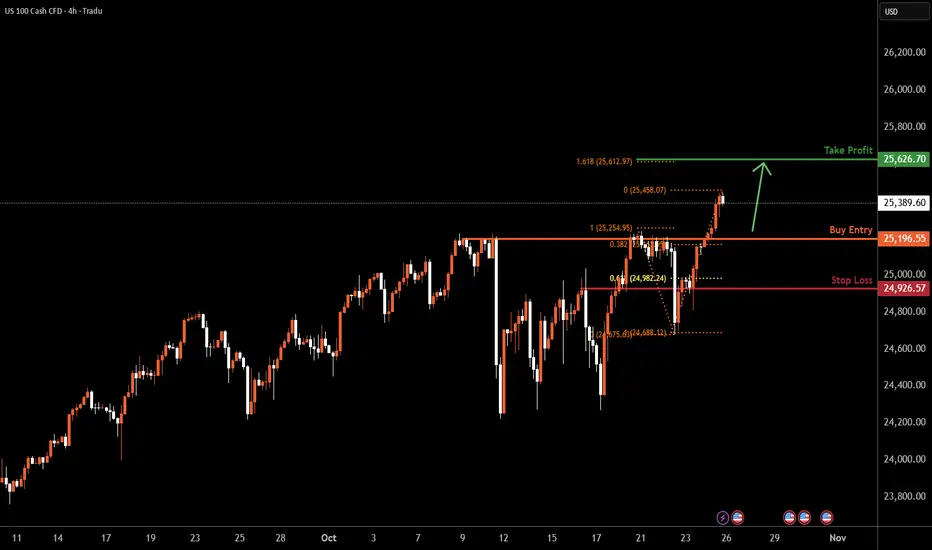
NAS100 | Bullish Momentum ExpectedBased on the H4 chart analysis, we could see the price fall to the buy entry at 25,196.55, which is a pullbakc support that lines up with the 38.2% Fibonacci retracement and could bounce from this level to the upside.
Stop loss is at 24,926.57, which is a pullback support that is slightly below the 61.8% Fibonacci retracement.
Take profit is at 25,626.70, which aligns with the 161.8% Fibonacci extension.
Stratos Markets Limited (tradu.com ):
CFDs are complex instruments and come with a high risk of losing money rapidly due to leverage. 68% of retail investor accounts lose money when trading CFDs with this provider. You should consider whether you understand how CFDs work and whether you can afford to take the high risk of losing your money.
Stratos Europe Ltd (tradu.com ):
CFDs are complex instruments and come with a high risk of losing money rapidly due to leverage. 70% of retail investor accounts lose money when trading CFDs with this provider. You should consider whether you understand how CFDs work and whether you can afford to take the high risk of losing your money.
Nasdaq100 Breakout Map – Bullish Targets Ahead?🕵️♂️ NDX/US100 “NASDAQ100” Market Wealth Strategy Map (Swing/Day Trade) 🚀
📊 Plan: Bullish Bias (Swing/Day Trade)
🎯 Entry Idea (Thief Layering Style):
Using a layering strategy (multiple limit orders). My preferred buy zones are:
🟢 24,300
🟢 24,400
🟢 24,500
🟢 24,600
(Feel free to adjust/add layers based on your own style — flexibility is key.)
🔒 Protective Stop (Thief SL):
❌ Around 24,000 (but note: this is just my map, you can manage risk as per your own plan).
💰 Target Area (Profit Zone):
🚧 25,500 = strong resistance barricade + overbought region + potential bull trap.
✅ My preferred exit: 25,400 (just before the “police barricade” 🚓).
⚠️ Note for Thief OG’s:
I’m not recommending to only follow my SL/TP. This is an educational trade map, not a fixed financial call. Adapt, adjust, and take profits your way.
🔑 Key Catalysts & Correlation Map:
Tech Sector Strength: US100 often mirrors mega-cap tech momentum ( NASDAQ:AAPL , NASDAQ:MSFT , NASDAQ:NVDA ).
Risk-On/Off Mood: Watch TVC:VIX — if fear spikes, layers may fill quicker.
Dollar Impact: TVC:DXY weakness often fuels NASDAQ:NDX upside.
Bond Yields: Higher yields = pressure on tech. Keep TVC:US10Y in your radar.
📌 Other Related Charts to Watch:
SP:SPX / CME_MINI:ES1! → Correlated US equity benchmark.
TVC:DXY → Inverse correlation (watch dollar moves).
TVC:VIX → Volatility indicator for risk sentiment.
BITSTAMP:BTCUSD → Risk sentiment cousin, moves with tech flows sometimes.
✨ “If you find value in my analysis, a 👍 and 🚀 boost is much appreciated — it helps me share more setups with the community!”
⚠️ Disclaimer:
This is a Thief Style Trading Strategy Map — created for fun, educational purposes, and market observation only. Not financial advice. Trade at your own risk, ladies & gentlemen. 🕵️♂️💸
#NASDAQ100 #NDX #US100 #SPX #Stocks #Indices #Trading #SwingTrade #DayTrade #LayeringStrategy #ThiefTrader

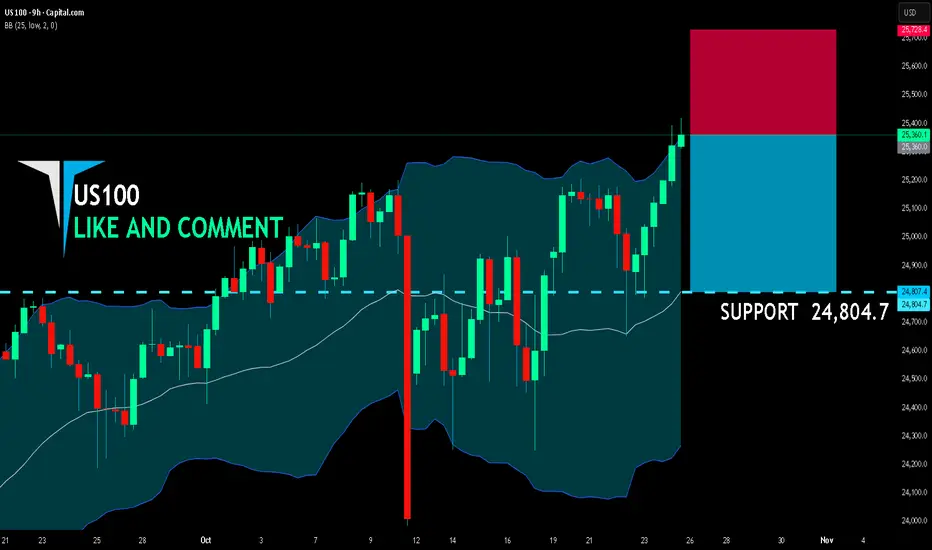
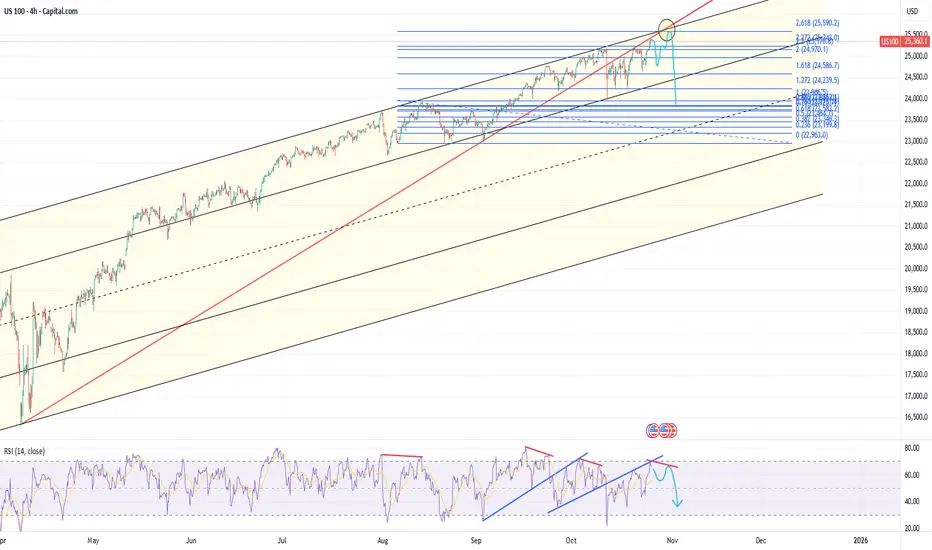
US100 SHORT FROM RESISTANCE
US100 SIGNAL
Trade Direction: short
Entry Level: 25,360.0
Target Level: 24,804.7
Stop Loss: 25,728.4
RISK PROFILE
Risk level: medium
Suggested risk: 1%
Timeframe: 9h
Disclosure: I am part of Trade Nation's Influencer program and receive a monthly fee for using their TradingView charts in my analysis.
✅LIKE AND COMMENT MY IDEAS✅
Pullback ideaNasdaq is at the trendline, channel and RSI resistances at the moment. We have 1D divergence on RSI, but no 4h divergence yet. Good pullbacks usually start with 4h divergence on NAS100 / 2h divergence on NDX, so it will probably go a little higher.
If it's going to form an ending diagonal, one more small pullback and one more wave up should appear, which will produce 4h divergence.
2.618 fib level from August 13 peak to low is at 25600 on NAS100 and at 25590 on NDX - maybe it will reach it, maybe not.
Nasdaq bullish moves on Roller Coaster Nasdaq bullish moves on Roller Coaster. It seems likes bulls & bears are confused.

NAS100 Why I'm Watching for a Countertrend Short on US100The NASDAQ (US100) has pushed aggressively into fresh all-time highs, tapping into a key liquidity zone where buy-side liquidity sits above previous swing highs. 📈💧
Price has extended without any meaningful pullback, suggesting we may soon see exhaustion and a corrective move. As we approach the end of the week, institutional traders often rebalance or close positions, which can trigger short-term retracements. 🏦🔄
If price breaks structure to the downside, I’ll be watching for a counter—
residing in a premium zone to—butter to the downside swings—for a potential countertrend—but—
🛑 Not financial advice. For educational purposes only.

Nasdaq Short: Peak Confirmed; Bear Market ConfirmedIt is now clear that the bull market ended on 30th Oct and that we have already seen the first completed wave down for Nasdaq that unfolded in clear 5-wave structure. The sub-waves also showed clear 5-wave structure themselves.
We are currently in a wave 2 retracement that is facing the first real support-turned-resistance. However, take note that wave 2 can technically go all the way up to the start of wave 1 without invalidating the idea. So look out for reversal signal or confirmation before you short.

NAS100 SELL SIGNALWait for price to reach AOI & wait for rejection. Go on lower timeframes to confirm CHOCH. Wait for a signal of sellers coming in (bearish engulfing - maybe) then enter SELLS.

Possible undercutIf this is an expanding ending diagonal, wave (4) can be considered complete. But according to fibs drawn from wave (1) beginning to top and wave (3) beginning to top one more undercut is possible to 0.76-0.786 and 0.86-0.886 area intersaction at VWAP from August 2 low. Shorting from here is risky, but that area may be a good spot to buy.

NAS100 - BullishNAS100 is bullish on 4H timeframe is currently bouncing from trendline support. Buying at current market price.

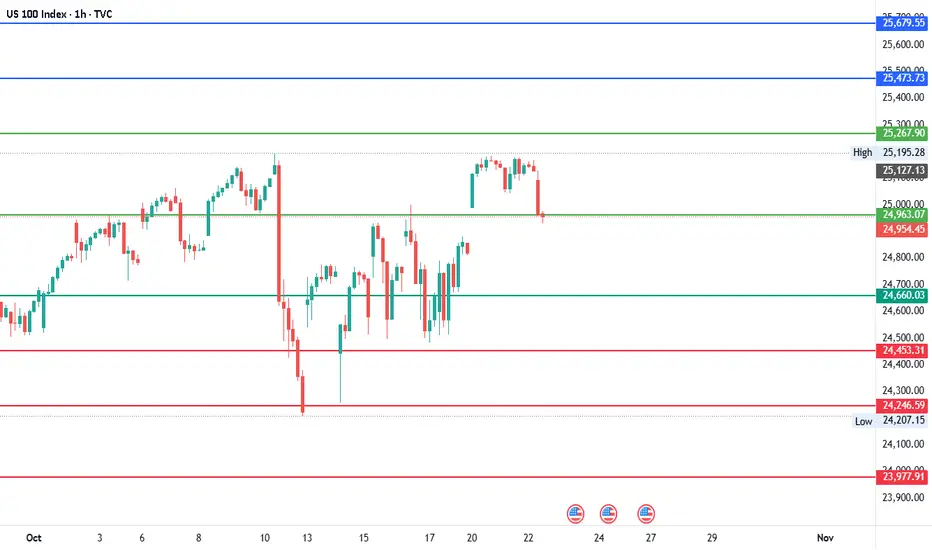
#NDQ - Short-term Range $26,216 - $23,709 | 1000 Points Move?Date: 22-10-2025
#NDQ - Current Price: $24,963.00
Pivot Point: $24,963.07 Support: $24,660.03 Resistance: $25,267.90
Upside Levels:
L1: $25,473.73 L2: $25,679.55 L3: $25,948.23 L4: $26,216.91
Downside Levels:
L1: $24,453.31 L2: $24,246.59 L3: $23,977.91 L4: $23,709.23
#TradingView #Nifty #BankNifty #DJI #NDQ #SENSEX #DAX #USOIL #GOLD #SILVER
NAS100 1500 pips secured!Set up played out perfectly, breaking structure to during London session, sweep BSL, followed by internal IFVG to target 1500 pips

Nasdaq Swing bullish setup4 hour
fibonacci Retracement 50% and 60%
1 hour
Wait for trend reversal
RRR 1:3 and hold for 1:5

NASDAQ 100-15m Bullish Setup/RiskyChartStructure Breakdown:
Liquidity Sweep: The equal lows taken out near 25,050 indicate engineered liquidity collection.
Displacement: Bullish impulse broke short-term structure, confirming buyers stepping in.
Fair Value Gap (FVG): The shaded blue zone marks the imbalance target where price may rebalance before deciding next direction.
Target Zone: 25,420–25,450 (FVG midpoint / supply area)
Invalidation: A clean 15m close below 25,050 would invalidate bullish bias.
Setup Type: Liquidity Sweep + Displacement + FVG Target
Entry Idea: Buy within the discount range (gray zone) after bullish confirmation
Take Profit: 25,420
Stop Loss: Below 25,050
Risk–Reward: ≈ 1:3 potential

NAS100 H4 | Bearish Reaction off FVGNAS100 is now rising towards our sell entry at 25,883, which aligns with the H4 Fair Value Gap and 71% Fibonacci retracement. We shall see how price reacts to this area after it breaks through the previous 2 swing high resistance levels.
The stop loss is at 26,167, which is a swing high resistance level, while the take profit is at 25,313, which is a swing low support level.
Once price reacts bearishly, do take note of the above swing low support level at 25,581 as well.
Stratos Markets Limited (tradu.com/uk ):
CFDs are complex instruments and come with a high risk of losing money rapidly due to leverage. 68% of retail investor accounts lose money when trading CFDs with this provider. You should consider whether you understand how CFDs work and whether you can afford to take the high risk of losing your money.
Stratos Europe Ltd (tradu.com/eu ):
CFDs are complex instruments and come with a high risk of losing money rapidly due to leverage. 70% of retail investor accounts lose money when trading CFDs with this provider. You should consider whether you understand how CFDs work and whether you can afford to take the high risk of losing your money.
