Can the Dow Jones Continue Its Bullish Momentum This Week?🚀 US30/DJI Dow Jones - Bullish Pullback Opportunity 📈
Professional Market Blueprint | Swing Trade Setup
📊 TRADE OVERVIEW
Asset: US30/DJI - Dow Jones Industrial Average Index
Timeframe: Swing Trade (4H-Daily)
Bias: 🟢 BULLISH - Hull MA Pullback Strategy
Confirmation: Heikin Ashi Reversal Candle Pattern
🎯 ENTRY STRATEGY - "LAYERING METHOD" 🎯
Approach: Multiple limit orders (Professional Risk Distribution)
Layer Entry Points:
Layer 1: 46,600 🔵
Layer 2: 46,800 🔵
Layer 3: 47,000 🔵
Layer 4: 47,200 🔵
💡 Tip: Adjust additional layers based on your risk tolerance and account size
🛑 RISK MANAGEMENT
Stop Loss: 46,400
⚠️ DISCLAIMER: This is a reference level only. You manage your own risk. Adjust SL according to your strategy and risk profile.
Take Profit Target: 48,800
📌 Rationale: Moving Average resistance + Overbought zone + Trap detection
⚠️ DISCLAIMER: This is a reference level only. You manage your own risk. Take profits at your own discretion.
📈 TECHNICAL CONFLUENCE
✅ Hull Moving Average - Bullish alignment & pullback structure
✅ Heikin Ashi Reversal - Confirmation candle pattern at entry zones
✅ Moving Average Resistance - Strong rejection level near TP
✅ Overbought Divergence - Potential trap for trap traders
✅ Risk/Reward Ratio - Favorable 1:3+ setup potential
🔗 RELATED PAIRS TO WATCH - CORRELATION ANALYSIS
📍 AMEX:SPY - S&P 500 ETF (Positive Correlation - 0.92)
US30 follows broad market sentiment. SPY strength = DJI bullish momentum.
📍 NASDAQ:QQQ - Nasdaq-100 ETF (Positive Correlation - 0.85)
Tech sector performance impacts overall market. Monitor for divergence signals.
📍 AMEX:IWM - Russell 2000 (Small Cap) (Positive Correlation - 0.88)
Small-cap rotations precede index moves. Early trend confirmation signal.
📍 AMEX:GLD - Gold Spot Price (Inverse Correlation - -0.45)
Risk-on sentiment (bullish DJI) = weaker gold. Inverse hedge setup.
📍 TVC:VIX - Volatility Index (Inverse Correlation - -0.70)
Rising VIX = market fear = DJI pullback risk. Monitor at entry zones.
📍 TVC:US10Y Yield (Negative Correlation - -0.55)
Rising yields pressure equities. Check yield strength before entries.
📍 TVC:DXY - US Dollar Index (Weak Negative - -0.30)
Stronger dollar = export headwinds. Minor impact, secondary indicator.
⚡ KEY TRADING RULES
🔴 BEFORE ENTRY:
Confirm Hull MA slope is positive
Wait for Heikin Ashi reversal candle close
Check VIX & SPY alignment
Ensure no major economic events
🟢 AT ENTRY:
Use layering strategy (don't chase)
Build position gradually across 4 layers
Scale risk based on account size
Document entry price & time
🟡 DURING TRADE:
Trail stop loss after +1% profit
Monitor related pairs for divergence
Close 50% at +2% for risk-free trade
Let remainder run to target
🔵 EXIT PLAN:
Target: 48,800 (reference level)
Or: Exit on Heikin Ashi reversal signal
Or: Close on MA resistance rejection
Never hold into major news events
Trade ideas

Dow Jones Near resistance Dow Jones near resistance at $47,850, if fail to breakout then another round of sell off possible.

US30 Trade Set Up Nov 27 2025Price remains overall bullish but we did break structure to the downside on the 1h in London session so i will be looking for BSL sweep of London or Asia highs followed but internal 1m-5m IFVG/CISD to target 50% of 4h FVG and PDL


Long on Dow, expecting new highs-Dow formed bellow an inverse head and shoulders pattern, after a deep correction waiting for new highs on It

Low Liquidity Alert – Thanksgiving WeekDuring Thanksgiving, market liquidity drops sharply.
When volume is low:
Markets move erratically
Stop hunts become more frequent
Price structure loses reliability
📌 Tip: Avoid entering heavy positions until the market returns to normal volume.
Sometimes the best trade is no trade.
As predicted yesterday, the market has just reached my zone and reacted perfectly.
We saw a bullish move from 45,754 up to 47,566, exactly in line with the projection.
After this leg up, I expect the market to go through a normal correction and then continue its upward movement.
Structure is still bullish — every dip remains a potential continuation setup.
US30 – Fake Breakout Reversal Toward 48,500 $From my market view the US30 made a fake breakout above my resistance zone
This liquidity grab trapped sellers before price quickly bounced back upward showing that buyers still control the trend
At this point I expect the market to continue pushing higher toward the 48500 $ which represents
As long as price remains above the fake-breakout zone, the bullish scenario remains valid

US30 Trade Set Up Nov 26 2025Price remains in a bullish trend in the 1h so as long as price keeps making HL i will want to see a retest of 1h IFVG or internal SSL to then make 1m-5m IFVG/CISD to continue to fill the daily FVG and sweep BSL

DOW JONES Inverse Head and Shoulders formed. Bullish.Last week (November 19, see chart below), we caught the very bottom of the 6-month Channel Up on the 1D MA100 (green trend-line) of Dow Jones (DJI):
This time we view the price action using the 4H time-frame, where we can see that an Inverse Head and Shoulders has been formed, with its Head being the 1D MA100 bottom.
If more aggressive, it may not follow the typical green Bullish Leg of the Channel Up but the Target remains almost the same at 48900. That is the 2.0 Fibonacci extension. Typically we should see the 4H MA50 (blue trend-line) turning into the Support until the very top.
---
** Please LIKE 👍, FOLLOW ✅, SHARE 🙌 and COMMENT ✍ if you enjoy this idea! Also share your ideas and charts in the comments section below! This is best way to keep it relevant, support us, keep the content here free and allow the idea to reach as many people as possible. **
---
💸💸💸💸💸💸
👇 👇 👇 👇 👇 👇

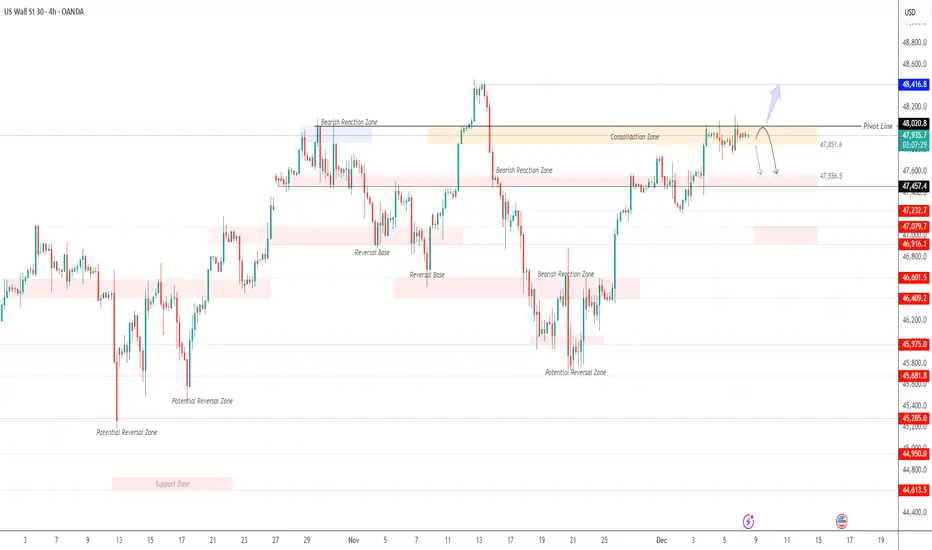
US30: Low Volatility Ahead — Watching 47460 for DirectionOANDA:US30USD pushed up exactly as expected—about 350 points.
Today and tomorrow are expected to remain low-volatility, low-liquidity sessions due to the Thanksgiving holiday in the U.S., which may limit strong directional moves.
Technical Outlook
As long as the price trades below 47460, US30 may continue a bearish correction toward 47240 and 47080.
However, if the market reverses and closes a 1H or 4H candle above 47560, this will signal a continuation of the bullish trend, targeting 47860.
Pivot Line: 47560
Support: 47240 · 47080
Resistance: 47710 · 47860
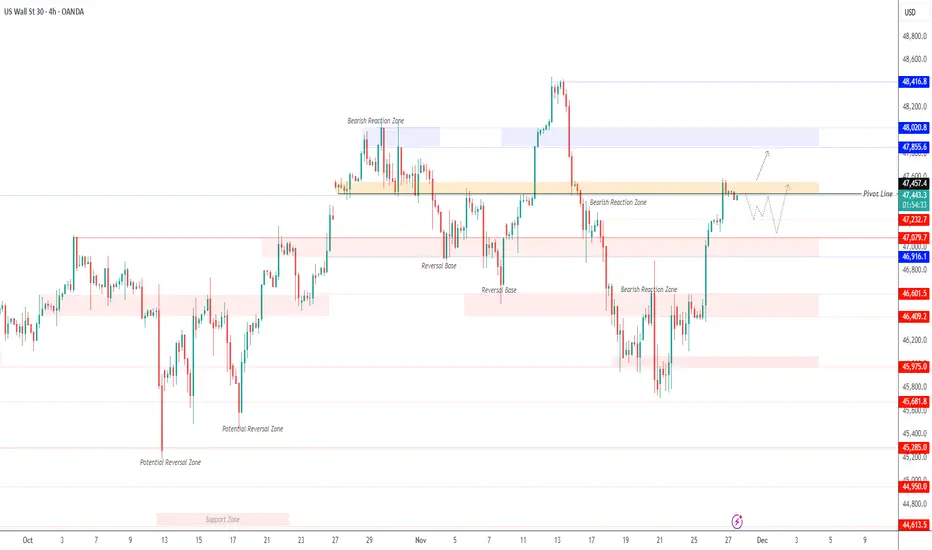
DOW JONES (US30): Pullback From Trend Line
US30 is testing a recently broken solid rising trend line
on a daily time frame.
I believe that odds are high that the market will retrace from that.
We can expect a pullback to 47300
❤️Please, support my work with like, thank you!❤️
I am part of Trade Nation's Influencer program and receive a monthly fee for using their TradingView charts in my analysis.

US30 Trade Secured 1500 PipsSet up played out perfectly, sweeping SSL/Asia Lows, engulfed on the 5m-15m to push higher to -4.25/-4.5 fib

Head & Shoulder forming to drive US30 downI trade support and resistance levels drawn from line charts and watch price action at these level depending on market direction with other confluence such as EMA,SMA,RSI and simple candle stick patterns.
Market is current bearish with minor pull back from previous drop, currently accumulating and should buy up to 46800-47000 which is current celling/resistance level and also looking to form a head and shoulder pattern.
I believe we should see a retest of Friday OCT 10 low and more soon.

DowJones oversold bounce reaching resistance at 47648Key Support and Resistance Levels
Resistance Level 1: 47648
Resistance Level 2: 47830
Resistance Level 3: 48000
Support Level 1: 47130
Support Level 2: 47000
Support Level 3: 46867
This communication is for informational purposes only and should not be viewed as any form of recommendation as to a particular course of action or as investment advice. It is not intended as an offer or solicitation for the purchase or sale of any financial instrument or as an official confirmation of any transaction. Opinions, estimates and assumptions expressed herein are made as of the date of this communication and are subject to change without notice. This communication has been prepared based upon information, including market prices, data and other information, believed to be reliable; however, Trade Nation does not warrant its completeness or accuracy. All market prices and market data contained in or attached to this communication are indicative and subject to change without notice.

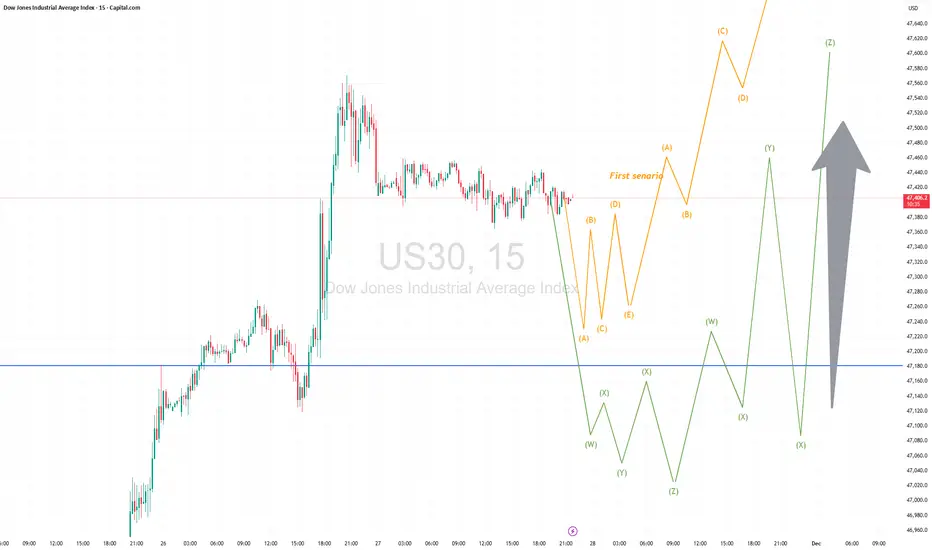
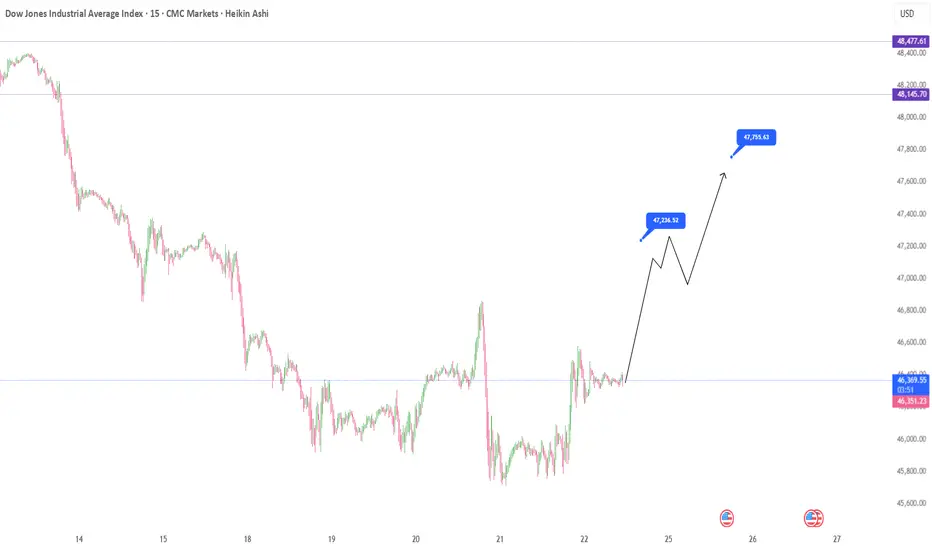
Dow Jones Geometry Signals an Explosive Move to ATHAfter the recent corrective move on the Dow Jones, the market structure remains firmly bullish.
From here, I expect momentum to resume and push toward a new **All-Time High**.
The geometry of the chart is perfectly aligned with this scenario.
Stay tuned for the next setup.

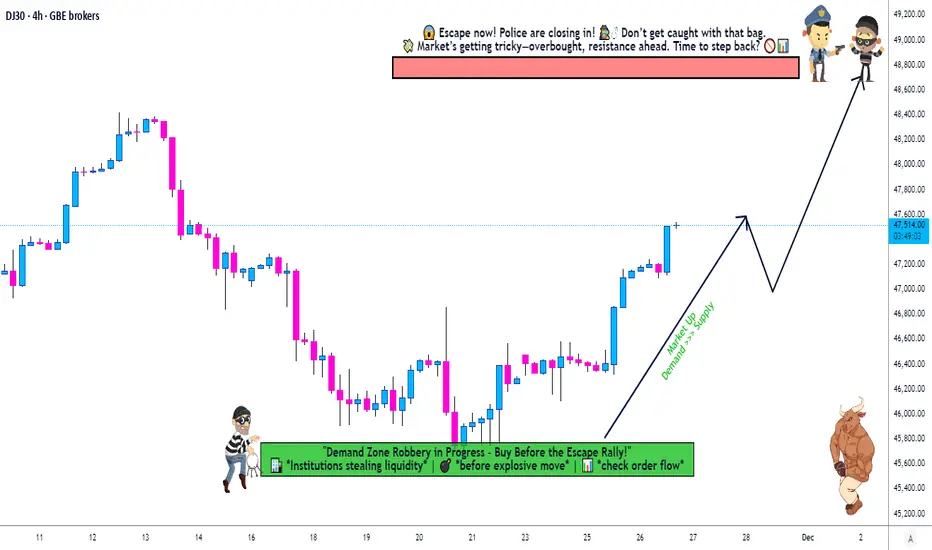
Is US30 Setting Up a Major Bullish Reversal? Layer Plan Inside🚀 US30 BULLISH SWING LAYER STRATEGY | "The Thief" Entries 🚀
BROTHERS & SISTERS OF THE MARKET! 👋 Welcome back, Thief OG's! 🦸♂️🦸♀️ A powerful Bullish setup is forming on the US30 (DOW JONES), and I'm sharing my layered entry plan to strategically position for the next leg up.
📈 Asset: US30 (Dow Jones Industrial Average)
⚡ Bias: Bullish | Style: Swing Trade
🎯 The Strategic Plan (The "Thief" Method)
This isn't a gamble; it's a calculated siege. We use a "Thief" Layering Strategy to scale into the position, reducing average entry cost and managing risk. We don't chase price; we let price come to us!
⚔️ Trade Execution Details
✅ ENTRIES (Buy Limit Layers):
We are setting multiple buy orders at key support levels. This is the core of the "Thief" method:
▶️ Layer 1: 46,400
▶️ Layer 2: 46,600
▶️ Layer 3: 46,800
▶️ Layer 4: 47,000
💡 Pro Tip: You can INCREASE or ADJUST these layers based on your capital and risk appetite.
❌ STOP LOSS (RISK MANAGEMENT):
A consolidated stop loss is placed below a major support zone to protect our capital.
➡️ SL: 46,200 (or lower based on your personal risk tolerance)
⚠️ Disclaimer (PLEASE READ): I am NOT a financial advisor. This SL is a suggestion. You MUST adjust your Stop Loss based on your own risk management strategy. Protect your capital at all costs!
🎯 PROFIT TARGET:
We are targeting a significant resistance zone where the market might see a pullback.
🎯 TP: 48,800
Rationale: This area aligns with a confluence of factors including Moving Average resistance and a potential overbought trap. The goal is to "escape with profits" before a potential reversal.
🤑 Take Note: You are free to take profits earlier! If you're in profit, you can never be wrong for taking money off the table.
🔍 Market Analysis & Key Drivers
Bullish Structure: The overall trend structure on higher timeframes remains intact.
Layered Advantage: This strategy smooths out the entry, preventing a single, potentially poor, entry point.
Risk Defined: Our maximum risk is clearly defined from the start.
🌐 Related Pairs & Correlations to Watch
Diversify your view! The US30 doesn't move in a vacuum. Keep these key assets on your watchlist:
SP:SPX (S&P 500): 🟢 High Positive Correlation. The SPX is the broader market leader. A strong SPX often pulls the DOW higher. This is your #1 confirmation.
NASDAQ:NDX (Nasdaq 100): 🟢 Positive Correlation. Tech strength can fuel overall market sentiment, but watch for divergence.
TVC:DXY (US Dollar Index): 🔴 Generally Inverse Correlation. A strengthening dollar can be a headwind for US equities. If DXY rallies sharply, be cautious.
/ES (S&P 500 Futures): 🟢 High Positive Correlation. Tracks the SPX almost tick-for-tick. Great for real-time sentiment.
✅ Conclusion
This "Thief" layered strategy provides a disciplined, low-stress approach to catching a potential US30 upswing. Remember, the market is about probabilities, not certainties.
👑 Your Capital, Your Rules. Trade Safe!
📌 Hashtags for Maximum Visibility:
#TradingView #US30 #DOW #TradingStrategy #SwingTrading #Stocks #Investing #Finance #Bullish #LayerStrategy #RiskManagement #ThiefStrategy #MarketAnalysis #SPX #DXY
👉 LIKE & FOLLOW if you found this idea helpful! Your support keeps the research coming! 💪
US30: Rebound Extends as Markets Eye December Rate CutUS30 | Technical Overview
U.S. indices look ready to extend Friday’s strong rebound as investor sentiment improves, with markets increasingly expecting a Fed rate cut in December.
Meanwhile, geopolitical headlines continue to develop, as the U.S. and Ukraine work on a “refined peace framework” aimed at progressing negotiations with Russia.
Technical Outlook
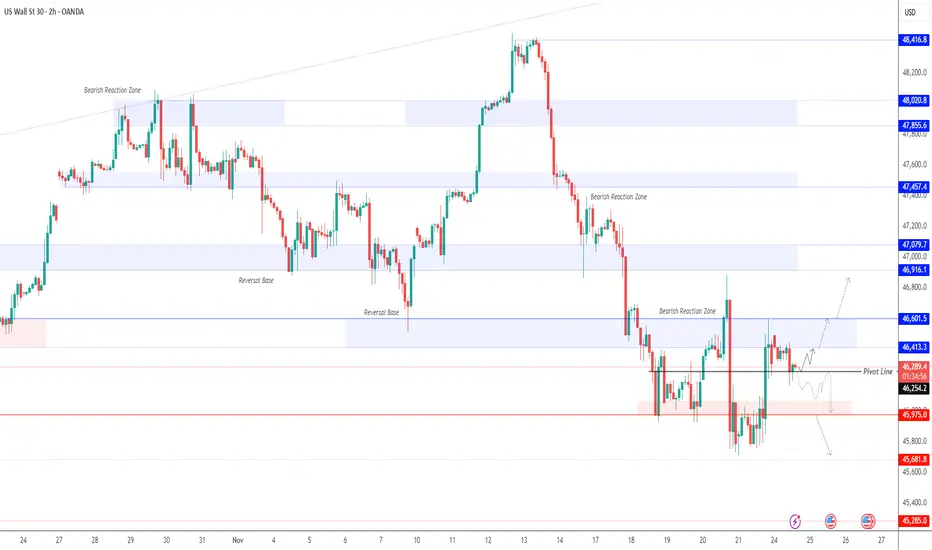
US30 currently maintains a bullish momentum as long as the price trades above the 46260 pivot line.
Holding above this level supports a continuation toward 46410, followed by 46600.
A 1H or 4H close below 46260 will activate bearish pressure, targeting 45975, and possibly lower if selling momentum strengthens.
Overall, the index still shows bullish pressure under current market conditions.
Key Levels
Pivot Line: 46260
Resistance: 46410 · 46600 · 46910
Support: 46000 · 45680
US30 DOW JONES at Resistance: Here's My Trade PlanI'm keeping a close eye on US30 right now. The market has pushed into a clean bullish breakout, printing higher highs and higher lows across both the H4 and H1 timeframes. 🚀
At the moment, price is overextended and tapping into a significant resistance zone, suggesting that a retracement is likely. Some aggressive traders may look for a counter-trend short, but that comes with elevated risk. ⚠️
Personally, I’m waiting for a healthy pullback, followed by a bullish break of structure to confirm a trend continuation setup. That’s where the higher-probability opportunity may unfold. ✔️
Not financial advice — for educational purposes only.

UTurn US30Support levels from pivot points and multiple moving averages create a technical base that reduces downside risk in the short term.
Volume remains steady, which confirms the reliability of the ongoing trend.
These combined technical factors typically precede price appreciation in the Nasdaq 100 , suggesting the index will likely continue to Declineshortly based on trend-following and momentum-based trading strategies with limited immediate overbought risk.

US30 Technical Breakdown – 11/25/2025📍 US30 Technical Breakdown – 11/25/2025
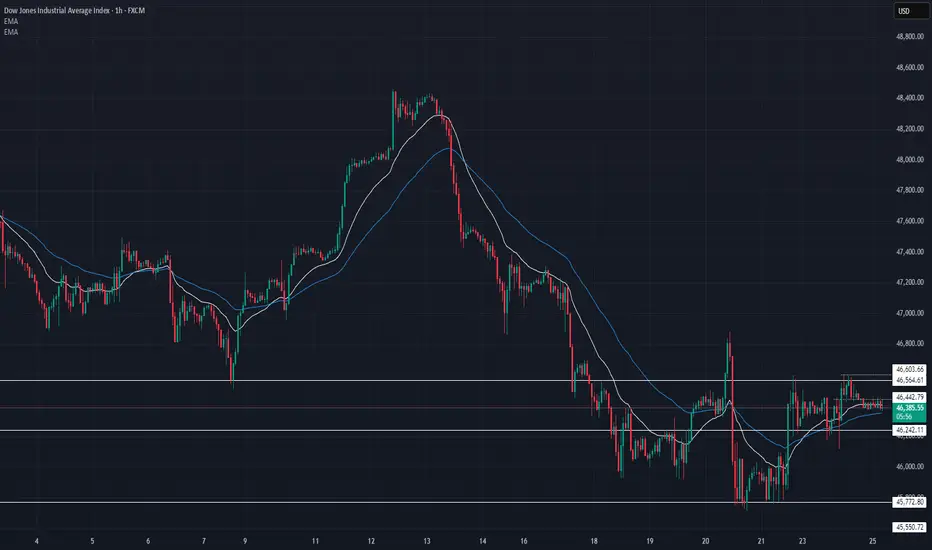
US30 continues to grind sideways after rejecting the 46,600 resistance zone, with price still stuck between key supply and demand levels. Short-term structure is choppy, but bears maintain slight control as long as price sits below the 46,600–46,700 ceiling 📉. Buyers are defending 46,200–46,000, creating a tightening range that’s likely to break soon.
📊 Market Behavior:
🔹 Price rejecting 46,600 multiple times clear intraday supply
🔹 EMAs flattening → momentum weak, indecision building
🔹 Buyers holding 46,200 but failing to break above mid-range
📌 Key Levels:
🔹 Resistance:
46,565 → current rejection zone
46,600–46,700 → major supply & breakout trigger
🔹 Support:
46,240 → intraday support
46,000 → structure demand
45,772 → deeper liquidity zone
🧠 Bias:
Neutral-to-bearish while below 46,600 ❗️
📈 Break + close above 46,600 → opens path to 46,900–47,100
📉 Break below 46,240 → exposes 46,000 and 45,770 liquidity
US30 LONG IDEAOverall trend is bullish so why not grabbing the nice bullish continuation opportunity
US30 in Start of WeekAfter ranging in Asian session, expect bullish movement to 46,800 levels starting with London session.
US30 | Markets Brace for Fed Rate Cut DecisionUS30 – Technical Overview
Wall Street futures edged higher on Monday as traders prepared for one of the most closely watched—and divisive—Federal Reserve meetings in recent years.
Markets widely expect the Fed to deliver its long-awaited interest rate cut this week.
Last week’s delayed data showed moderate growth in consumer spending late in Q3, further boosting confidence that policymakers may prioritize supporting the labor market and reducing borrowing costs.
Technical Analysis
US30 continues to trade below 48020, indicating that bearish momentum remains in control.
As long as price stays under this level, the index is expected to move toward 47770 and 47460, with 47560 acting as an intermediate support.
A bullish reversal requires a 1H candle close above 48020, which would confirm a shift in momentum and open the way toward 48410 and potentially the ATH region.
Key Levels
Pivot Line: 48020
Support: 47770 · 47560 · 47460
Resistance: 48300 · 48410