Bull runWe are looking at taking out the Highs of the HTF this is a long term trade idea as we can see the US INDICES at their all-time highs this what is expected from this pair as well.
Trade ideas

Bearish Momentum Building on GER40 – Continuation or Trap?🦹♂️ GERMANY 40 (GER40) — Smart Money Flow Blueprint 💰 | Bearish Swing Setup
🧭 Market Context
Hey Thief OGs & market heroes 🧙♂️,
Welcome to another precision strike setup on the 🇩🇪 GERMANY 40 Index (GER40).
The price action has triggered a Triangular Moving Average (382) breakdown —
confirming a bearish money-flow shift below dynamic support.
Let’s decode the play 👇
📉 Trade Blueprint (Swing Trade Plan)
🧩 Structure: Bearish bias confirmed ✅
⚡ Trigger: TMA-382 breakout below dynamic support
🎯 Strategy: Layered Sell Limit Entries (Thief-style entry stacking)
💸 Entry Layers:
🧱 24 100 • 💀 24 050 • 🎯 24 000
(You can add more layers based on your own risk appetite)
🛑 Stop-Loss: 🔐 Thief’s SL @ 24 250
🎯 Take-Profit Target: 💰 23 700 → dynamic support + oversold trap zone
💡 Thief Strategy Notes
“Layer it like a pro, exit like a ghost 👻”
• Multiple sell-limit layers help you catch volatility with precision ⚙️
• TMA serves as a dynamic moving structure – not a static line.
• Breakdown of support = momentum shift confirmed 🔻
• Clear risk/reward logic – structured SL & TP = disciplined flow 🎯
• Bearish bias remains intact while price holds under 24 100
🔍 Correlation Radar & Related Pairs to Watch
Stay alert to cross-market clues 🧠
🔗 Correlation Asset Key Observation
🇺🇸 US30 (Dow Jones) Often mirrors GER40 momentum — if Dow dips, GER40 tends to follow.
🇬🇧 FTSE100 European equity sentiment confirmation — weakness = bearish confidence boost.
💶 EUR/USD Strong Euro = export pressure → GER40 downside bias continuation.
🧠 Why This Setup Makes Sense
• TMA 382 breakout = momentum confirmation 📉
• Dynamic support break = structure shift 🔄
• Layered entries = better average fill 🔂
• SL = clear risk • TP = logical oversold zone 🎯
• Cross-asset watchlist keeps you aligned with global money flow 🌍
⚠️ Risk & Personal Choice
Dear Ladies & Gentlemen (Thief OGs) —
I’m not recommending you copy my stop-loss or take-profit.
They’re purely my levels for analysis reference only.
Trade responsibly. You make the call, you take the bag or the gold 💼✨
🧾 Quick Recap
🦹♂️ Strategy: Multi-Sell-Limit Layering
📉 Bias: Bearish below 24 100
💣 Entries: 24 100 • 24 050 • 24 000
🛑 Stop: 24 250
🎯 Target: 23 700
🧭 Setup Type: TMA Breakout + Dynamic Support Breakdown
🌍 Correlation Focus: US30 • FTSE100 • EUR/USD
✨ “If you find value in my analysis, a 👍 and 🚀 boost is much appreciated — it helps me share more setups with the community!”
#GER40 #Germany40 #DAX #Indices #BearishSetup #SwingTrade #SmartMoney #LayeringStrategy #ThiefTrader #MarketFlow #TMA #PriceAction #TechnicalAnalysis #TradingView #ChartSetup #RiskManagement

Buy Dax at supportRisking 100 points in DAX for a 250 points swing up over the weekend.Buying at support in what looks like a range bound market.
DAX sideways consolidation ahead of ECB rate decision. The DAX remains in a bullish trend, with recent price action indicating a potential overbought pullback within the broader uptrend.
Support Zone: 23970 – a key level from previous consolidation. Price is currently testing or approaching this level.
A bullish rebound from 23970 would confirm ongoing upside momentum, with potential targets at:
24490 – initial resistance
24580 – psychological and structural level
24770 – extended resistance on the longer-term chart
Bearish Scenario:
A confirmed break and daily close below 23970 would weaken the bullish outlook and suggest deeper downside risk toward:
23870 – minor support
23770 – stronger support and potential demand zone
Outlook:
Bullish bias remains intact while the Dax40 holds above 23970. A sustained break below this level could shift momentum to the downside in the short term.
This communication is for informational purposes only and should not be viewed as any form of recommendation as to a particular course of action or as investment advice. It is not intended as an offer or solicitation for the purchase or sale of any financial instrument or as an official confirmation of any transaction. Opinions, estimates and assumptions expressed herein are made as of the date of this communication and are subject to change without notice. This communication has been prepared based upon information, including market prices, data and other information, believed to be reliable; however, Trade Nation does not warrant its completeness or accuracy. All market prices and market data contained in or attached to this communication are indicative and subject to change without notice.

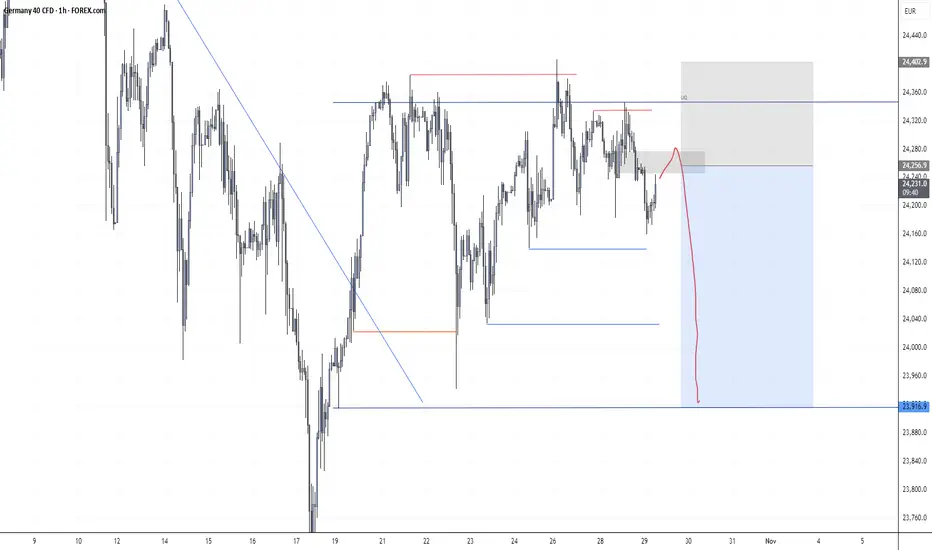
GER40(DAX)-1H SHORT Setup/RiskyChartLiquidity Grab: The recent sweep above internal liquidity failed to continue higher, indicating buy-side exhaustion.
Bearish Rejection Zone: The marked gray area aligns with a previous imbalance and premium zone, ideal for short entries.
Target Zones:
1. First Target: 24,000 – intraday demand zone.
1. Final Target: 23,920 – previous weekly low / external liquidity pool.
Invalidation: A clean 1H candle close above 24,360 (LQ) would invalidate this bearish setup.
Pullback tradeThe price has bounced off last week's support area with an engulfing bullish candle, showing that the market is still bullish, this provides an entry opportunity after a sharp pullback
WE ONLY TRADE PULLBACKS
Comment your thoughts

DAX, after tomorrow interest cuts we could open new long positiduring tomorrow we could see lots of volotility on the market and market manipulation,
-if the rates will be cutted than it should be a good long opportunity on DAX, and in generally on all the indices
-also US dollar dominance against other currencies, It's important to be very carefull that market will try to manipulate
Fibonacci TradeThe price made a pullback to the 61 level on the fib follwed by a second pullback on the 50 level, now the price has made a higher high, and now looks to go long
WE ONLY TRADE PULLBACKS
Comment your thoughts

DAX: Sideways at ATH, Q3 Coil → Q4 Pop?Since May the DAX has moved sideways at/near all-time highs. Q3 has been chop as expected, but momentum hasn’t broken—buyers keep defending the 23.4–23.7k shelf. I’m leaning into seasonality and prior behavior: staying long for a push into quarter-end, then I’ll reassess. Plan on scaling out into 24,500 → 24,600 → 24,700 (ATH supply), with risk tucked below the recent range floor.
Technicals
• Structure: Multi-month range at the highs; no decisive lower-low. The 4H view shows repeated rejections of a minor descending supply line while the base at ~23,6xx keeps holding.
• Entry zone: 23,620–23,720 (range support / prior VWAP shelf).
• Invalidation: daily close below 23,200–23,300 (range break).
• Targets: 24,000 (psych), 24,300 (mid-supply), 24,600 (ATH line from your chart).
• Breadth/rotation clues (dashboard): Financials firm, tech mixed, autos soft; overall market still balanced rather than risk-off—consistent with consolidation, not reversal.
• Tape feel: Repeated “muted opens” with buyers showing up later in the session fits the grind-higher playbook into month/quarter end.
Fundamentals
• Macro tone: US risk appetite improved after the Fed’s first cut, even as Powell tempered hopes of an aggressive path—enough to cap deep corrections but still supportive of equities. European desk notes point to a restrained start, not a bear impulse.
• Germany specifics: Headlines flag auto-sector warnings (VW/Porsche) weighing on sentiment, but banks and select industrials offset—matching the mixed sector board rather than broad deterioration.
• Flows/seasonality: Quarter-end & Q4 seasonality often favor indices that have consolidated at highs; with DAX still ~1k points off the record, a range breakout toward 24.3k–24.65k is a reasonable path before re-calibrating.
• Risks to thesis: Another round of negative guidance from autos, hotter-than-expected US data re-pricing fewer cuts, or a clean daily close below 23.2k (range failure).
Trade what’s on the chart, respect the invalidation, and pay yourself into strength.
Note: Please remember to adjust this trade idea according to your individual trading conditions, including position size, broker-specific price variations, and any relevant external factors. Every trader’s situation is unique, so it’s crucial to tailor your approach to your own risk tolerance and market environment.

Buy the Dip, Ride the Wave — DAX40 Targeting ~38000"DAX40 | FIBCOS
Wave 2 seems done and dusted ✅ — bulls getting ready to fire up Wave 3! 🚀
As long as price holds above 23,250, the bullish structure stays strong 💪
Targets ahead around 36K–40K as momentum builds within the rising channel 📈
The German Index continues to show power and potential — buy and enjoy the ride 🇩🇪✨
Disclaimer: Educational purpose only, not financial advice.

DAX: Strong Growth Ahead! Long!
My dear friends,
Today we will analyse DAX together☺️
The recent price action suggests a shift in mid-term momentum. A break above the current local range around 24,117.49 will confirm the new direction upwards with the target being the next key level of 24,172.12 and a reconvened placement of a stop-loss beyond the range.
❤️Sending you lots of Love and Hugs❤️

Is this the NEXT big leg up for DAX? It seems like there is stabilisation around in Europe with the markets.
While America is making a mess with its peace with many countries (including Canada).
We are seeing the EURO fly which means there is a safe haven among the CAC, DAX, IBEX and EURSTOXXX...
The charts are looking great for upside, and we might have some optimism around Europe in the next month.
Here are the technicals.
W Formation
Price>20 and 200
Target 25,113
Disclosure: I am part of Trade Nation's Influencer program and receive a monthly fee for using their TradingView charts in my analysis.

Technical Analysis WeeklyGermany 40 has re-entered its trading range after a failed bullish breakout. Price trades at 24,057, slightly below its VWAP of 24,206. RSI at 48.4 suggests subdued momentum. Support lies at 23,683, while resistance is 24,729.
UK 100 maintains a bullish trend but is undergoing a corrective phase. Price has pulled back to 9,394, below its VWAP of 9,403. The RSI at 51.4 indicates weak bullish momentum. Support is at 9,287, and resistance stands at 9,558.
Wall Street remains in a bullish trend but continues to correct lower, currently at 46,303, on top of its VWAP. RSI at 52.6 shows a neutral stance. Support lies at 45,630, and resistance is estimated at 46,911.
Brent Crude is turning bearish within its broader range. Price has fallen to 6,094, below the VWAP of 6,422. RSI at 30.9 indicates strongly bearish momentum. Support sits at 5,983, while resistance is at 6,860.
Gold extends its bullish run in a strong impulsive phase, trading at 4,259, significantly above the VWAP of 4,015 but down a bit from all time highs. The RSI at 75.5 signals less overbought conditions. Support is way down at 3,677, and resistance is at 4,353.
EUR/USD holds its trading range, now trading at 1.1666, right next to its VWAP. RSI at 49.0 signals neutral momentum. Support is at 1.1556, and resistance is at 1.1782.
GBP/USD stays in a bullish trend but is correcting sideways, trading at 1.3423, slightly above the VWAP of 1.3400. RSI at 49.8 shows consolidation. Support is at 1.3299, with resistance at 1.3514.
USD/JPY is in a pullback following its bullish range-breakout, currently at 150.67, just above its VWAP of 150.30. The RSI at 54.2 reflects moderate bullish momentum. Support lies at 146.60, and resistance is at 154.01.

DAX uptrend breakout continuation supported at 23970The DAX remains in a bullish trend, with recent price action indicating a potential overbought pullback within the broader uptrend.
Support Zone: 23970 – a key level from previous consolidation. Price is currently testing or approaching this level.
A bullish rebound from 23970 would confirm ongoing upside momentum, with potential targets at:
24490 – initial resistance
24580 – psychological and structural level
24770 – extended resistance on the longer-term chart
Bearish Scenario:
A confirmed break and daily close below 23970 would weaken the bullish outlook and suggest deeper downside risk toward:
23870 – minor support
23770 – stronger support and potential demand zone
Outlook:
Bullish bias remains intact while the Dax40 holds above 23970. A sustained break below this level could shift momentum to the downside in the short term.
This communication is for informational purposes only and should not be viewed as any form of recommendation as to a particular course of action or as investment advice. It is not intended as an offer or solicitation for the purchase or sale of any financial instrument or as an official confirmation of any transaction. Opinions, estimates and assumptions expressed herein are made as of the date of this communication and are subject to change without notice. This communication has been prepared based upon information, including market prices, data and other information, believed to be reliable; however, Trade Nation does not warrant its completeness or accuracy. All market prices and market data contained in or attached to this communication are indicative and subject to change without notice.

GER40 Review October 28 2025Short-term price movement ideas.
The price has reached the daily zone of interest and performed a liquidity sweep there, which triggered a bearish move and created conditions for its further continuation.
At the moment, we have a 1H short order flow. If the price confirms the last 1H break-to-sell (BtS), we can then consider opening a position aiming for a continuation toward the 4H low.
Be flexible, adapt to the market, and the results will come quickly. Good luck to everyone.

The most audacious forecast DAX gapped up above the trendline on news on trade deals, but there is no follow through. Instead, price is coming down and re-testing the breakout trendline.
Price action is bearish, which indicates further downside, thus rendering the trendline support as useless. Will that be the case? No doubt, the overall market is bullish, especially the US markets. But will DAX be the clue that we see a profit taking/sell down for the coming days? And using a simple projection, 23000 will be a 'scary' yet healthy pullback, as good level to go long off.

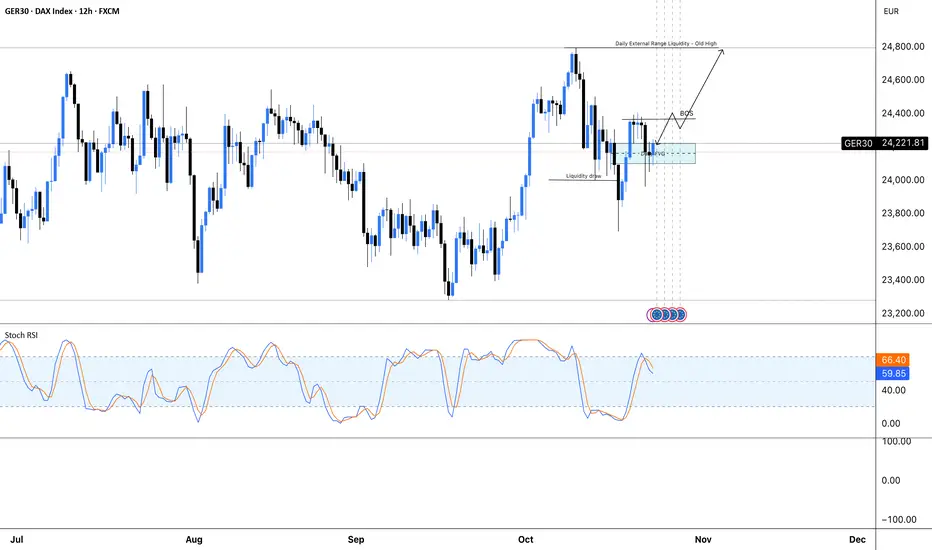
GER30 | Multi-Timeframe Bullish Expansion SetupThe Market Flow | October 27, 2025
Technical Overview
Weekly:
• The weekly bullish trend remains intact, sustaining above prior structural pivots.
• Structure continues its expansion phase, with higher lows forming consistent with the broader bullish bias.
Daily:
• The daily trend has started its transitioned into bullish after reclaiming and closing above the previous breakdown level.
• Wave structure confirms alignment with the weekly expansion path.
• Bias continues long as momentum builds toward upper clean H4 structures.
H4:
• H4 bullish trend confirmed, supported by a sequence of higher pivots.
• Current structure originated from the H4 pivot zone, now acting as the foundation for the next expansion leg.
• Fibonacci extensions show progressive resistance targets
H1:
• Previous H1 countertrend was broken from the H4 pivot zone, confirming re-entry into the bullish structure.
• New pivot formed and validated by crossing the previous H1 pivot, establishing continuation bias in favor of the higher timeframe trend.
Trade Structure & Levels
• Bias: Long above 24,219.32 (H4 pivot zone)
• Trigger = Break above 24,325.60 (highest clean H1 breakdown - "EXP")
• Primary Invalidation = H4 pivot at 24,219.32
• Secondary Invalidation = Daily pivot near 23,990.21
• Path → 24,450.60 → 24,556.25 → 24,625.80
• Phase: Accumulation
Risk & Event Context
• Index behavior may remain sensitive to European earnings season and macro data releases (inflation, ECB commentary).
• Volatility spikes likely around key US macro events.
Conclusion
Multi-timeframe alignment confirms a resuming bullish expansion above the Expansion level. With both H4 and Daily trends synchronized above active pivots, the path remains upward toward 24,625.80 while 24,218.30 holds as the key structural invalidation.

DAX: Positioning to move higherGerman DAX: Price currently inside a possible support zone within internal liquidity. I would like to see Friday (24th) push past 24.350 and a break of structure which would then see a reach for the external daily liquidity resting at 24.800.
I like:
- The current support level
- Recent sweep of liquidity
- Bullish divergence
I don't like:
- Current RSI level
- Fundamentals
#DAX at a record ALL TIME HIGHand Yet this move is far from over
My final log target is still 8000 points away.
We are witnessing #Fiat melt away in front of our eyes.
Are you actually making money is the real question?
#gold #silver #bitcoin

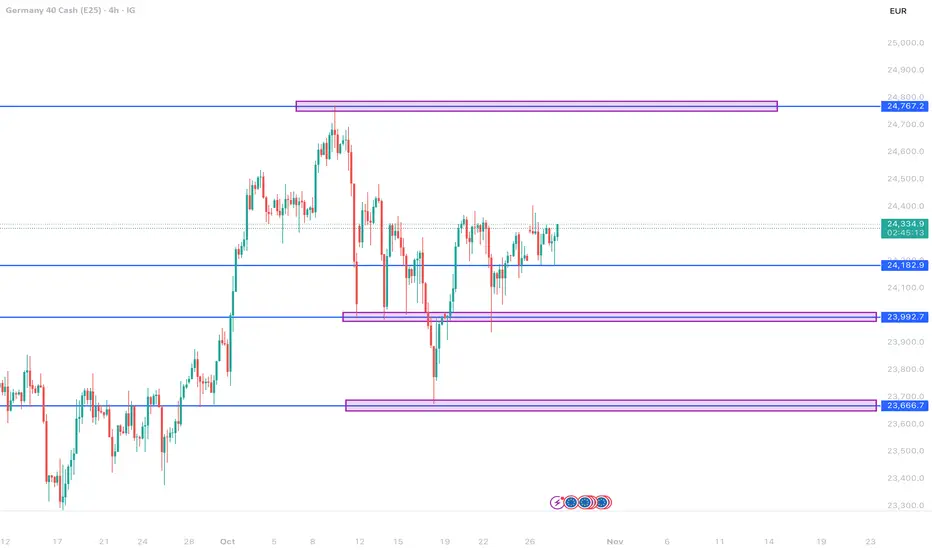
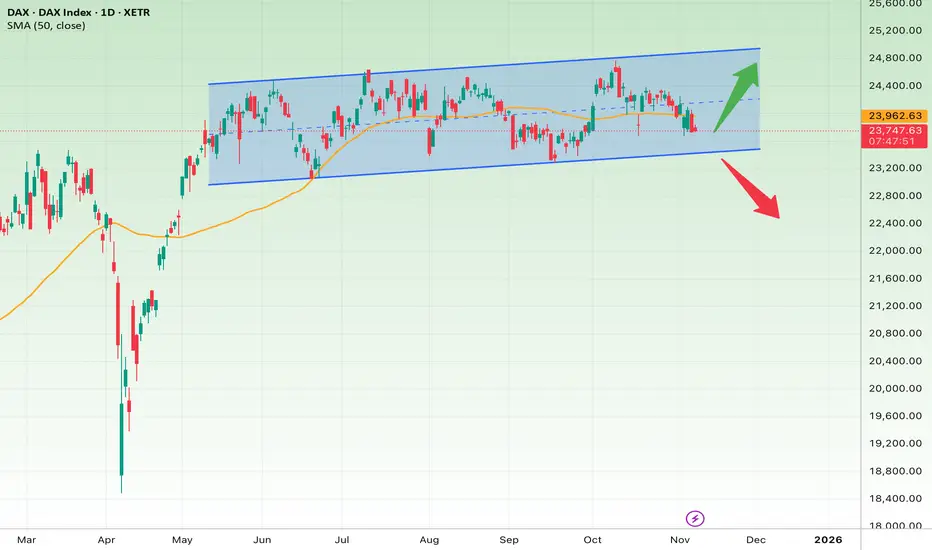
DAX at the Edge – Germany’s Market Faces a Big Decision!The German DAX Index has been trading within a gentle upward channel for several months and is now testing the lower boundary of that channel around the key support zone of 23,600–23,800. This level also aligns with the 50-day moving average (SMA50), which adds extra strength to the support.
In the short term, if the index holds above 23,700 and forms a bullish reversal candle, a rebound toward 24,500–24,800 (the top of the channel) is likely. The stop loss for this bullish setup would be a confirmed breakdown below 23,400.
However, if selling pressure continues and the price closes below 23,400, it could trigger a deeper correction toward 22,800–23,000, signaling a potential trend shift in the medium term.
From a long-term perspective, as long as the DAX remains above 23,000, the broader trend stays bullish, with next major upside targets around 25,000–25,500.
In short, the current area represents the dividing line between a continuation of the uptrend and the beginning of a medium-term correction in the German market.
Technical Analysis WeeklyGermany 40 is still stuck in a neutral range phase. Price is at 24,159, close to the VWAP of 24,150. The RSI at 50.3 suggests a totally neutral bias. Support is at 23,878, and resistance is at 24,427.
UK 100 continues in a strong bullish impulsive trend, trading at 9,732 above its VWAP of 9,532. Momentum remains strong with an RSI of 69.3, nearing overbought territory. Support is seen at 9,234 and resistance at 9,829.
Wall Street maintains its bullish trend and is still in an impulsive phase, trading at 47,643 and comfortably above the VWAP of 46,711. The RSI at 68.0 reflects strong upside pressure. Support lies at 45,359, with resistance at 48,063.
Brent Crude is still bearish overall, though it has entered a correction phase- and could be staging a trend reversal. Price is at 6,461, hovering above the VWAP of 6,333. RSI at 51.5 indicates a neutral stance. Support is found at 6,000, while resistance caps at 6,667.
Gold’s bullish trend has paused into a correction, now trading at 4,002, still below the VWAP of 4,104. The RSI of 49.1 reflects a cooling momentum. Support is at 3,861, with resistance at 4,104.
EUR/USD has broken down into a 3-month low but remains in an overall neutral trend, trading at 1.1515 and under its VWAP of 1.1614. The RSI at 33.1 hints at building downside momentum. Support is found at 1.1500, with resistance at 1.1710.
GBP/USD has weakened to test the bottom of its multi-month range setting up possible breakdown into a new bearish trend, currently at 1.3127 and beneath the VWAP of 1.3309. The RSI at 30.4 signals oversold conditions. Support is at 1.3106, with resistance at 1.3513.
USD/JPY continues its bullish impulsive trend, now trading at 154.13, above the VWAP of 152.19. The RSI at 66.3 shows strong upward pressure. Support lies at 149.74, with resistance at 154.64.

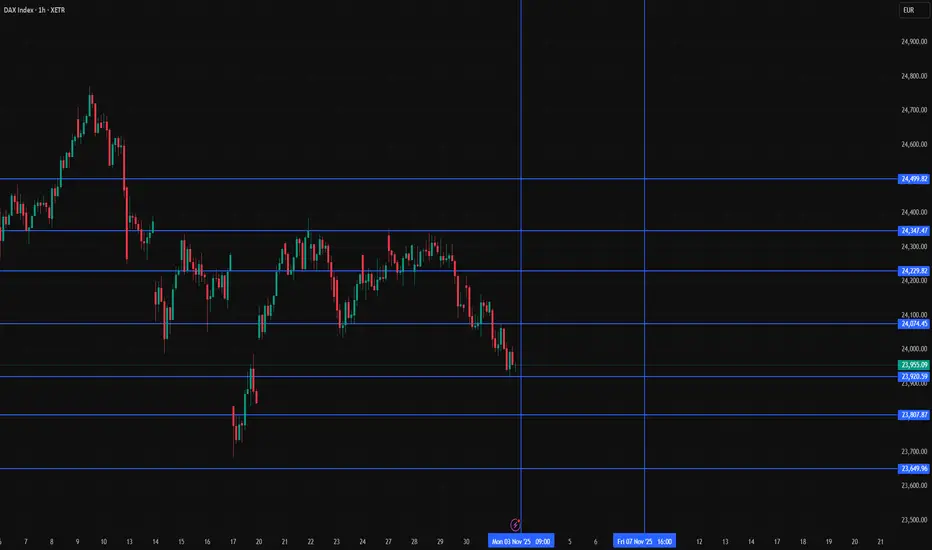
DAX weekly pivot map for 3 to 7 November 2025Why this matters
Next week is a sequence market. Final PMIs set tone. Germany prints factory orders and industrial production. The week closes with the U.S. jobs report. That mix often compresses ranges around fair value until something cracks. So the plan is one grid, two scenarios, three rules.
Chart to publish
Timeframe 1H on GER40. Add a single grid from last week Xetra cash.
High 24 348.59. Low 23 922.95. Close 23 958.30.
Pivot 24 076.61. R1 24 230.28. R2 24 502.25. R3 24 655.92.
S1 23 804.64. S2 23 650.97. S3 23 379.00.
Optional helpers. VWAP. Cumulative delta. No extra overlays. Keep it clean so the levels do the talking.
What I am watching on tape
How price behaves around the pivot during quiet periods. The first pass into R1 or S1 without a fresh release often mean reverts. If a surprise hits, the grid becomes a runway for extension. The job is not to predict. The job is to recognise when ranges are intact and when a genuine break is underway.
Catalysts and session notes
Germany releases often land near 08:00 CET. Factory orders midweek. Industrial production the day after. The U.S. Employment Situation prints Friday at 08:30 ET. That one moves global curves and the euro which feeds back into exporters. I do not hold risk through the print. I would rather enter the follow through once the first sweep finishes.
Levels that matter this week
Pivot 24 076 is the magnet. Above it the burden of proof is on sellers. Below it buyers need time to build. R1 24 230 is the first supply pocket. R2 24 502 lines up with prior supply. R3 24 656 sits just under the recent extremes. On the downside S1 23 805 is first support. S2 23 651 is where momentum sellers usually engage. S3 23 379 is the stress zone if the week turns heavy.
Two simple scenarios
Scenario A soft landing tone
PMIs steady. Orders stabilise. Production improves. Payrolls strong enough but wages calm. The tape accepts price above the pivot and north of R1. Tactics. Buy pullbacks into 24 080 to 24 120 with a hard stop under 23 980. First take-profit at R1. Trail into the 24 330 pocket. If R2 breaks on confirmation keep a runner toward 24 650 to 24 770 where supply stacked recently. The idea is to let the market pay you for being patient near the magnet then step aside if the grid stops working.
Scenario B growth scare tone
PMIs revise down. Orders miss. Production disappoints. Payrolls hot on wages. Sellers defend R1 and the euro wobbles. Tactics. Sell failed bounces close to 24 230 with a stop above 24 330. First target the pivot. Add only on a clean loss of 23 980. Manage into S2 and be pragmatic near S3 because volatility tends to spike there.
How to trade the grid
Entry
I anchor on 1H structure. I drill down to 15m for the trigger. I want acceptance around the level. That means a pause, a clean candle close, and a little confirmation from volume. Chasing the very first touch is optional and usually a worse price unless the day is a trend day.
Risk
Fixed R works. Use a small stop around the other side of the level. I like 0.5 R stops and 1.0 R first targets. On days with a data print I cut size in half or I skip the first twenty minutes. The easiest way to survive event weeks is to size for the noise and accept that some moves will run without you.
Adds and exits
Adds only after partials are banked. No martingale. I scale out at the next grid line or at VWAP if the run stalls. I do not marry a view. If the grid stops behaving I go flat and wait for the next high quality test.
Why this works
These weekly levels attract flow. Dealers manage hedges around them. When the tape is balanced the pivot acts like gravity. When the tape is imbalanced the break through R2 or S2 gives you a repeatable context to join the side that is pressing. You are not forecasting. You are responding with a simple structure.
Rules to pin on the chart
• Fade the first clean touch of R1 or S1 back to the pivot if no high impact release is due within the next hour.
• Trade breakouts only on a firm thirty minute close above R2 or below S2 with volume support and a positive delta profile.
• Stay flat into red events. Flat at least five minutes before the U.S. jobs report. Reassess after the first sweep.
Instrument
GER40 on the 1H chart. If you execute futures on Eurex or a CFD feed, tiny price differences do not change the grid. Rebuild the levels each weekend from the cash high low close so the numbers stay honest.
Mindset
The grid is a map. It tells you where to look. Your edge comes from taking the same trade the same way every time. Good process first. P and L follows.
Education only.
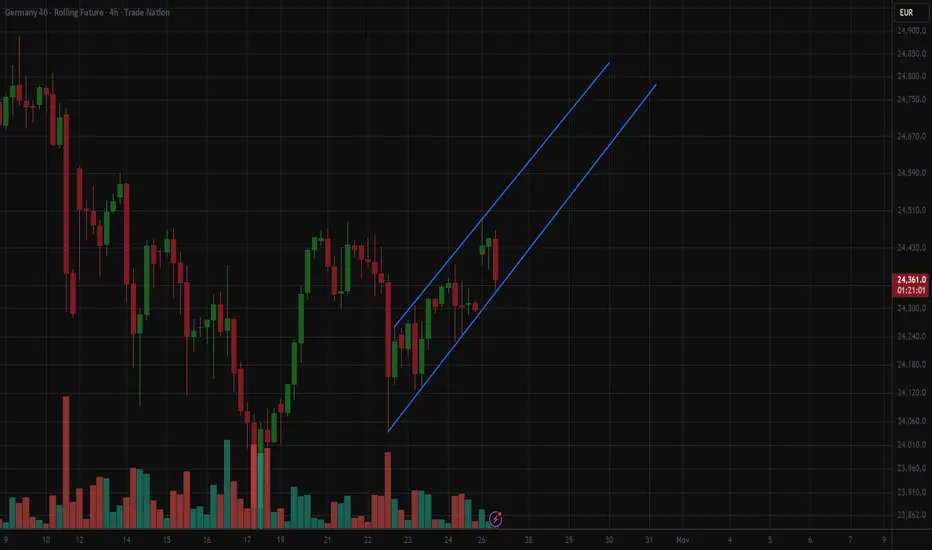
4H Bull channel DAX Buy signalDax futures are in a bull channel on 4H chart since 23 october.
Today the DAX can be bought at the bottom of that bull move with an entry around 24350, stop loss for 50 and an expected profit of 120 points.