Nas looks so cleanThis pattern on Nas is to clean, either we get a break out to that fat pool of liquidity to the upside or we fake out and swap out the buyers either way I’m prepared!
But hey what do I know
NDQM trade ideas

nas retest longim on fire today, made about 4k usd in the morning session.
but im looking at this one, conditions, looking for uk to dump, then usa to pump back up,
will look at 5 mins candles to see entry. i want to see some wicks or support.
if doesn't dump before USA timezone, i rather stay out as we got 3 news tonight, looking very choppy, likely will stay out of usa market today, just price action and take some small wins here and there.
my scalping im on 7 trading day win streak, about 80% winrate.

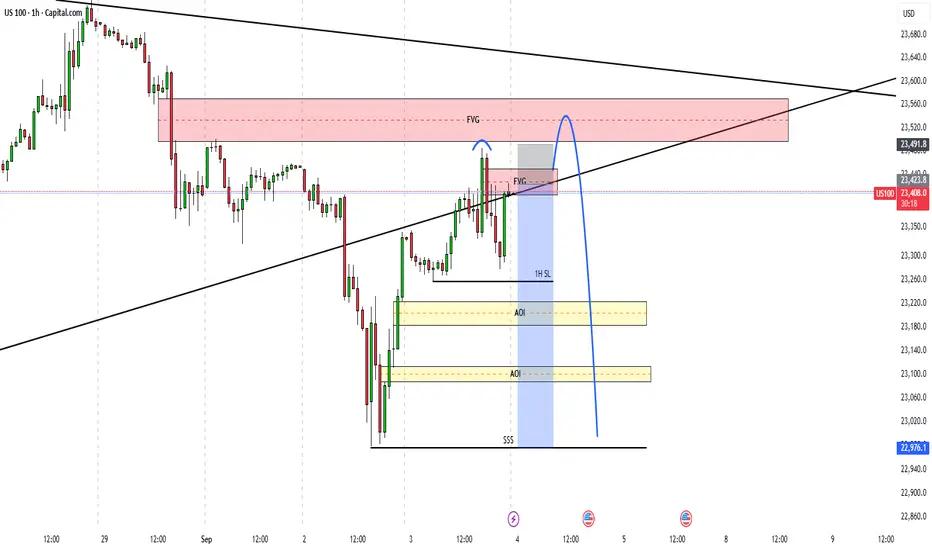
Potential move based on ICT analysis for US100Agree or Disagree? Saw a lot of liquidity that the markets did not take out (1H SL). Break out of DAILY bullish trendline and the selling opportunity is starting to enter the room. This was not a fundamental analysis, so anything that goes against this analysis, is all independent on what happens in economic news
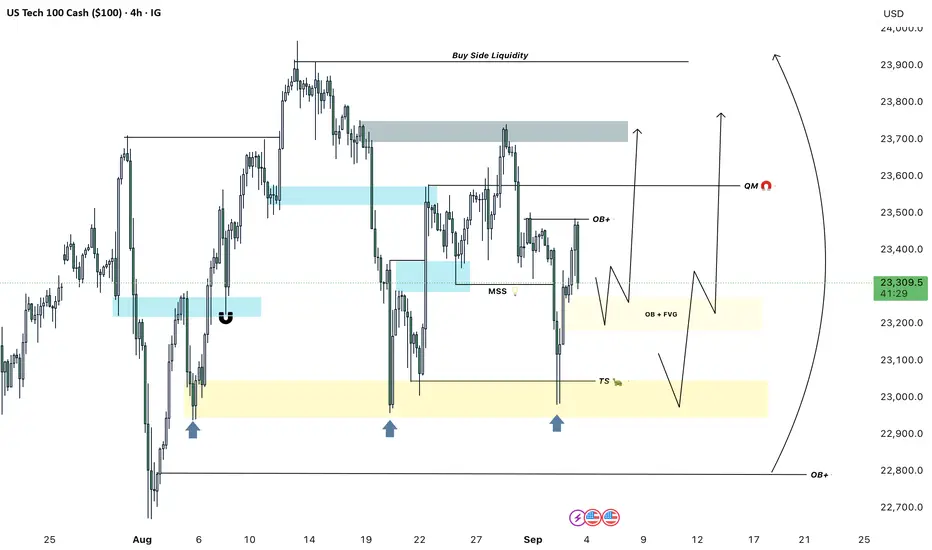
WHY I THINK NASDAQ WOULD CONTINUE ITS BUYS
Big tech is still crushing earnings, AI plays are heating up, and the semis? Still running. Every dip lately is getting bought up fast, and that tells me one thing: smart money is still in the game.
We’ve got a potential rate cut on the horizon, inflation’s cooling off, and the market is pricing in more upside. Structure-wise, we’re seeing higher lows and breakouts across key levels.
Unless something major shakes the market, I’m staying bullish here. Momentum, fundamentals, and sentiment are all lining up. Buyers aren’t done — not even close.
ict conceptsTrading foreign currencies can be a challenging and potentially profitable opportunity for investors. However, before deciding to participate in the Forex market, you should carefully consider your investment objectives, level of experience, and risk appetite. Most importantly, do not invest money you cannot afford to lose.
There is considerable exposure to risk in any foreign exchange transaction. Any transaction involving currencies involves risks including, but not limited to, the potential for changing political and/or economic conditions that may substantially affect the price or liquidity of a currency. Investments in foreign exchange speculation may also be susceptible to sharp rises and falls as the relevant market values fluctuate. The leveraged nature of Forex trading means that any market movement will have an equally proportional effect on your deposited funds. This may work against you as well as for you. Not only may investors get back less than they invested, but in the case of higher risk strategies, investors may lose the entirety of their investment. It is for this reason that when speculating in such markets it is advisable to use only risk capital.

NASDAQ H4 : RETESTING TIME ?? Hello Everyone ,
The Nasdaq Currently Got Rejection From OB (23,480)
We Are Expecting Retest Buy From Below Zones ⬇️
OB + FVG (23,275 / 23180)
SUPPORT (23,00 / 22,995)
ORDER BLOCK ( 22,785)
Hope You Understand , Follow Us For More
Good Luck 🤞
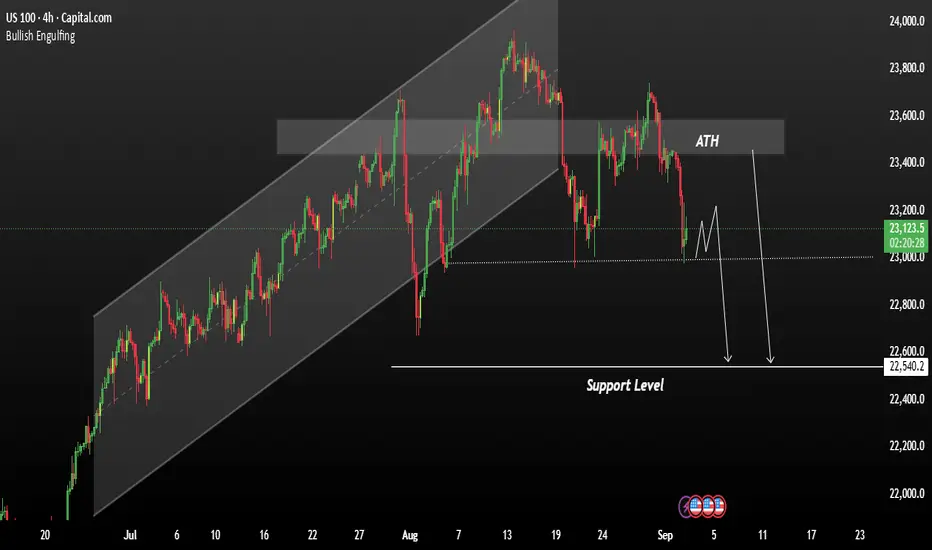
USNAS100 remains in a consolidation phase with a downside biasThe USNAS100 remains in a consolidation phase with a downside bias, following a slight price slip on Friday, as traders turned cautious ahead of the PCE inflation report — the Fed’s preferred gauge for inflation This Personal Consumption Expenditures (PCE) report, due pre-market, is highly anticipated and may play a pivotal role in shaping the Federal Reserve's September rate decision.
Price action remains below key resistance levels As long as the index fails to break above resistance, the bias remains bearish A downside break from consolidation could target 22,540 in the short term.
You may find more details in the chart.
Trade wisely best of Luck,
Ps; Support with like and comments for better analysis Thanks for supporting.
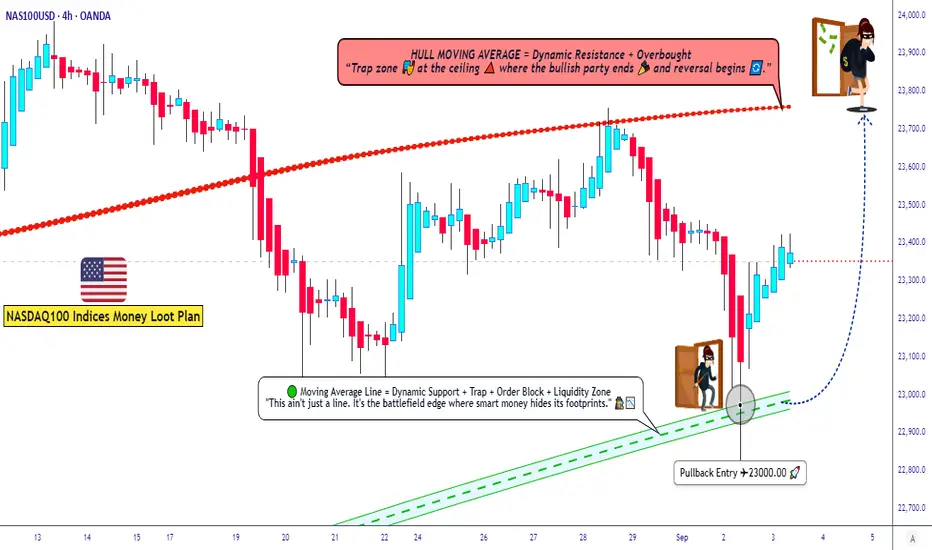
US100 Trading Plan ¦ Layering Strategy + Macro Sentiment Drivers🚀 NASDAQ100 / US100 Index – Thief Money Heist Plan 🎭
📌 Plan: Bullish Swing / Scalping Setup
Dear Ladies & Gentlemen (Thief OG’s), here’s the heist-style breakdown for US100 🔑:
🏴☠️ Entry Style (Thief Layering Strategy)
Using layered limit orders for flexibility & precision:
• 23200.0
• 23250.0
• 23300.0
• 23350.0
(You may increase limit layers based on your strategy & risk appetite)
📉 Moving Average Pullback Entry Plan
• Buy entries on pullbacks to the Fibo level 382 Triangular Moving average zone.
• Look for bullish candles confirming the bounce from these MAs.
• This offers better risk-to-reward by catching momentum on retracements instead of chasing highs.
❓ Why This Works?
• Moving averages often act as dynamic support/resistance in trending markets.
• Institutional traders & algos track them heavily, making them high-probability zones.
• Combining with layering entries = higher flexibility + reduced risk of mistimed single entry.
🛡️ Stop Loss (Protect the Vault)
• Thief SL: @23000.0
• Reminder: Adjust your SL based on your own strategy & risk tolerance.
🎯 Target (Escape Zone)
• Overbought + Trap Zone ahead!
• Escape target: @23750.0
• Note: Don’t rely only on my TP — secure profits at your own pace and risk.
📊 US100 Index CFD Real-Time Data Sep 03
📈 Daily Change: +133.47 (+0.57%)
📅 Monthly Performance: +0.76%
📆 Yearly Performance: +23.48%
😰😊 Fear & Greed Index
📊 Current Reading: 53/100 (Neutral)
🧐 Interpretation: Market sentiment is balanced, showing neither extreme fear nor greed. Investors are cautious but not panicked.
🧠 Retail vs. Institutional Sentiment
👥 Retail Traders: Moderately bullish (55% Long, 45% Short)
🏦 Institutional Traders: Slightly cautious (50% Long, 50% Short)
🔑 Key Drivers: Mixed signals from manufacturing data and upcoming labor market reports.
📉📈 Fundamental & Macro Score
📊 Macro Score: 6/10
Manufacturing PMI (48.7) still in contraction but improving.
Labor market data (JOLTS) awaited for clarity.
⚡ Volatility Score: 5/10 (Moderate)
VIX near average levels, indicating stable expectations.
💧 Liquidity Score: 7/10
Strong volume and breadth in large-cap tech stocks.
🐂🐻 Overall Market Outlook
✅ Bullish (Long): 60%
Supported by strong yearly gains and resilience in big tech.
⚠️ Bearish (Short): 40%
Concerns over manufacturing contraction and inflation pressures.
💡 Key Takeaways
📈 US100 is trending mildly positive today (+0.57%).
😐 Sentiment is neutral—no extreme fear or greed.
📊 Macro data hints at cautious optimism but watch for upcoming labor reports.
🐂 Overall bias leans slightly bullish for long-term holders.
📊 Related Pairs to Watch
FOREXCOM:SPX500
TVC:DJI
TVC:VIX
NASDAQ:NDX
FX:USDOLLAR
✨ “If you find value in my analysis, a 👍 and 🚀 boost is much appreciated — it helps me share more setups with the community!”
#NASDAQ100 #US100 #NDX #SPX500 #DJI #TradingView #SwingTrade #ScalpTrading #LayeringStrategy #MarketAnalysis
NASDAQ 1D MA50 SUPPORT NASDAQ 1D MA50 Support 🟢
NDX consolidating on the 1D MA50 inside its Channel Up since May.
RSI setup looks like the May 30 Higher Low ✅.
Last bullish leg from this formation gave +6.80% — same play now targets 24,500 🎯.
Kaizo precision. Rally loading… 🥷🚀

Nas100 Trade Set Up Sep 3 2025FX:NAS100
www.tradingview.com
Price is within a LH and LL range so i would like to see LH or PDH swept as liquidity before a continuation back down towards SSL

NAS100 ShortElite Analysis
Executed off a 3m True OB
All confirmations met.
Targeting lower liquidity

NAS100 UPDATE - BULLS or TRAP?Dear Friends in Trading,
JOLT's Event Today - Be Safe!
Keynote:
Strong demand or strong correction?
Can price stabilize above 23550 to respect structure?
Untouched liquidity between 22900 - 22600.
I sincerely hope my point of view offers a valued insight.
Thank you for taking the time study my analysis.

NQ is still bullish on the HTFDespite NQ being bearish on the lower timeframes, it is very bullish on the higher timeframe. with good risk management, I would prefer siding with the buyers as per my analysis attached.

NAS100 technical analysisNAS100 technical analysis. Price just broke through trend line. Confirms price should continue to be bullish and go up to resistance levels.
US100 – London Session OutlookTrading Focus
The marked zones on the chart highlight areas where I look for small but quick intraday moves. There are two potential sell zones and two potential buy zones. If a zone breaks, I look for continuation trades on a retest of that same level.
This approach allows me to capture short, tactical opportunities with clear risk levels, while adapting quickly if price breaks structure.
Macro Update – Manufacturing Still Under Pressure
Yesterday, the ISM Manufacturing PMI was released. The August figure came in at 48.7%, a slight improvement from July’s 48.0%, yet still below the 50% threshold that signals expansion. This indicates that U.S. manufacturing remains in contraction for the sixth consecutive month, though the slower pace points to some early signs of stabilization. New orders climbed back above 50%, suggesting demand may be recovering, but production and employment both weakened, and prices remained elevated, underscoring persistent cost pressures. Overall, the sector is still under strain, showing only tentative signs of recovery.
Market Sentiment
Overall, market sentiment is cautious. The rebound in new orders provides a hint of optimism, but weak production, soft labor data, and sticky input costs keep investors on edge. Traders remain defensive, seeking confirmation before committing risk in what is still a fragile backdrop.
What’s Next – JOLTS Job Openings
Today, all eyes are on the JOLTS Job Openings report, a key gauge of U.S. labor market strength.
A higher reading signals tight labor conditions, keeping wage and inflation pressures high and limiting the Fed’s ability to cut rates.
A weaker reading suggests cooling demand for workers, supporting the case for easing.
This release has the potential to move markets quickly, adding another layer of volatility.
key levels for the nqIf the nq breaks 23362 we have enough information to wait for a shakeout and then enter. if it breaks 23210.7 we got to wait for a retracement and then a shakeout to sell. But, be aware that for sales the target should be more aggressive which means to cover on 23k, and just in case, we can leave a small portion of the position open but cover more than 70% because it might be the macro shakeout.
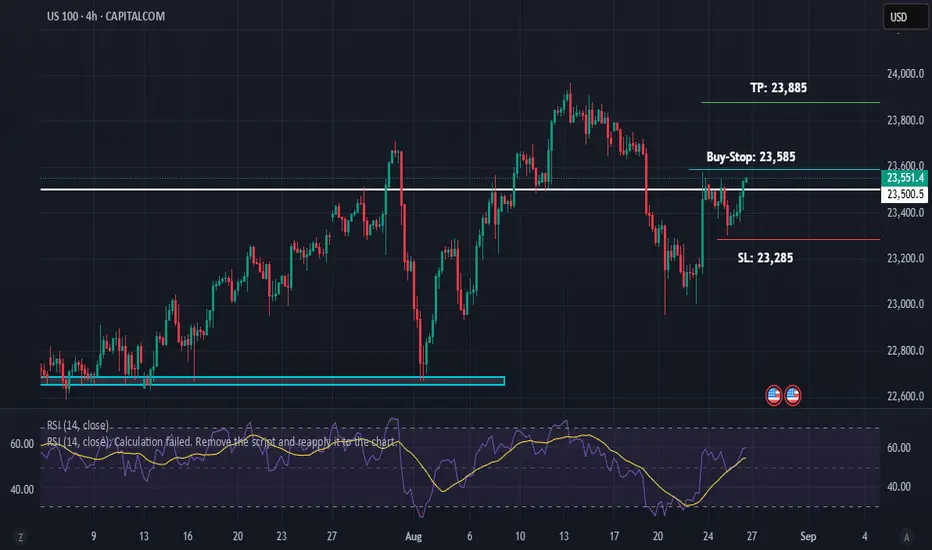
US 100 Buy-Stop, 4H/1D Close Above ResistanceUS 100 has closed above Resistance on 4 Hour and Daily Timeframe.
It is in Bullish Trend on Daily Timeframe. The trend is very likely to continue based on Technicals.
Moreover, it is likely that Federal Reserve will lower the interest rates in the Unied States. If that happens, financial markets will continue the upward trajectory. That however, is a long-term projection. Our trade setup here is just 1:1 but we can see more such trades in the future.
US100 Risky Short! Sell!
Hello,Traders!
US100 made a sharp
Move up and made a
Retest of the horizontal
Resistance of 23,375
From where we will be
Expecting a local bearish
Correction and a move down
Sell!
Comment and subscribe to help us grow!
Check out other forecasts below too!
Disclosure: I am part of Trade Nation's Influencer program and receive a monthly fee for using their TradingView charts in my analysis.

NAS100 SELL 15 MINUTE TIMEFRAMESTRONG SUPPLY ZONE Fair value gaps to fill Amazing Range 3:1 Risk Reward, Let's See!

US100 Consolidating? With raection around 2300 area level, its clear to see that bulls are not ready to let go yet. This purely based of technicals. I'm expecting a bit of a pull to get an entry @ 23211 hopefuly the market will be in our favour.

Explaining Fibonacci Retracement/Extension levelsThis video is designed to help teach you why I use the Fibonacci Defense levels as components of price action and how I use Fibonacci retracement/extension levels (related to previous market trends).
Remember, the three components of price action are TIME, PRICE, & ENERGY.
If you don't understand how price is structured before attempting to use Fibonacci concepts, it's almost like trying to throw darts blindfolded.
You must break down the previous trends in order to try to understand what is happening with current price trends (expansion/contraction/phases).
Watch this video and I hope it helps all of you understand what the markets are doing and how to use Fibonacci Retracement/Extension levels more efficiently.
All types of technical analysis are validation tools - not guarantees. The only thing we get out of technical analysis is a way to validate or invalidate our expectations. A or B. Nothing else.
Get some.
#trading #research #investing #tradingalgos #tradingsignals #cycles #fibonacci #elliotwave #modelingsystems #stocks #bitcoin #btcusd #cryptos #spy #gold #nq #investing #trading #spytrading #spymarket #tradingmarket #stockmarket #silver

NAS100 LongThis is now oversold on all timeframes, showing sellers exhaustion
There is a deep crab pattern on H4 and H1 displaying a potential reversal zone
There is great support at this level as daily trend is also pointing up
Double bottom on M15 showing divergence
Stoploss of 150 pips
