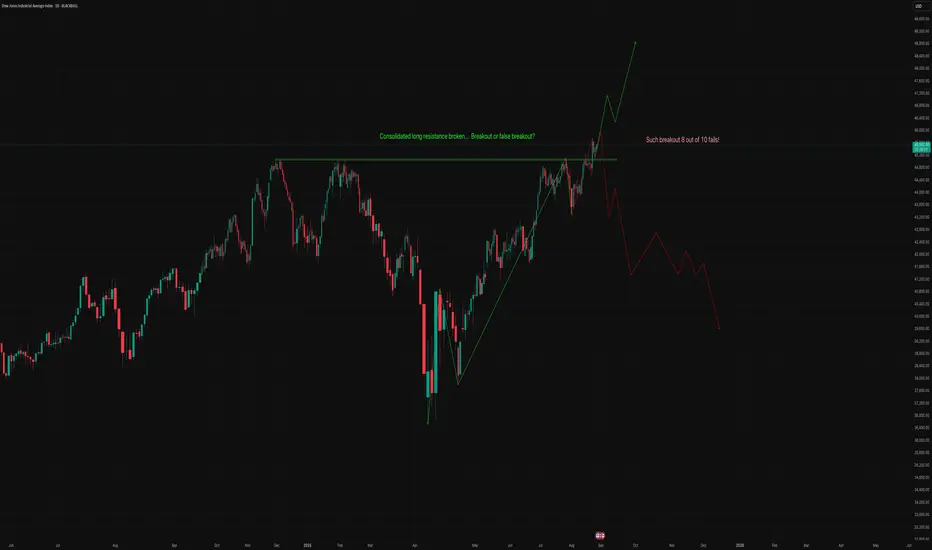
Dow Jones Industrial Average (DJIA) – Daily timeframe🔹 Chart Observations
Resistance Breakout
Price has broken above a long consolidation resistance (~46,000 region).
The breakout candle is strong, but history shows such moves can turn into false breakouts.
Volume / Price Action
Recent candles show strong upward momentum but also long wicks, hinting at supply near highs.
Breakouts without strong follow-up volume often fail.
Trend Structure
From April lows, the index has made a clear higher-high, higher-low structure.
This short-term uptrend is intact unless price falls below ~44,500.
Probability Factor
Your annotation (“Such breakouts 8 out of 10 fails”) is correct — historically, consolidated range breakouts in indices often retrace.
A retest of breakout zone (~45,000–45,500) is possible.
🔹 Medium-Term Scenarios
✅ Bullish Case (Green Path in Chart)
Sustains above 46,000 → momentum could extend toward 47,800 → 49,500 (ATH zones).
Requires confirmation with volume and follow-through buying.
Support at 45,000–45,500 must hold.
⚠️ Bearish Case (Red Path in Chart)
If price fails to hold 45,000, breakdown may drag index toward:
42,500 (first major demand zone).
40,000 (psychological + structural support).
A false breakout could trigger a deeper correction, especially if global risk sentiment weakens.
🔹 Medium-Term Outlook
Bias: Cautiously bullish, but watching for false breakout signs.
Key trigger levels:
Above 46,000 → bullish continuation.
Below 45,000 → correction likely toward 42,500–40,000.
🔹 Trading View
Swing Traders:
Enter only on confirmation (daily close above 46,200 with volume).
SL below 45,000.
Options Traders:
Iron condor/strangles around 45,000–47,000 range could work short term, since volatility may compress after breakout.
Medium-term investors:
Better to wait for a retest of breakout zone before adding fresh longs.
⚠️ Disclaimer: This is a technical view, not financial advice. Always combine with macro factors (US rates, Fed outlook, earnings).
WS30M trade ideas
we can see a sell entry here.....as we can see us30 already was on resistance area and try to break down before fed news there is also a trendline here and fed news just pump the market now they will come to break the trendline so bias is also bullish but it may give us a bearish movement from order block set ur target depend on ur risk reward

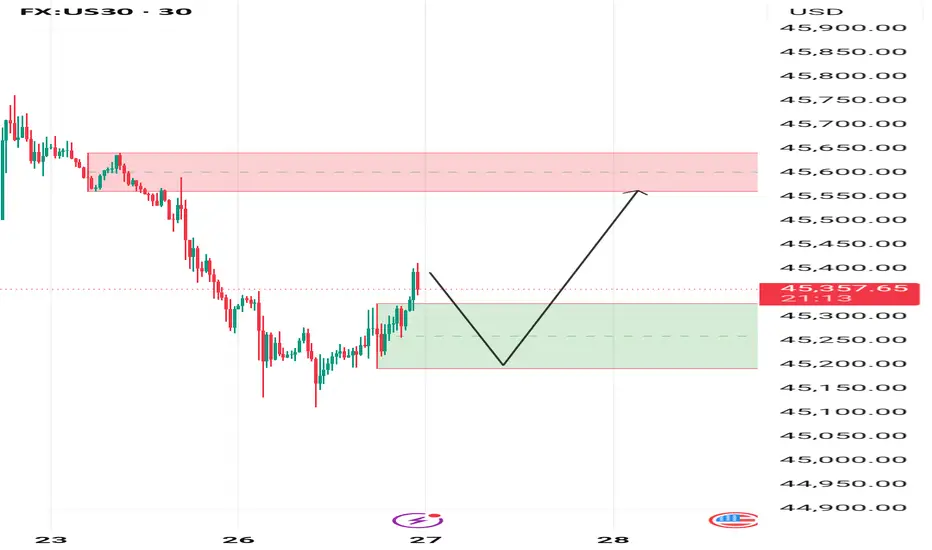
US30 SELL SETUPBased on the previous analysis, price tapped into the marked sell zone — you can see my sell setup on the chart.

DOW JONES assisted by the 4H MA50 this Bullish Leg targets 47200Dow Jones (DJI) has turned its 4H MA50 (red trend-line) into Support and following the August 01 (Higher Low) bottom on the 1D MA50 (blue trend-line), it is extending the new Bullish Leg of the 4-month Channel Up.
With the 1D RSI also bouncing on its medium-term Support, this is a strong short-term buy signal. The previous two Bullish Legs both rose by a little over +9.00%. This gives us a 47200 Target on the short-term.
-------------------------------------------------------------------------------
** Please LIKE 👍, FOLLOW ✅, SHARE 🙌 and COMMENT ✍ if you enjoy this idea! Also share your ideas and charts in the comments section below! This is best way to keep it relevant, support us, keep the content here free and allow the idea to reach as many people as possible. **
-------------------------------------------------------------------------------
Disclosure: I am part of Trade Nation's Influencer program and receive a monthly fee for using their TradingView charts in my analysis.
💸💸💸💸💸💸
👇 👇 👇 👇 👇 👇

US30 Will Keep Growing!
HI,Traders !
#US30 is trading in an
Uptrend and the bullish
Breakout reinforces our
Bullish bias so after the
Potential pullback and retest
Of the new support of 45136.7
A further bullish continuation
Is to be expected !
Comment and subscribe to help us grow !
US30 - Potential TargetsDear Friends in Trading,
As long as price remains above 45000, continued bullish action is expected
I sincerely hope my point of view offers a valued insight
Thank you for taking the time study my analysis.
Us30usd market analysis #US30 technical analysis. Price has broke through upward trend line. Trend line acting as resistance levels now. We should see price continue to drop here.

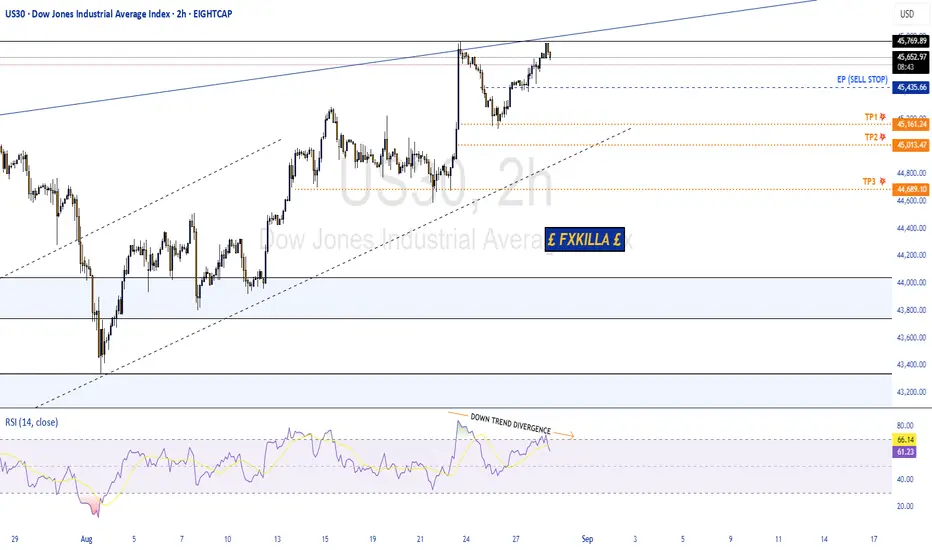
Dow Jones(US30) High Probability Setup SOON!!🚨DOW JONES HIGH PROBABILITY SELL SETUP🚨
* Here We Can See Clearly The Next Potential Move For US30 Coming Hours/Day.
* Here We Can See Clearly The Divergence On RSI Indicating A Reversal Happening.
* Keep A Close Eye On Your Trading Position.
* Happy PIP Hunting Traders.
£ FXKILLA £
Dow Eyes 45,700-Resistance for Breakout ConfirmationDespite consistently beating market expectations with strong earnings, Nvidia’s Q3 outlook is under pressure. China’s restrictions on importing Nvidia’s H20 chips due to security concerns have weighed on the stock, preventing it from reaching new highs.
Both Nasdaq and Nvidia shares are still trading below their respective record highs, limiting upside potential for the Dow and S&P 500, especially in light of ongoing US-EU political and economic instability.
While the Dow Jones holds above the 45,000 mark, it now faces key resistance at 45,700, which must be comfortably breached to confirm further bullish continuation toward 46,200, 47,100, and 48,000. These levels align with the upper boundary of a well-respected ascending channel in place since May 2025.
On the downside, should political and economic pressures dampen risk appetite, and if overbought RSI conditions resurface, a drop below 45,000 may open the door to further losses toward 44,500 and 43,800.
Written by Razan Hilal, CMT

Dow Jones Rejected at 45,680 Ahead of GDP DataUS30 – Overview
GDP Data in Focus After Rejection From Resistance
The Dow Jones reached the 45,680 resistance level mentioned in the previous outlook and has since stabilized below it. Today, price action will likely be influenced by the upcoming U.S. GDP release, which could increase volatility.
🔹 Technical Outlook
As long as the index trades below 45,680, bearish momentum is favored toward 45,450.
A confirmed 1H close below 45,430 would strengthen the bearish move, opening the way to 45,285 → 45,110.
However, if price closes a 1H candle above 45,680, bullish momentum could resume, with upside targets at 45,860 → 45,980.
🔹 Key Levels
Pivot: 45,680
Resistance: 45,860 – 45,980
Support: 45,450 – 45,285 – 45,110
✅ Summary:
US30 has rejected resistance at 45,680 and remains under pressure ahead of the GDP release. Watch 45,680 as the pivot: staying below keeps the bearish bias intact, while a breakout above would signal renewed bullish momentum.

Bullish bounce off?DJ30 has bounced off the support level, which is a pullback support that lines up with the 50% Fibonacci retracement and could potentially rise from this level to our take profit.
Entry: 45,120.64
Why we like it:
There is a pullback support that lines up with the 50% Fibonacci retracement.
Stop loss: 44,647,61
Why we like it:
There is an overlap support that aligns with the 61.8% Fibonacci retracement.
Take profit: 45,703.35
Why we like it:
There is a swing high resistance.
Enjoying your TradingView experience? Review us!
Please be advised that the information presented on TradingView is provided to Vantage (‘Vantage Global Limited’, ‘we’) by a third-party provider (‘Everest Fortune Group’). Please be reminded that you are solely responsible for the trading decisions on your account. There is a very high degree of risk involved in trading. Any information and/or content is intended entirely for research, educational and informational purposes only and does not constitute investment or consultation advice or investment strategy. The information is not tailored to the investment needs of any specific person and therefore does not involve a consideration of any of the investment objectives, financial situation or needs of any viewer that may receive it. Kindly also note that past performance is not a reliable indicator of future results. Actual results may differ materially from those anticipated in forward-looking or past performance statements. We assume no liability as to the accuracy or completeness of any of the information and/or content provided herein and the Company cannot be held responsible for any omission, mistake nor for any loss or damage including without limitation to any loss of profit which may arise from reliance on any information supplied by Everest Fortune Group.

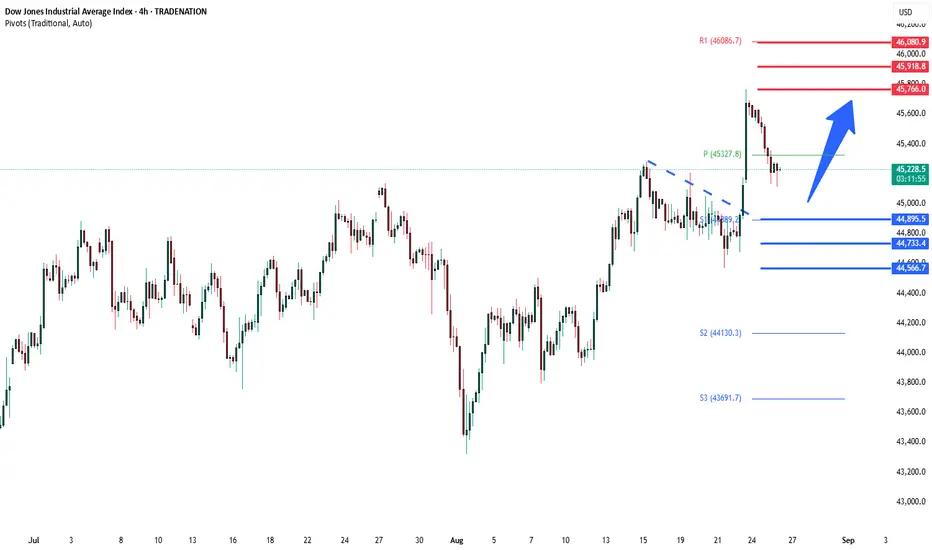
DowJones uptrend supported at 45050Key Support and Resistance Levels
Resistance Level 1: 45766
Resistance Level 2: 45920
Resistance Level 3: 46080
Support Level 1: 45050
Support Level 2: 44900
Support Level 3: 44733
This communication is for informational purposes only and should not be viewed as any form of recommendation as to a particular course of action or as investment advice. It is not intended as an offer or solicitation for the purchase or sale of any financial instrument or as an official confirmation of any transaction. Opinions, estimates and assumptions expressed herein are made as of the date of this communication and are subject to change without notice. This communication has been prepared based upon information, including market prices, data and other information, believed to be reliable; however, Trade Nation does not warrant its completeness or accuracy. All market prices and market data contained in or attached to this communication are indicative and subject to change without notice.

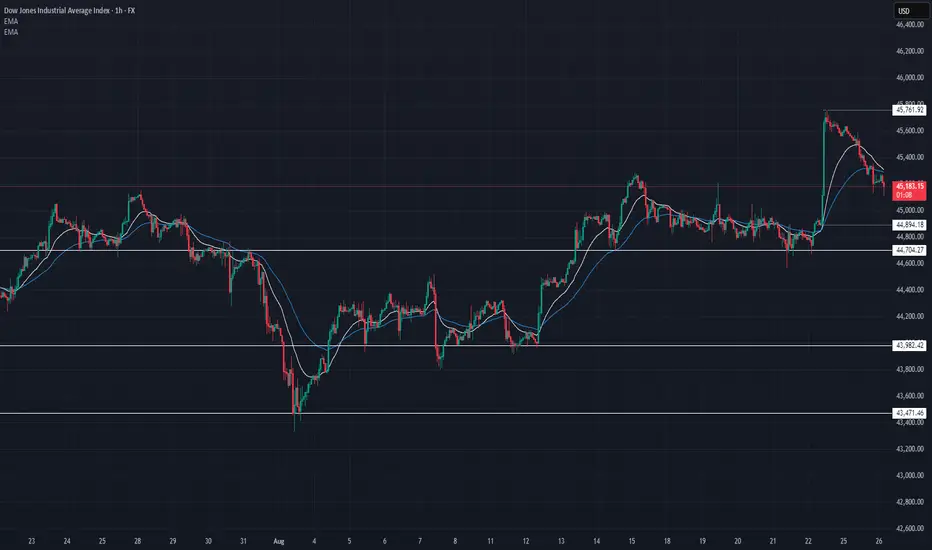
US30 Technical Breakdown – 08/26/2025📍 US30 Technical Breakdown – 08/26/2025
US30 ripped into 45,761 last week but failed to sustain momentum, rejecting hard and pulling back. Now trading around 45,170, price is consolidating just under the EMA cluster and recent highs.
Market is in decision mode: either reclaim 45,300–45,400 for continuation, or break down into the 44,800s.
📊 Current Market Behavior:
📉 Sharp rejection from 45,761 high
🔄 Sideways chop around 45,100–45,200
🧱 Key support holding near 44,894–44,704
⚠️ Momentum cooling after strong move up
📌 Key Levels:
🔹 Resistance Zones:
45,300–45,400 → EMA cluster / intraday pivot
45,500 → Short-term upside target
45,761 → Rejection high / ceiling
🔹 Support Zones:
44,894–44,704 → Crucial intraday support
44,200 → Mid-range demand
43,982–43,471 → Major downside liquidity zone
🧠 Bias:
🔄 Neutral to Slightly Bearish Intraday
Rejection from 45,761 gives sellers short-term control
Bulls need to reclaim 45,300+ to regain momentum
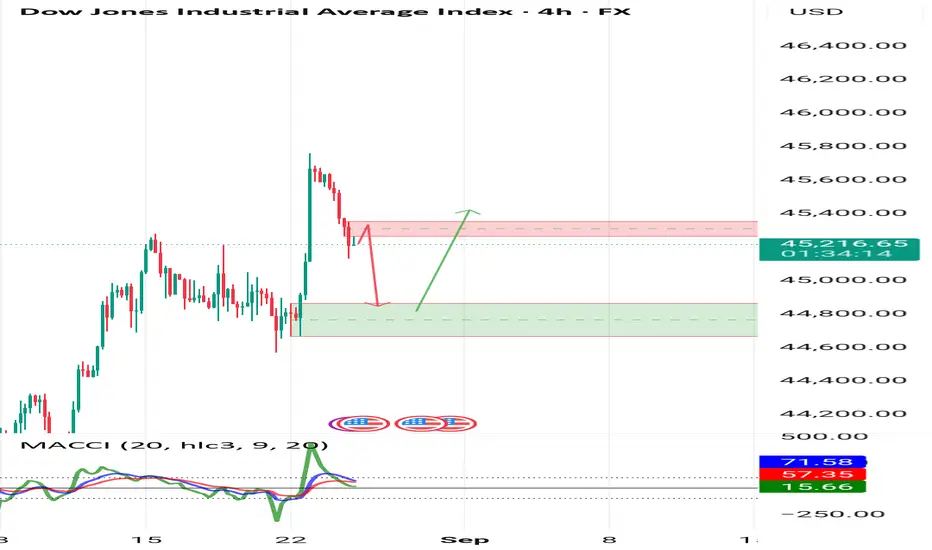
US30 / Dow Jones Technical AnalysisThe Dow Jones index is currently in a general uptrend, with a downward corrective movement on the hourly timeframe.
1️⃣ Bullish Scenario:
If a bullish momentum leads to a rebound from the 45,200 area and the price holds above 45,360, the index may target 45,700, with continued buying pressure potentially opening the way toward 46,000.
2️⃣ Bearish Scenario:
However, if the price remains below 45,200, this could push the index to test the 44,950 area.

A buy setup has formed for the Dow JonesThe previous resistance level has been broken, and now with a pullback to the identified zone, we can look for buying opportunities towards the higher level
US30: Will 45,110 Hold or Break Lower?US30 – Overview
Bearish Drop Reaches Target, Market Consolidates at Key Levels
The Dow Jones (US30) dropped over 450 points, exactly reaching the downside targets highlighted in the previous idea.
For now, the index is expected to test 45,110 and then consolidate within the 45,110 – 45,285 range until a breakout occurs.
🔹 Technical Outlook
A 1H close below 45,110 would extend the bearish move toward 44,950. A further break lower opens the path to 44,720 → 44,610.
A 1H close above 45,285 would shift momentum bullish, targeting 45,410 → 45,580.
🔹 Key Levels
Support: 45,110, 44,950 – 44,720
Resistance: 45,285 – 45,410 – 45,580
✅ Summary:
US30 has completed its bearish move and is now consolidating around the 45,110 pivot. Watch for a confirmed 1H close to determine whether the next leg is a continuation lower or a rebound higher.

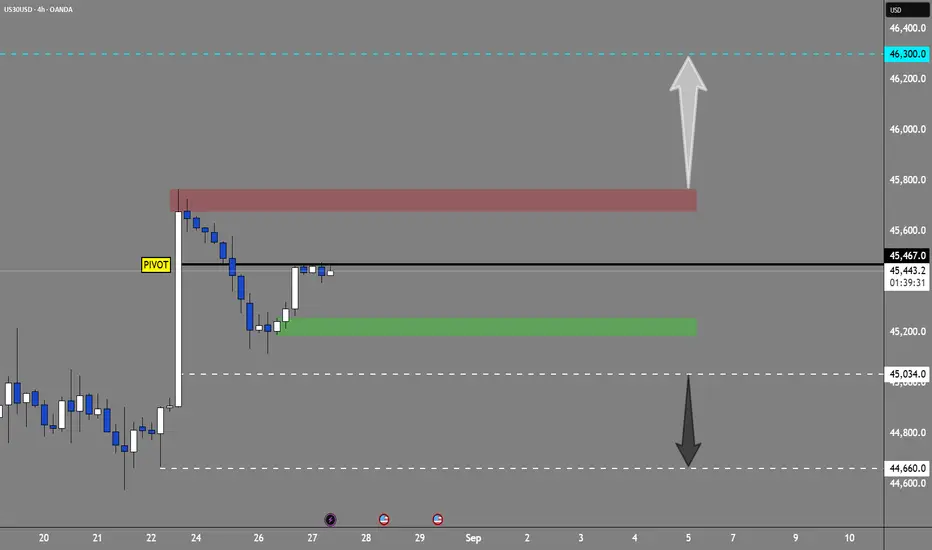
LONG DJ / US30 READINGContinuation after a PullBack On H1 timeframe
Another Entry can be done on the current Trend Line to the upside.
After a Breakout to the upside which is still valid for a Buy trade
Entry Price .... 45,230.00
DJ / US30... 45,230.0
S/L ...45,100.00
T/P ...45,320.0
Also looking at a final touch to 46,000.0 LEVEL.
And More

Dow Key Trading Levels Key Support and Resistance Levels
Resistance Level 1: 45766
Resistance Level 2: 45920
Resistance Level 3: 45080
Support Level 1: 44900
Support Level 2: 44733
Support Level 3: 44566
This communication is for informational purposes only and should not be viewed as any form of recommendation as to a particular course of action or as investment advice. It is not intended as an offer or solicitation for the purchase or sale of any financial instrument or as an official confirmation of any transaction. Opinions, estimates and assumptions expressed herein are made as of the date of this communication and are subject to change without notice. This communication has been prepared based upon information, including market prices, data and other information, believed to be reliable; however, Trade Nation does not warrant its completeness or accuracy. All market prices and market data contained in or attached to this communication are indicative and subject to change without notice.
Analysis of the Dow Jones movementThe overall trend is bullish, but for a proper entry it’s better to wait until the price reaches the green zone. At the same time, a risky short opportunity from the red zone is also possible.
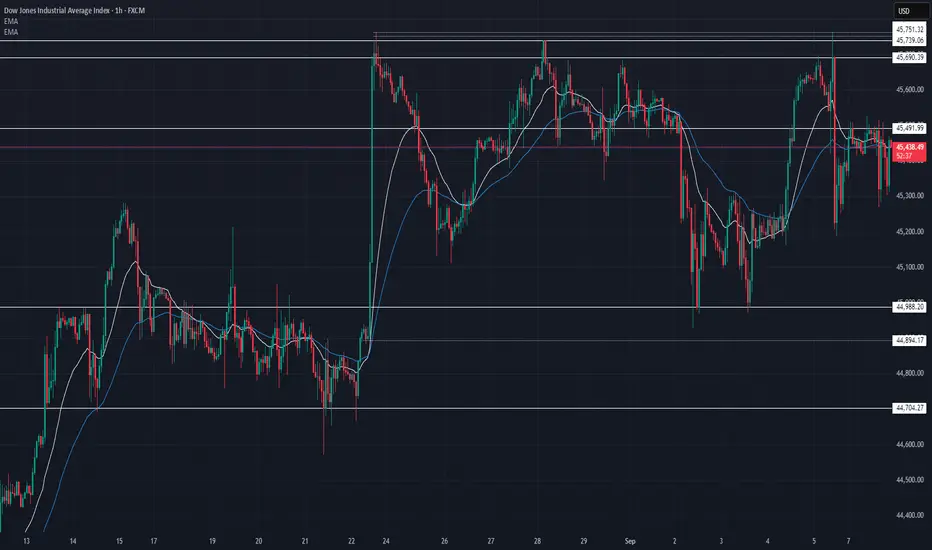
US30 Technical Breakdown – 09/08/2025📍 US30 Technical Breakdown – 09/08/2025
US30 continues to range tightly after failing to sustain the breakout above 45,750 resistance. Price is now chopping around 45,450, stuck between 45,490 resistance and 45,300–45,200 support.
The EMAs are flat and overlapping → confirming lack of trend direction. This is a compression zone before the next big move.
📊 Current Market Behavior:
🔄 Sideways chop between 45,200–45,700
📉 Multiple rejections at 45,750
🧱 Strong support holding around 45,200–45,300
⚠️ Volatility squeeze → expansion incoming
📌 Key Levels:
🔹 Resistance Zones:
45,490 → Intraday lid
45,690 → Minor supply
45,739–45,751 → Major rejection zone
🔹 Support Zones:
45,300–45,200 → Current demand pocket
44,988 → Mid-range floor
44,704 → Deeper support
🧠 Bias:
🔄 Neutral → Waiting for breakout
Above 45,750 = bullish continuation
Below 45,200 = bearish momentum shift

Us30 Trade Set Up Sep 8 2025FX:US30
www.tradingview.com
Price is currently at a 1h FVG and in between BSL/SSL so i want to see either liquidity level swept followed by a 1m/2m IFVG or RB formed and tested to continue higher.
I am overall bullish due to price making HH/HL but it is monday which usually has low volume so not expecting huge moves today

