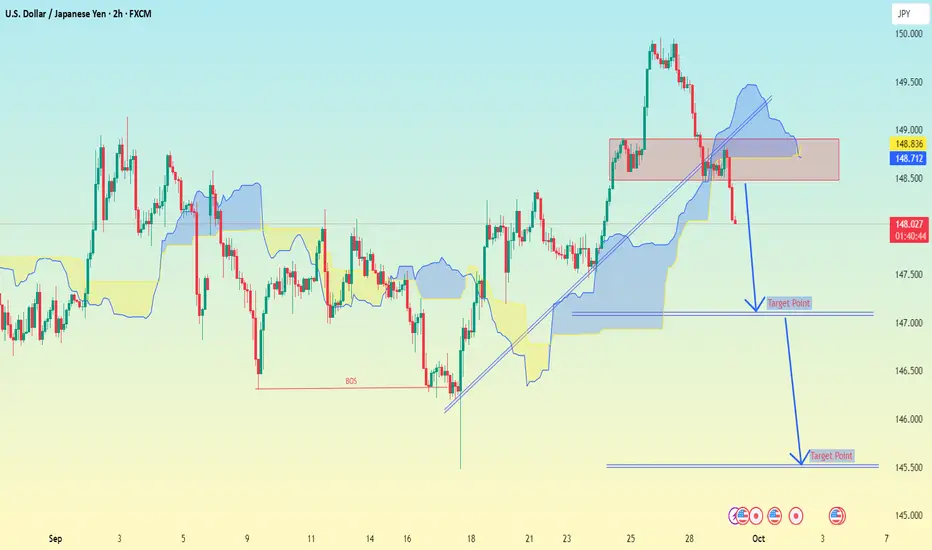
USD/JPY (2H timeframe) with Ichimoku..USD/JPY (2H timeframe) with Ichimoku + support/resistance + trendline.
Price is now around 148.04 after rejecting from the red resistance zone.
📊 Analysis:
Price broke the uptrend line.
Strong rejection from 148.80 – 149.00 resistance zone.
Bearish structure forming with downside targets marked
About U.S. Dollar / Japanese Yen
Also known as trading the “gopher” the USDJPY pair is one of the most traded pairs in the world. The value of these currencies when compared to each other is affected by the interest rate differential between the Federal Reserve and the Bank of Japan.
Related currencies
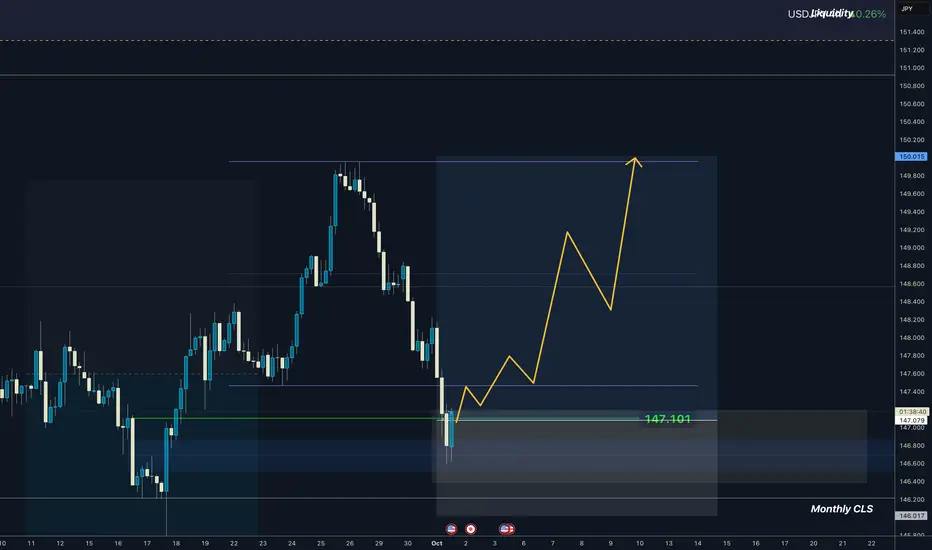
USDJPY Weekly CLS I Key Level OB - Model 1Monthly CLS range model 2 zone and there is weekly CLS playing.
Range manipualated and we can see change in order flow.
Strong DXY can push this up temporarily.
Trade safe
David Perk
DXY overview
30.09.25 Morning ForecastPairs on Watch -
FX:USDJPY
FX:GBPUSD
FX:EURAUD
A short overview of the instruments I am looking at for today, multi-timeframe analysis down to what I will be looking at for an entry. Enjoy!

USD/JPY) Bearish Trend analysis Read The captionSMC Trading point update
Technical analysis of USD/JPY Bearish Continuation Setup (1H Timeframe)
---
Chart Summary:
Pair: USD/JPY
Timeframe: 1H
Exchange: IC Markets
Current Price: 147.856
EMA 50: 148.439 (resistance)
EMA 200: 148.396 (resistance)
---
Key Observations:
1. Downtrend

USD/JPY: Strong Bearish Pattern SpottedThe 📉USDJPY pair formed a significant head and shoulders pattern on a four-hour timeframe.
The neckline was breached earlier today by a bearish candle with considerable momentum.
It seems plausible that the pair could experience a further decline at this point. The subsequent support level is ant

USDJPY Testing 147.800 as US Govt Shutdown Pressures DollarHey Traders, in today’s trading session we are monitoring USDJPY for a potential selling opportunity around the 147.800 zone. USDJPY is trading in a downtrend and currently in a correction phase, with price approaching this key support/resistance level.
Structure: Market bias remains bearish after

Strategic Buy Zones on My USDJPY 4H Analysis | Trader Tilki📊 USDJPY 4H Analysis: Buy Setup
Hello Guys,
Here’s my 4-hour USDJPY analysis for you.
These are the exact buy levels I’ll be watching:
🔵 1st BUY level: 147.018
🔵 2nd BUY level: 146.347
🔴 Stop level: 145.509 (or adjust based on your own margin)
🟢 Target level: 150.019
Risk-to-rew

USD/JPY - My Bullish Breakout 4th Quarter 2025🚨My Personal View and Forecast🚨
-----------------------------------------------------------------
USD/JPY: TARGET 156.950 BY DECEMBER 30, 2025
Executive Brief
Current Level: 147.44 (Oct 3, 2025)
Target: 156.950
Required Move: +9.5 points (6.5%)
Probability: 30-35% ➡ I am optimistic about Q4✅

USDJPY Will Go Up! Long!
Here is our detailed technical review for USDJPY.
Time Frame: 1D
Current Trend: Bullish
Sentiment: Oversold (based on 7-period RSI)
Forecast: Bullish
The market is on a crucial zone of demand 146.741.
The oversold market condition in a combination with key structure gives us a relatively strong

USDJPY 30Min Engaged ( Bullish Reversal Entry Detected )Time Frame: 30-Minute Warfare
Entry Protocol: Only after volume-verified breakout
🩸Bullish Reversal : 146.350
➗ Hanzo Protocol: Volume-Tiered Entry Authority
➕ Zone Activated: Dynamic market pressure detected.
The level isn’t just price — it’s a memory of where they moved size.
Volume is rising be

See all ideas
Summarizing what the indicators are suggesting.
Oscillators
Neutral
SellBuy
Strong sellStrong buy
Strong sellSellNeutralBuyStrong buy
Oscillators
Neutral
SellBuy
Strong sellStrong buy
Strong sellSellNeutralBuyStrong buy
Summary
Neutral
SellBuy
Strong sellStrong buy
Strong sellSellNeutralBuyStrong buy
Summary
Neutral
SellBuy
Strong sellStrong buy
Strong sellSellNeutralBuyStrong buy
Summary
Neutral
SellBuy
Strong sellStrong buy
Strong sellSellNeutralBuyStrong buy
Moving Averages
Neutral
SellBuy
Strong sellStrong buy
Strong sellSellNeutralBuyStrong buy
Moving Averages
Neutral
SellBuy
Strong sellStrong buy
Strong sellSellNeutralBuyStrong buy
Displays a symbol's price movements over previous years to identify recurring trends.
Frequently Asked Questions
The current rate of USDJPY is 149.390 JPY — it has increased by 0.14% in the past 24 hours. See more of USDJPY rate dynamics on the detailed chart.
The value of the USDJPY pair is quoted as 1 USD per x JPY. For example, if the pair is trading at 1.50, it means it takes 1.5 JPY to buy 1 USD.
The term volatility describes the risk related to the changes in an asset's value. USDJPY has the volatility rating of 1.33%. Track all currencies' changes with our live Forex Heatmap and prepare for markets volatility.
The USDJPY showed a −1.56% fall over the past week, the month change is a −0.38% fall, and over the last year it has increased by 1.68%. Track live rate changes on the USDJPY chart.
Learn how you can make money on rate changes in numerous trading ideas created by our community.
Learn how you can make money on rate changes in numerous trading ideas created by our community.
USDJPY is a major currency pair, i.e. a popular currency paired with USD.
Currencies are usually traded through forex brokers — choose the one that suits your needs and go ahead. You can trade USDJPY right from TradingView charts — just log in to you broker account. Check out the list of our integrated brokers and find the best one for your needs and strategy.
When deciding to buy or sell currency one should keep in mind many factors including current geopolitical situation, interest rates, and other. But before plunging into a deep research, you can start with USDJPY technical analysis. The technical rating for the pair is strong buy today, but don't forget that markets can be very unstable, so don't stop here. According to our 1 week rating the USDJPY shows the buy signal, and 1 month rating is buy. See more of USDJPY technicals for a more comprehensive analysis.