GALA/USDT — 4H Trend UpdateGALA/USDT — 4H Trend Update
Context
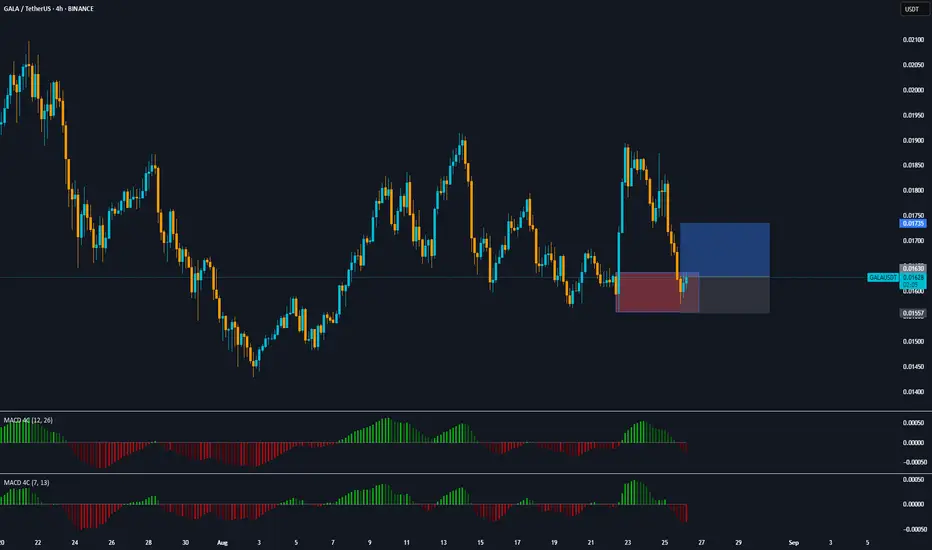
Price is testing 4H MA200 \~0.0165 and the demand zone 0.01690–0.01640.
RSI 4H is rising toward 50; a break >50 would confirm momentum shift.
Overhead supply: 0.01710–0.01730 (DMAs) and 0.01770–0.01790 (golden pocket).
Key Levels
Supports: 0.01690 • 0.01640 • 0.01600–0.01580 • 0.01560
Resistances: 0.01710–0.01730 • 0.01770–0.01790 • 0.01829 • 0.01848 • 0.01901
Short term (24–72h)
Bull case: 4H/1H close > 0.01730 + RSI>50 ⇒ targets 0.01770–0.01790 → 0.01829 → 0.01848.
Invalidation: swift drop back < 0.01690.
Bear case: rejection at 0.01710–0.01730 and 4H close < 0.01640 ⇒ move to 0.01600–0.01580, with “flush” risk to 0.01560.
Negation: reclaim 0.01710.
Mid term (1–3 weeks)
Bullish: acceptance > 0.01790 (GP) ⇒ test 0.01901; breakout opens 0.0194–0.0198 (1.272–1.414).
Bearish: daily closes < 0.01600 ⇒ range/downside toward 0.01560, possibly 0.0150–0.0143.
Candlestick signals to watch
Hammer/engulfing in 0.01640–0.01660 or SFP of the low (<0.0160 wick, close > 0.01640) = bounce trigger.
SFP at 0.01848–0.01901 = take-profit zone.
GALAXUSDT.3S trade ideas

GALAUSDT LONG POSITIONOn the 4-hour time frame, a suitable buying position has been created based on a demand range and hidden divergence in the MACD, and a 10% growth can be expected for the first target.
#GALA/USDT Sustain the Current Bullish Momentum !#GALA
The price is moving within an ascending channel on the 1-hour frame, adhering well to it, and is poised to break it strongly upwards and retest it.
We have support from the lower boundary of the ascending channel, at 0.01580.
We have a downtrend on the RSI indicator that is about to break and retest, supporting the upward move.
There is a key support area (in green) at 0.01600, which represents a strong basis for the upward move.
Don't forget one simple thing: ease and capital.
When you reach the first target, save some money and then change your stop-loss order to an entry order.
For inquiries, please leave a comment.
We have a trend of stability above the Moving Average 100.
Entry price: 0.01620
First target: 0.01687
Second target: 0.01791
Third target: 0.01907
Don't forget one simple thing: ease and capital.
When you reach the first target, save some money and then change your stop-loss order to an entry order.
For inquiries, please leave a comment.
Thank you.

GALA/USDT — Approaching Decision Zone: Breakout or Breakdown?📊 Chart Overview (4D Timeframe)
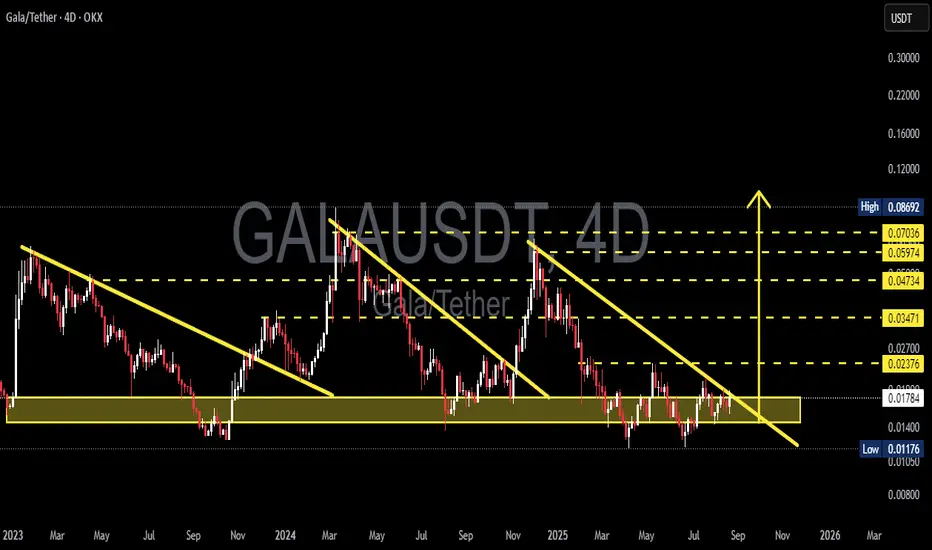
GALA price is currently trading within the multi-year accumulation zone (0.012 – 0.018 USDT) that has held since 2023. This area represents a major battleground between buyers (accumulation) and sellers (distribution).
The chart reveals a recurring descending resistance line (falling wedge structure) that has historically led to strong rallies whenever broken. Price is now pressing against the apex where the long-term support zone meets the descending trendline — a decisive move is imminent.
---
🔎 Technical Structure & Pattern
Accumulation Zone (0.012 – 0.018):
Strong multi-year support where buyers have consistently absorbed selling pressure.
Descending Trendline:
Connecting lower highs since 2023; acts as the “ceiling” for price. A breakout often triggers rapid upside.
Repetitive Falling Wedges:
At least 3 major falling wedges since 2023; each breakout → triggered a rally.
Key Resistances Ahead:
0.0237 → 0.0347 → 0.0473 → 0.0597 → 0.0703.
Range Extremes:
Major High: 0.0869 USDT
Major Low: 0.0117 USDT
---
✅ Bullish Scenario
1. Confirmation: 4D/daily close above descending trendline + reclaim 0.0237 USDT.
2. Short-term targets: 0.0347 → 0.0473.
3. Mid-term targets: 0.0597 – 0.0703 (major resistance cluster).
4. Potential rally: Based on past wedge breakouts, a +100% upside in weeks is not impossible.
📌 Key factor: Breakout must come with strong volume + successful retest.
---
❌ Bearish Scenario
1. Confirmation: Failure to break trendline + 4D close below 0.0117 USDT.
2. Downside targets: 0.010 → 0.008 zone.
3. Risk: Losing this multi-year accumulation would shift GALA into a deeper distribution phase.
📌 Caution: Beware of false breakdowns leading to short squeezes.
---
🎯 Conclusion
GALA is sitting at a make-or-break level:
🔼 Breakout → opens path to a strong rally.
🔽 Breakdown → risk of revisiting lower structural zones.
The falling wedge repetition increases the odds of a bullish breakout if confirmed.
0.0237 USDT remains the “gateway” to trend reversal.
---
⚡ Trader Notes
Avoid FOMO — wait for clear confirmation.
Always use risk management & proper position sizing.
Watch BTC and broader altcoin sentiment, as GALA’s move will likely follow macro market conditions.
#GALA #GALAUSDT #CryptoAnalysis #Altcoins #Breakout #SupportResistance #Accumulation #TechnicalAnalysis #SwingTrading #CryptoMarket
GALA/USDT (4H Analysis)GALA/USDT (4H Analysis)
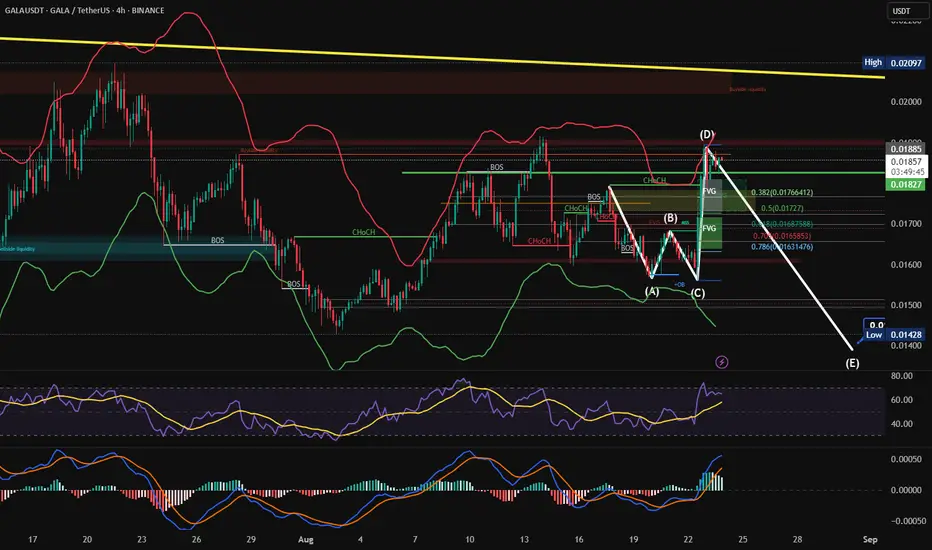
The chart illustrates a detailed Elliott Wave structure forming within the 4H timeframe. Price action recently completed a corrective move (A → B → C) and extended into point (D) before showing potential signs of reversal.
Resistance Zones:
Price is testing strong supply around 0.0188 – 0.0192, aligned with Fibonacci retracement levels and previous liquidity zones.
Support & Downside Targets:
If rejection holds, the market may follow the projected (D → E) leg down toward 0.0145 – 0.0140, completing the corrective cycle.
Indicators:
RSI is approaching overbought conditions, hinting at possible bearish divergence.
MACD shows strong momentum, but a cross-down could confirm reversal.
Bollinger Bands suggest price touched the upper band and may revert inward.
Key Levels to Watch:
Resistance: 0.01885 / 0.02000
Mid Support: 0.0172 – 0.0165 (Fib 0.5–0.786)
Strong Support: 0.0145 – 0.0140
⚠️ Outlook: The short-term bias remains corrective bearish unless price breaks and consolidates above 0.0200, which could invalidate the (E) target and open the way for a bullish continuation.
GALA.USDTEvery price correction in Gala is a buying opportunity.
So, we can wait for the channel's upper limit of $0.02 to be reached.
But if the price can confidently overcome $0.02, a 200% increase is guaranteed.

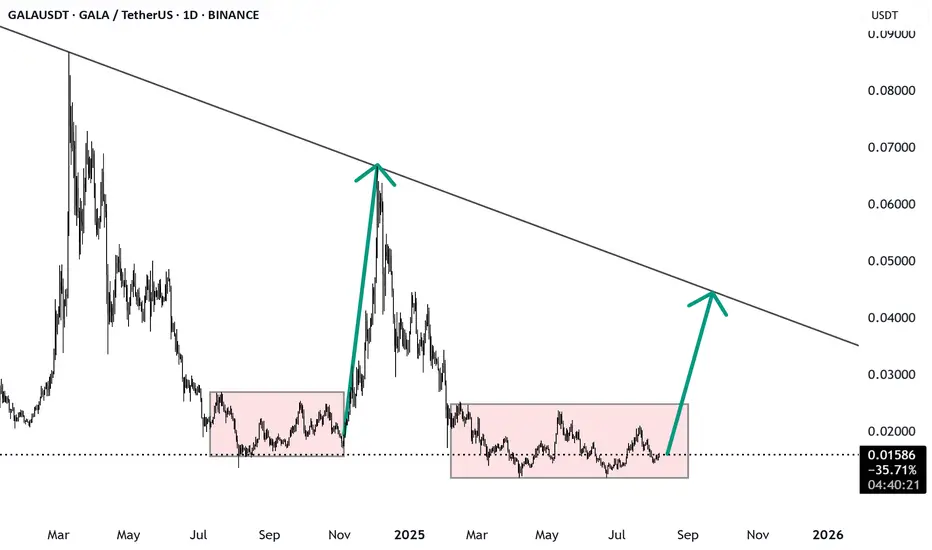
Gala Games Update · Bottom Range & Opportunity Buy Zone ActiveGala Games (GALAUSDT) is still trading at bottom prices. The chart is very similar to MANAUSDT. I will describe the same signals here.
GALA is not moving within a downtrend. GALAUSDT has been sideways for 966 days. The sideways period was activated after a low December 2022. As soon as the previous bear market ended, GALA went sideways within a wide range.
The current zone, bottom prices, is also the "opportunity buy zone." This is a bullish zone and I will prove this to you now.
When Gala Games entered the current zone back in December 2022, a small bullish jump happened. The zone is the one marked light purple on the chart within the big light blue channel.
In September-October 2023 support was activated again and GALAUSDT moves up. Then this is repeated in 2024, a major low in August and this led to a new bullish jump. This jump ended December 2024 with a lower high.
The last peak produced the chart we have now. GALAUSDT produced a double-bottom between April and June 2025. April and June is when most of the altcoins market hit bottom. This pair confirmed the market low by testing it twice and it holds.
The same zone that produced bullish action three times already in the past is active again now but this time things are different. In the past the consolidation period would last only a few days or weeks compared to more than 6 months. The current accumulation period is much longer than before.
A stronger period of accumulation (preparation) implies a very strong bull market next.
If you have any doubts, remember, Ethereum and Chainlink also produced a low 7-April but already moved up strong. The rest of the market will follow. Gala Games is going up.
Patience is key.
Namaste.

GALA 1D Triangle Compression, Reversal or Breakdown Next?ALA is compressing inside a symmetrical triangle, with price sitting at ascending support near 0.0160. This level has repeatedly acted as a base for short-term reversals.
A support reversal here could send price back to test 0.0188 resistance.
A breakout above resistance would confirm bullish continuation inside the pattern.
A breakdown under 0.0160 opens the door to deeper downside toward 0.0140 demand.
Momentum is neutral on the daily Stoch RSI, meaning the next move depends on whether bulls defend support or bears force a breakdown.

#GALA/USDT#GALA
The price is moving within an ascending channel on the 1-hour frame, adhering well to it, and is poised to break it strongly upwards and retest it.
We have support from the lower boundary of the ascending channel, at 0.1640.
We have a downtrend on the RSI indicator that is about to break and retest, supporting the upward move.
There is a key support area (in green) at 0.01580, which represents a strong basis for the upward move.
Don't forget one simple thing: ease and capital.
When you reach the first target, save some money and then change your stop-loss order to an entry order.
For inquiries, please leave a comment.
We have a trend of stability above the Moving Average 100.
Entry price: 0.01780
First target: 0.01800
Second target: 0.01886
Third target: 0.01952
Don't forget one simple thing: ease and capital.
When you reach the first target, save some money and then change your stop-loss order to an entry order.
For inquiries, please leave a comment.
Thank you.

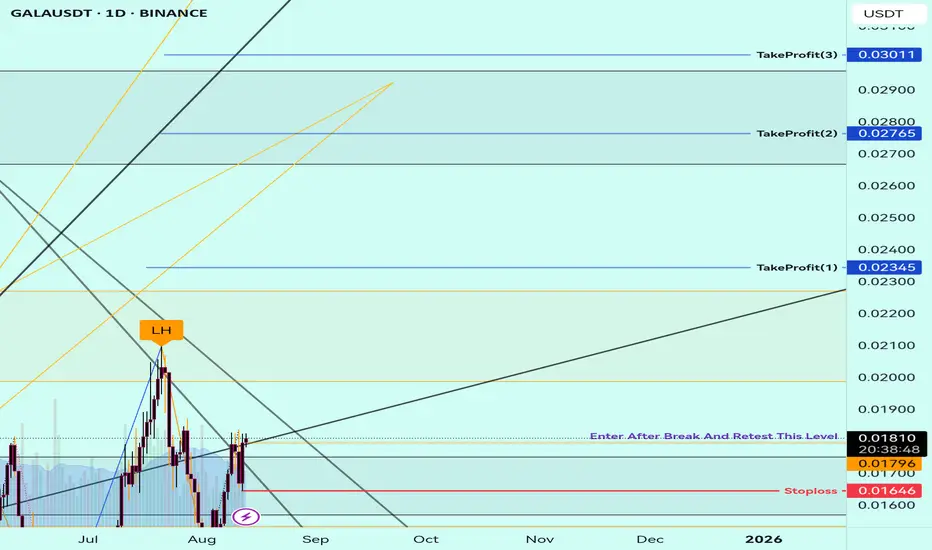
GALA Breakout Alert!🚨 INDEX:GALA Breakout Alert! 🚨
INDEX:GALA is currently testing the red resistance zone 🔴
If price breaks out, the first target will be the green line level 🎯
A confirmed breakout here would signal bullish continuation and could push price higher ✅


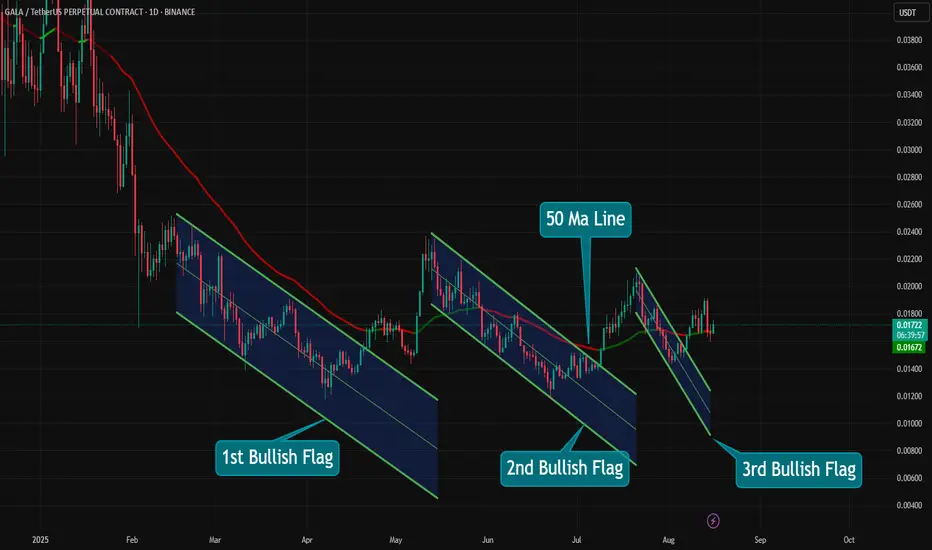
GALA Coin 3rd Bullish Flag Pattern Formation Retest ConfirmedGALA Coin 3rd Bullish Flag Pattern Formation Retest Confirmed👀↗️
💵 Tp 1 : $ 0.02095
💵 Tp 2 : $ 0.02210
💵 Tp 3 : $ 0.02510
💵 Tp 4 : $ 0.02990
💵 Tp 5 : $ 0.04710
GALALong-term predictions (up to the next decade)
August 2025: Average predicted price $0.02246 (~49% growth)
Continuation of the upward trend until December with an average of about $0.03784 (over 100% growth)
2026: Average $0.0376 (potential return ≈ 2x)
Current status: Price around $0.0186–0.0188 with limited volatility.
Short-term: Possible slight growth to around $0.01877 (~5% growth).
Medium-term to next year: Forecasts vary widely—from a decline to the mid-$0.017 range (3commas) to a growth to $0.037
Long-term: Some optimistic scenarios have predicted a price of $1 and above, but these are highly hypothetical and involve high risk.

GALA: The Calm Before the Storm?#GALA has been sleeping at the bottom for weeks… but smart money might already be loading up. 📈
💥 Accumulation phase + strong support = potential breakout brewing.
📍 Waiting for:
1️⃣ Break above resistance
2️⃣ Retest for confirmation
3️⃣ Long entry with tight risk
This could be the move everyone talks about… or the one they regret missing.
🔥 What’s YOUR call — breakout or fakeout?
#GALA #Crypto #Altcoins #Breakout #TradingView

#GALA/USDT Sustain the Current Bullish Momentum or Will it Fal#GALA
The price is moving within an ascending channel on the 1-hour frame, adhering well to it, and is poised to break it strongly upwards and retest it.
We have support from the lower boundary of the ascending channel, at 0.01420.
We have a downtrend on the RSI indicator that is about to break and retest, supporting the upside.
There is a key support area (in green) at 0.01392, which represents a strong basis for the upside.
Don't forget one simple thing: ease and capital.
When you reach the first target, save some money and then change your stop-loss order to an entry order.
For inquiries, please leave a comment.
We have a trend of stability above the Moving Average 100.
Entry price: 0.01550
First target: 0.01600
Second target: 0.01658
Third target: 0.01727
Don't forget one simple thing: ease and capital.
When you reach the first target, save some money and then change your stop-loss order to an entry order.
For inquiries, please leave a comment.
Thank you.

Buy Trade Strategy for GALA: Tapping into Blockchain GamingDescription:
This trading idea highlights GALA, the native token of Gala Games, a blockchain-based gaming ecosystem aiming to redefine the gaming industry by giving players true ownership of in-game assets. GALA powers transactions, governance, and rewards within the platform, enabling gamers and developers to participate in a decentralized and player-focused economy. With the rising popularity of play-to-earn models, NFTs, and metaverse integrations, Gala Games has positioned itself as a leading innovator in blockchain gaming, and GALA stands to benefit from this expanding market. Strategic partnerships, an active community, and ongoing game development further strengthen its fundamental outlook.
Still, the cryptocurrency market is volatile, and GALA is not immune to risks stemming from regulatory changes, competition, and market sentiment. As such, a disciplined risk management approach is essential when considering any position.
Disclaimer:
This trading idea is for educational purposes only and does not constitute financial advice. Investing in cryptocurrencies like GALA involves substantial risks, including the possibility of losing your entire investment. Always perform comprehensive research, evaluate your financial situation, and consult with a qualified financial advisor before making investment decisions. Past performance is not indicative of future results.
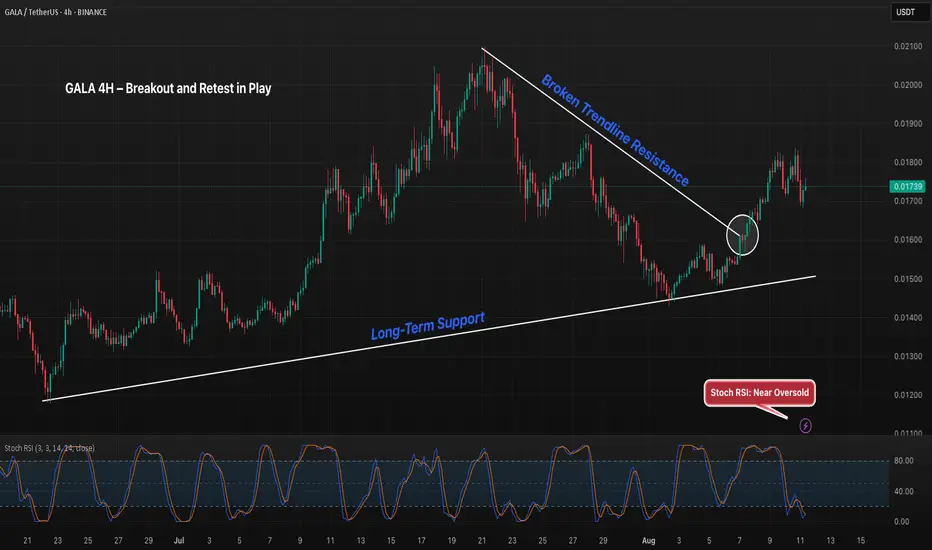
GALA 4H – Trendline Breakout Holding Above $0.017 Support?GALA broke above its descending trendline on August 7, confirming a shift in short-term momentum. Price is now consolidating above the $0.017 level while maintaining a higher low structure supported by the long-term ascending trendline. Stoch RSI is nearing oversold, which could set the stage for a bounce if buyers defend this zone. A close above $0.018 could target $0.0195+, while a breakdown below $0.017 risks retesting $0.015 support.
#GALA #GALAUSD #GALAUSDT #Analysis #Eddy#GALA #GALAUSD #GALAUSDT #Analysis #Eddy
A reversal structure has formed on the weekly and daily time frames, and the necessary confirmations have been given on the weekly time frame. Considering the structure formed on the above time frame, as well as the behavior of this currency in the past chart, it is expected that this currency will perform a good pump.
I have identified the important supply and demand zones of the higher timeframe for you.
This analysis is based on a combination of different styles, including the volume style with the ict style.
Based on your strategy and style, get the necessary confirmations for this analysis to enter the trade.
Don't forget about risk and capital management.
The responsibility for the transaction is yours and I have no responsibility for your failure to comply with your risk and capital management.
💬 Note: The red order block cannot stop the growth of the price of this currency and by 10 cents this currency will be pumped more than 400%.
Be successful and profitable.

GALA 4H – Trendline Test in Progress, Can Bulls Confirm Break?GALA is pressing against its descending trendline after a strong rally from the 0.0145 demand zone. Price is now testing this level with EMAs converging just below, creating a possible breakout confluence.
If bulls can secure a close above the trendline and hold, the breakout could open the path toward the mid-0.017s and beyond. However, with Stoch RSI deep in overbought territory, a pullback to retest the 0.01536 or even 0.0145 support zone remains possible before continuation.
Key watchpoints:
– Trendline break confirmation with strong close
– Pullback potential due to overbought conditions
– Support levels at 0.01536 and 0.0145 as key bounce zones

GALAUSDT Breakout soon ? from the box ? GALAUSDT is currently consolidating within a box pattern, and a breakout appears imminent. A similar box pattern formed last year, which was followed by a strong upward rally—this setup is showing similar characteristics now.
Additionally, the 4-hour chart indicates a bullish wedge breakout, suggesting that the price is likely to test the upper resistance of the box. Whether it breaks through that level will be crucial to watch in the coming sessions.
GALAUSDTPhase 1: Breakout from FVG
• Break above the major FVG zone at $0.028–0.030 is crucial.
• A successful breakout and retest could trigger momentum.
• This marks the beginning of a structural shift.
⸻
Phase 2: Structural Resistance
• Key levels to test:
• $0.0345 – historical local top.
• $0.038 – key supply zone.
• Market may consolidate or form a bullish flag before the next move.
⸻
Phase 3: Mid-run Rally
• Break above $0.038 opens the way toward:
• $0.042 – $0.045 resistance block.
• Expect light pullbacks along the way.
⸻
Phase 4: Acceleration Phase
• Once above $0.045, momentum strengthens.
• Eyes on:
• $0.052
• Followed by $0.058 – $0.060 – a strong psychological and structural zone.
⸻
Phase 5: Push to $0.08
• If price closes confidently above $0.060:
• We could see a run to $0.067 – $0.070
• Then : $0.078 – $0.080
Follow me 😉

GALA/USDT – ABCDE Correction & Breakout PotentialGALA/USDT – ABCDE Correction & Breakout Potential
The chart illustrates a well-defined ABCDE corrective structure:
🔹 Point (A): Rejection at key resistance near 0.02100
🔹 Point (B): Pullback to the 0.5–0.618 Fibonacci zone
🔹 Point (C): Short-term rebound & FVG mitigation
🔹 Point (D): Strong support reaction on confluence of:
✅ 0.786 Fib retracement
✅ Long-term trendline (yellow)
✅ Demand zone (bottom red box)
📈 Next Move?
If (D) holds, the pattern suggests a move toward (E), targeting the breakout above descending resistance near 0.02292, aligning with a macro FVG zone and prior supply.

galausdtgala may complete deep crab harmonic pattern .we might see one more dip and chance of entry at lps
