GBP_CAD RESISTANCE AHEAD|SHORT|
✅GBP_CAD has been growing recently
And the pair seems locally overbought
So as the pair is approaching
A horizontal resistance of 1.8669
Price decline is to be expected
SHORT🔥
✅Like and subscribe to never miss a new idea!✅
GBPCAD trade ideas

GBPCAD possible bearish for 1.8480#gbpcad tested 3 months old trendline resistance level 1.8830. Daily supply zone formed at the top. price may test 1.8755-95 area for another leg lower. stop loss above 1.8840, target: 1.8480


GBPCAD showing a correction start Major cycle finishing wave 3 and go be a complex correction wave 4 . Make more sense to 38%fb. And let's go to wave 5

GBPCAD SELL ANALYSIS.I’m looking for a sell opportunity if price breaks below the trend line. Technically price has resisted the top twice and it looks promising for a sell if we’d get a break below the trend line. I’ll update this idea once it’s due for entry.

CANADIAN DOLLAR THE WEAKEST OF THE DAYGBPUSD - From 12.2.2025 British Pound broke SMA 30 and price start a bull run for 12 days. Price is now on very strong supply zone from 20.9.2024. Both of scenarios (BUY/SELL) have high possibilities but from the most recent performance of the pair a buy scenario is more favourable . If price break the 1.82313 ( the highest from 2019) next stop is the highest of 2018.

GBP-CAD Bearish Breakout! Sell!
Hello,Traders!
GBP-CAD made a bearish
Breakout of the key horizontal
Level of 1.8740 and the
Breakout is confirmed so
We are bearish biased and
We will be expecting a
Further bearish move down
Sell!
Comment and subscribe to help us grow!
Check out other forecasts below too!
Disclosure: I am part of Trade Nation's Influencer program and receive a monthly fee for using their TradingView charts in my analysis.

Nice wedge pattern on GCThere is a nice wedge pattern on GC. Followed by bank of England stays with the interest rate, the trend is forecasted to be continue towards the next resistance, or else pattern fail. Traders can start to react regarding respective strategy. Trade safe.
GBPCAD corrective pullback The GBPCAD remains in a bullish trend, with recent price action showing signs of a corrective pullback within the broader uptrend.
Support Zone: 1.8720 – a key level from previous consolidation. Price is currently testing or approaching this level.
A bullish rebound from 1.8720 would confirm ongoing upside momentum, with potential targets at:
1.8835 – initial resistance
1.8880 – psychological and structural level
1.8920 – extended resistance on the longer-term chart
Bearish Scenario:
A confirmed break and daily close below 1.8720 would weaken the bullish outlook and suggest deeper downside risk toward:
1.8680 – minor support
1.8640 – stronger support and potential demand zone
Outlook:
Bullish bias remains intact while the GBPCAD holds above 1.8720. A sustained break below this level could shift momentum to the downside in the short term.
This communication is for informational purposes only and should not be viewed as any form of recommendation as to a particular course of action or as investment advice. It is not intended as an offer or solicitation for the purchase or sale of any financial instrument or as an official confirmation of any transaction. Opinions, estimates and assumptions expressed herein are made as of the date of this communication and are subject to change without notice. This communication has been prepared based upon information, including market prices, data and other information, believed to be reliable; however, Trade Nation does not warrant its completeness or accuracy. All market prices and market data contained in or attached to this communication are indicative and subject to change without notice.

GBP/CAD SENDS CLEAR BEARISH SIGNALS|SHORT
GBP/CAD SIGNAL
Trade Direction: short
Entry Level:1.875
Target Level: 1.843
Stop Loss: 1.896
RISK PROFILE
Risk level: medium
Suggested risk: 1%
Timeframe: 1D
Disclosure: I am part of Trade Nation's Influencer program and receive a monthly fee for using their TradingView charts in my analysis.
✅LIKE AND COMMENT MY IDEAS✅

Sell GBP/CAD at top of rising channelThere is a lot of high impact data for both the CAD & USD pairs this week. GBP/CAD price action is at a very important area now and quite often in situations like this a false breakout is possible. Therefore I am selling the pair just before the top of the range and rising channel.
Sell Limit : 1.8855 top of channel / strong resistance (false breakout)
Stop : 1.8957 above top of channel
Profit : 1.8650 strong support
Risk 1 : 2 stop is 102 pips

GBP CAD long trade: Fundamental analysis In line with expectations UK employment data 'likely' keeps the BOE on a slow rate cut path.
The CAD had strength yesterday, coinciding with a rise in the price of oil, giving the CAD what I believe was 'fake strength'. Particularly as calls are growing for a raster pace of BOC rate cuts.
The obvious alternative here would be a USD short, but I like the fact the CAD had a 'pullback' yesterday.
The risk to the trade is 'negative market sentiment', another rise in the price of oil, possibly US data or out of the blue BOC hawkish rhetoric.

GBPCADPotential swing trade - Short
- LQ sweep of weekly high ( blue line )
- loss of momentum to the upside
- Bearish engulfing candles
- CHOCH formed
- Bearish FVG forming
- waiting for price to move back up towards buy side liquidity before sellers step in and take over

GBPCAD / long scenario**Currency Pair:** GBPCAD
**Structure Timeframe:** 4H
**Trading Timeframe:** 1H
**Entry Timeframe:** 15m
**Overall Direction:** Bullish
**Directional Scenario:** Mid-term timeframe is not aligned
**Scenario Description:** Entry in a nested zone of the trading timeframe within the structure timeframe.
If the orange trendline remains intact while testing the purple zones, a long position can be initiated in the purple zones with a stop loss below the blue zone. It is preferable for the opposing red zone to be broken before the price reaches the purple zone. Otherwise, for greater certainty, it is advisable to look for a confirmation signal on the 15m or 5m timeframe when the purple zone is being tested.


GBP_CAD WILL GO UP|LONG|
✅GBP_CAD is trading in an
Uptrend and the pair made
A bullish rebound from the
Horizontal support of 1.8740
So we are bullish biased and
We will be expecting a
Further bullish move up
On Monday
LONG🚀
✅Like and subscribe to never miss a new idea!✅

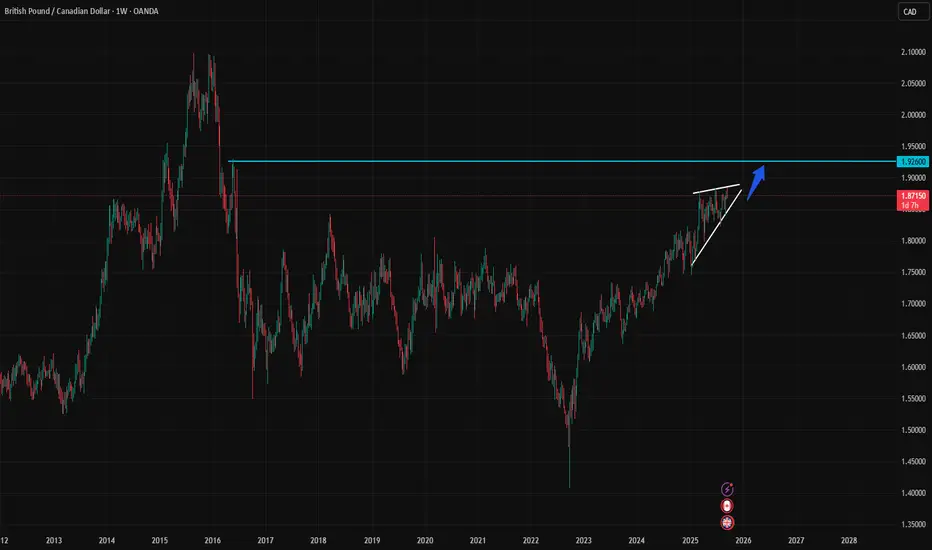
SHORT ON GBP/CADGBP/CAD has a nice rising wedge at a major supply zone.
Price has failed to make a Higher High and is now starting to make Lower Highs.
Looking to catch 300-400 pips to the downside over the next week or so.

GBPCAD bullish above support at 1.8720The GBPCAD remains in a bullish trend, with recent price action showing signs of a corrective pullback within the broader uptrend.
Support Zone: 1.8720 – a key level from previous consolidation. Price is currently testing or approaching this level.
A bullish rebound from 1.8720 would confirm ongoing upside momentum, with potential targets at:
1.8835 – initial resistance
1.8880 – psychological and structural level
1.8920 – extended resistance on the longer-term chart
Bearish Scenario:
A confirmed break and daily close below 1.8720 would weaken the bullish outlook and suggest deeper downside risk toward:
1.8680 – minor support
1.8640 – stronger support and potential demand zone
Outlook:
Bullish bias remains intact while the GBPCAD holds above 1.8720. A sustained break below this level could shift momentum to the downside in the short term.
This communication is for informational purposes only and should not be viewed as any form of recommendation as to a particular course of action or as investment advice. It is not intended as an offer or solicitation for the purchase or sale of any financial instrument or as an official confirmation of any transaction. Opinions, estimates and assumptions expressed herein are made as of the date of this communication and are subject to change without notice. This communication has been prepared based upon information, including market prices, data and other information, believed to be reliable; however, Trade Nation does not warrant its completeness or accuracy. All market prices and market data contained in or attached to this communication are indicative and subject to change without notice.

11-09-2025 GBPCADAs shown in the figure: 1H Bearish Shark
The market is not always chaotic and disorderly, and there is a precise geometric beauty hidden in price fluctuations. The harmonic form long strategy is a powerful tool for accurately identifying potential market reversal points based on the Fibonacci ratio. When the form forms perfectly at the key support level, it often indicates the depletion of bearish momentum and the initiation of bullish trends.


Wicky rangeSometimes the market just wants to test your patience, like this position of mine that got into trouble right after being triggered. It went into such a confusing range, with constant wicks, as if it was waiting for my entry just to hunt stops — and it’s been like this for almost 14 hours. But in the end, this is all part of the game. ✅

GBP-CAD Will Keep Growing! Buy!
Hello,Traders!
GBP-CAD is trading in an
Uptrend and the pair broke
The key horizontal level
Of 1.8723 so we are
Bullish biased and we
Will be expecting a
Further bullish move up
Buy!
Comment and subscribe to help us grow!
Check out other forecasts below too!
Disclosure: I am part of Trade Nation's Influencer program and receive a monthly fee for using their TradingView charts in my analysis.

