GBPCAD – Triple Tap Trouble!GBPCAD has been trading within a well-defined range, with price rejecting the 1.8850 resistance zone multiple times in the past.
Each test of this area has led to strong bearish moves, highlighting its significance as a supply zone.
Here’s what the chart shows:
🔴 Resistance Zone: Price is approaching the upper bound of the range, where sellers have consistently stepped in.
🔵 Support Zone: The 1.8300 area remains a solid demand zone, holding price higher on several occasions.
📈 Rising Channel: The latest bullish leg is developing inside an ascending channel, but momentum is slowing near resistance.
⚠️ Short Opportunity: As long as price trades below the resistance, the area remains attractive for short setups targeting the mid-range or lower bound.
Confirmation with bearish candlestick patterns will strengthen the case for a downside move.
📌 Will GBP/CAD respect its range and roll over once again, or will the bulls finally break through?
This analysis is for educational purposes only, not financial advice. Always manage risk properly before taking trades.
📚 Stick to your trading plan regarding entries, risk management, and trade execution.
Good luck!
All Strategies Are Good; If Managed Properly!
~Richard Nasr
GBPCAD trade ideas

Market Watch – GBP/CAD Triple Top FormingGBP/CAD is showing a potential Triple Top:
Structure: Rejection at the 3rd touch after a strong impulsive move up
Momentum: Solid, with clear divergence forming
Volume: Still low at 60 — needs to push higher for confirmation
Signal: Waiting on a decisive Engulfing Candle to trigger
⚔️ War Room Lesson: Structure may set the stage, but we never act until all the soldiers line up — Structure, Signal, Volume, and Momentum. Right now, this one is on the watchlist.

GBPCAD LIVE CHARTwe just close trading for the month of august which was obviously bullish. thus my expectation remains unchange for the month of September, although i am bullish but before expecting higher prices on gbpcad i would prefer that we grap the sellside liquidity sitting below 1.8450 price level before expecting price attack buyside at 1.87500 price level.
please note that this is my honest opinion from a technical analysis point of view and no fundamentals.
This is not a signal service. Be safe

TP1/TP2 +300/+600 pips GBPCAD Advanced XABCD Short From S/R 🔸Hello traders, let's review the 1 hour chart for GBPCAD. Strong gains off the lows recently, however price getting overextended and expecting reversal later at/near PRZ/D.
🔸Speculative XABCD structure defined by point X 8795 point A 8300 point B 8720 point C 8440 point D/PRZ 8970 .
🔸Currently most points validated, point D/PRZ is pending.
Short sell at PRZ/D TP1/TP2 +300/+600 pips, swing trade setup.
🔸Recommended strategy for GBPCAD traders: Higher Risk BUY at market SL 60
TP exit at PRZ/D overhead resistance at 8970. Lower risk reversal trade setup:
short from PRZ/D 8970 SL 80 pips TP1 +300 TP2 +600 pips. swing trade setup.
🎁Please hit the like button and
🎁Leave a comment to support our team!
RISK DISCLAIMER:
Trading Futures , Forex, CFDs and Stocks involves a risk of loss.
Please consider carefully if such trading is appropriate for you.
Past performance is not indicative of future results.
Always limit your leverage and use tight stop loss.

SELL GBPCAD GBPCAD Sell Idea. GBPCAD may resume the bearish trend from this area of resistance. Two patterns can be observed on the daily chart. A bearish flag appears on a smaller time scale whilst a massive head and shoulders pattern can be seen as well.
@WolfNtsu I know you have been waiting on this one sir

GC shortsprice has shift in the LTF signaling beginning of a shorterm to med bearish momentum depending on how the price will act


GBPCAD Strong Long ConfirmationsWait for a breakout and retest of this H1 TF bull flag and look to the left to identify current structure for TPs.
Overall bias is Bullish.

GBPCAD Trendline Sell IdeaWith the RSI at 64.84, an overbought level, and the current price at the upper trendline. Hence, based on these conditions, I anticipate a sell on the GBPCAD currency pair.

GBP/CAD – Bearish Pressure Building In 3 StepsGBP/CAD – Bearish Pressure Building 🚨
Pair: GBP/CAD
Bias: Bearish
The GBP/CAD pair is showing renewed downside momentum, with sellers regaining control after recent weakness in the British Pound.
🔑 Technical Breakdown
Fibonacci Retracement 📉
Price has broken below key Fibonacci retracement zones, indicating that bulls have lost ground.
Sellers are driving the market toward deeper levels, confirming bearish continuation.
MACD Crossover 🔻
The MACD line has crossed below the signal line, signaling strong downside momentum.
This aligns with the fib breakdown, giving confluence to the bearish bias.
Trend Context 📊
On higher timeframes, GBP/CAD has been trading under heavy resistance.
With CAD showing relative strength, further declines in GBP/CAD are likely.
📌 Trading Plan
Sell Bias: Look for short entries on pullbacks toward broken fib levels.
Targets: Next Fibonacci zones (0.618 → 0.786 retracement area).
Stop Loss: Above the broken fib level or recent swing high.
⚠️ Disclaimer: This analysis is for educational purposes only. Use a simulation account first to practice execution. Always apply risk management and a clear profit-taking strategy before trading with real capital.

GBP/CAD BEARISH BIAS RIGHT NOW| SHORT
GBP/CAD SIGNAL
Trade Direction: short
Entry Level: 1.867
Target Level: 1.854
Stop Loss: 1.875
RISK PROFILE
Risk level: medium
Suggested risk: 1%
Timeframe: 8h
Disclosure: I am part of Trade Nation's Influencer program and receive a monthly fee for using their TradingView charts in my analysis.
✅LIKE AND COMMENT MY IDEAS✅


GBP_CAD BEARISH BIAS|SHORT|
✅GBP_CAD has hit a key
Structure level of 1.8740
Which implies a high
Likelihood of a move down
As some market participants
Will be taking profit from
Their long positions
While others will find this
Price level to be good for selling
So as usual we will have a
Chance to ride the wave
Of a bearish correction
SHORT🔥
✅Like and subscribe to never miss a new idea!✅

GBP-CAD Short From Resistance! Sell!
Hello,Traders!
GBP-CAD shot up sharply
And hit a horizontal resistance
Of 1.8740 from where the pair
Is already making a local
Pullback and we will be
Expecting a further bearish
Move down on Monday
Buy!
Comment and subscribe to help us grow!
Check out other forecasts below too!
Disclosure: I am part of Trade Nation's Influencer program and receive a monthly fee for using their TradingView charts in my analysis.

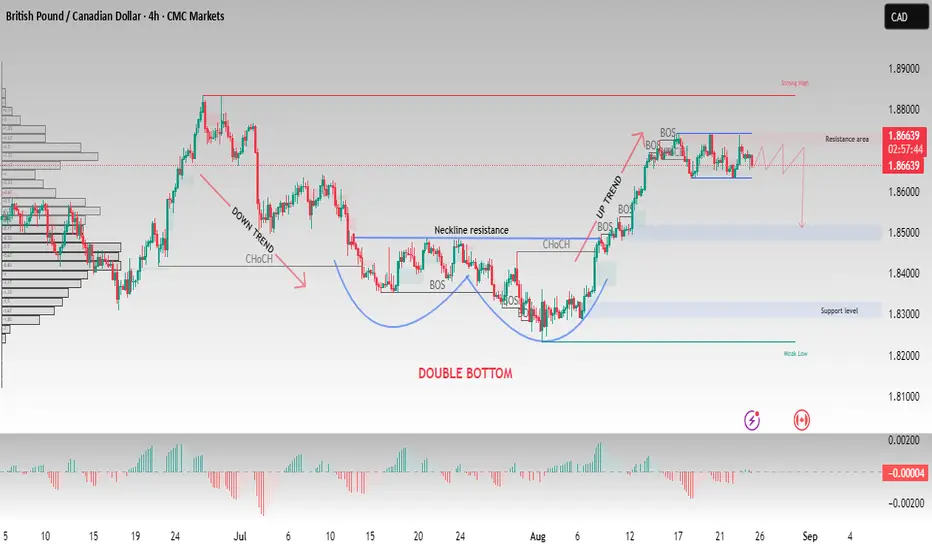
GBP/CAD – Double Bottom Formation & Key Resistance Retest On the GBP/CAD 4H timeframe, the market has completed a double bottom reversal pattern, confirming a bullish structure shift after the previous downtrend. The neckline breakout has led to an upward trend with multiple Break of Structure (BOS) signals.
At the moment, price is consolidating near the resistance area around 1.8700–1.8750. A rejection from this zone could trigger a pullback toward the 1.8500 demand zone.
Pattern: Double Bottom
Resistance Area: 1.8700 – 1.8750 (Strong High)
Support Zone: 1.8500
Key Level to Watch: 1.8300 (major support)
If resistance holds, expect a short-term pullback toward 1.8500.
If price breaks above 1.8750 with momentum, bullish continuation may follow.
This area is critical for the next directional move.
This is an educational analysis, not financial advice. Always manage your risk before entering any trade
GBPCAD Will Go Up! Long!
Please, check our technical outlook for GBPCAD.
Time Frame: 1D
Current Trend: Bullish
Sentiment: Oversold (based on 7-period RSI)
Forecast: Bullish
The market is approaching a significant support area 1.867.
The underlined horizontal cluster clearly indicates a highly probable bullish movement with target 1.890 level.
P.S
Overbought describes a period of time where there has been a significant and consistent upward move in price over a period of time without much pullback.
Disclosure: I am part of Trade Nation's Influencer program and receive a monthly fee for using their TradingView charts in my analysis.
Like and subscribe and comment my ideas if you enjoy them!

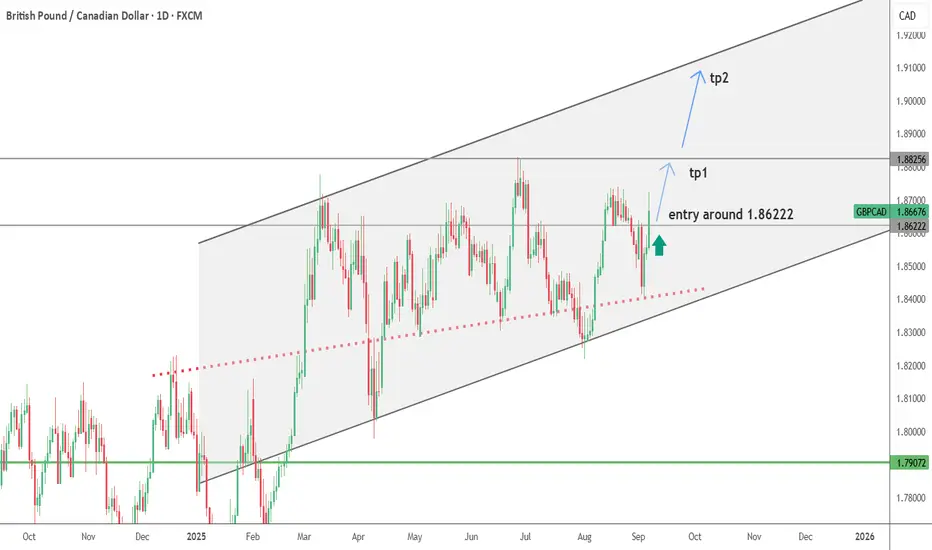
GBPCAD--LONG--ascending channel
--monthly bullish
--daily bullish
--tp and entry levels are as shown on chart


GBPCAD Will Go Lower! Short!
Please, check our technical outlook for GBPCAD.
Time Frame: 1D
Current Trend: Bearish
Sentiment: Overbought (based on 7-period RSI)
Forecast: Bearish
The market is trading around a solid horizontal structure 1.867.
The above observations make me that the market will inevitably achieve 1.853 level.
P.S
We determine oversold/overbought condition with RSI indicator.
When it drops below 30 - the market is considered to be oversold.
When it bounces above 70 - the market is considered to be overbought.
Disclosure: I am part of Trade Nation's Influencer program and receive a monthly fee for using their TradingView charts in my analysis.
Like and subscribe and comment my ideas if you enjoy them!

GBPCADLooking good to short for the 3rd time. From the same area price rejected multiple time making it a very strong resistance.

GBP/CAD SHORT Greetings.. this pair seems to be a little over extended on multiple time frames and has the potential for a pull back. if we can get failure we should get a good risk to reward for a short!!

