NVDA making its way to retest a previous CHOCHHi Traders!
I'm waiting patiently on NVDA. It broke through a 4HR Bullish OB, and now It's making its way down to retest that breaker OB area. However, If it keeps breaking down past 136.00, then the 4HR CHOCH would become invalid. I have 2 alerts set- 1 at 140.50, and 136.50. These are potential areas where there could be a reversal. Price likes to test previous CHOCH patterns, so watching closely for the best possible entry if the chart presents itself that way.
If the reversal happens and continues to move up, I'm looking for price to break 150 since tapping that area a few times already. Lets see what we can get🤞
*DISCLAIMER: I am not a financial advisor. The ideas and trades I take on my page are for educational and entertainment purposes only. I'm just showing you guys how I trade. Remember, trading of any kind involves risk. Your investments are solely your responsibility and not mine.*
NVDG trade ideas

Nvidia’s Gap Down: Is the AI Boom Cracking?Nvidia shares nosedived yesterday, shedding more than 16% in a single session. The sell-off has sparked questions about whether this is a temporary reset or the beginning of a deeper correction for the AI chipmaker.
Why Did Nvidia Fall So Hard?
The catalyst for yesterday’s plunge was the unveiling of Chinese AI start-up DeepSeek’s latest breakthrough model, R1. The model, which competes directly with those from US giants like OpenAI and Meta, demonstrated comparable capabilities but at a fraction of the cost. Adding insult to injury, DeepSeek achieved this without relying heavily on Nvidia’s chips or its proprietary Cuda platform, raising concerns over whether the company’s dominant grip on AI development might loosen.
The timing couldn’t have been worse. US-China tensions in AI have already heightened investor uncertainty, and with Nvidia’s valuation already sky-high, the news triggered panic. Short sellers capitalised on the chaos, profiting as $6.75bn was wiped from Nvidia’s market cap in a single day, while the broader semiconductor sector faced its worst drop since March 2020.
However, not everyone agrees this is bad news for Nvidia. Some argue DeepSeek’s cost-cutting approach could expand AI adoption, ultimately boosting demand for inference chips—an area where Nvidia is equally dominant. But with confidence shaken, the market reaction suggests investors aren’t buying that argument just yet.
Technical Analysis: Breaking the Structure
Yesterday’s sell-off wasn’t just dramatic; it was technically significant. Nvidia’s shares had been trading in a volatile range since October, oscillating around its June 2024 highs. That sideways price action now looks like a textbook distribution phase—a period where institutional investors offload shares before a price decline.
The range was decisively broken yesterday, with the shares gapping lower at the open and closing below their 200-day moving average for the first time since January 2023. Volume spiked significantly above the 20-day average, reinforcing the bearish move as investors rushed to exit.
Large negative gaps of this nature often act as a structural shift in momentum, turning the gap itself into a zone of long-term resistance. The bearish momentum triggered by this break could persist for several months, with key support levels now in focus.
Nvidia (NVDA) Daily Candle Chart
Past performance is not a reliable indicator of future results
Where Could Nvidia Go Next?
The first major test will be the long-term VWAP anchored to the January 2024 lows. This level has been a reliable marker of support in previous corrections, and a break below it could accelerate the sell-off. Beyond that, the August 2024 spike lows represent a critical horizontal support area, one that fuelled a significant rally last year.
Resistance is now clearly defined by the gap’s boundaries. If the shares do recover in the short term, those levels will be the key battleground for sentiment. The spike in volume suggests that yesterday’s move wasn’t just a one-day event, but the start of a broader shift that traders will need to navigate carefully.
Disclaimer: This is for information and learning purposes only. The information provided does not constitute investment advice nor take into account the individual financial circumstances or objectives of any investor. Any information that may be provided relating to past performance is not a reliable indicator of future results or performance. Social media channels are not relevant for UK residents.
Spread bets and CFDs are complex instruments and come with a high risk of losing money rapidly due to leverage. 83% of retail investor accounts lose money when trading spread bets and CFDs with this provider. You should consider whether you understand how spread bets and CFDs work and whether you can afford to take the high risk of losing your money.

NVIDIA Local UptrendNVIDIA in Local Uptrend on the 1-Hour Chart
NVIDIA made a higher high on the 1-hour chart, so we are in a local uptrend. It’s possible that we’ll see a higher low next, and then move up to a new higher high, or we could continue going higher right now.
If tomorrow the 4-hour candle close stays above $126.63 (yellow line) and holds that level, then we’ll have gained that support. In that case, we are back in the big range with the potential to reach $148.

1/27/25 - $nvda - First time homie? bot ur bag.1/27/25 :: VROCKSTAR :: NASDAQ:NVDA
First time homie? bot ur bag.
- don't mean to be be flippant on a day like today. we r all down.
- deepseek changes nothing IMO, except pulls fwd demand
- capex budgets will likely remain flat but not down
- nvda will be sold out this year and next
- and you sold your bag because...
- because you freaked out. you started believing everyone that said "the ai bubble has burst" and "the dot com moment" tweets hit your nerves (been there in dot com) and "chinese temu for ai" was something you could understand.
- for those of us who have owned the best assets in a bull mkt, you have to understand that emotions cut both ways. and while YES THIS EVENT DOES MATTER and was something that changed the equation (as should be obvious by now), not just "rates" or "china" affecting some 1-2% sell off in mkt. yes this is different, yes it's harder to trade
- does it change the fundamental demand for NVDA chips? that's the debate. and right now the market is shooting first, as it always does, and can't be blamed. fear and greed dominate. it went from greed... now fear.
- you buy fear. you sell greed.
- so we took profits and trimmed last week. now we are packing the second home with nvda shares and 2027 calls ($80C's are my flavor strike on the leap today).
- does it go lower?
- V always says. only god knows. (and tbh, "G"od doesn't care.) so first and foremost, realize this is all fake and gey. it's just a game we play. and don't get too emotionally involved. not all days will be green days. we risk manage to take less losses here and live to see another day.
- today sux. yes. maybe tmr sucks too. maybe the day after too.
- but this is not the end of Nvda or AI, actually... it's the inflection moment.
V

NVDA's Next Big Moves: Targeting 190, 175, 170! NVDA's on a wild ride, and here's where we might be heading. We're eying some exciting highs with targets at 190, 175, and 170 if we can break through 147. But, keep your seatbelts on because if the market doesn't hold up, we could be looking at a drop all the way down to 110, or even 98. Let's keep our fingers crossed for the highs but prepare for any dips.
Trade Smarter/ Live Better
Kris/ Mindbloome Exchange

Strategies are not enough. Stop trying to Predict. Observation.Most traders rely upon an indicator signal or a strategy and when these fail they are often baffled by their loss. Losses erode capital but more importantly your self confidence.
Learn to READ stock charts. Be observant in seeing patterns developing before a stock has a huge gap up or down.
NVDA had several patterns that warned early that the stock was at risk of a big gap down. It was going to go down but the gap was far larger than most traders expected and few traders were in this stock before the huge highly profitable sell short gap down.
The reversal candle today is also surprising many traders when it was obvious that the stock had fallen below fundamental values visible in the trend and candles.
Learn how to be more observant so that you are ahead of big gaps and fast running stocks rather than chasing a stock that has already gapped and is at high risk of profit taking.

Don't be an idiotEveryone online is saying "wow what a great buying opportunity!" "im loading up here!" "never thought id see this price again!"
This stock has gone 10x in 2 years... you missed it. Move on.
Buying on the first red candle would be the same as selling on the first green candle like ive circled. $80 here we come.

NVIDIA Forms Inside Bar Pattern After Significant Drop...NVIDIA is currently exhibiting an inside bar pattern following a significant 17% decline, which was triggered by the DeepSeek Panic incident. This pattern indicates a period of consolidation where the price is stabilizing within the range established by the preceding candle. To make informed decisions moving forward, it is prudent to monitor price action closely and wait for a definitive breakout from this inside bar formation. A breakout above the upper boundary could signal a potential reversal or upward momentum, while a breakdown below the lower boundary may suggest further bearish pressure. Hence, exercising patience and assessing volume and market context will be crucial before committing to any trades.

Bubble Burst?Has the NVDA bubble burst? At least from a technical standpoint, the answer appears to be yes. Further declines are anticipated, at least over the next two weeks.
First target at 110$

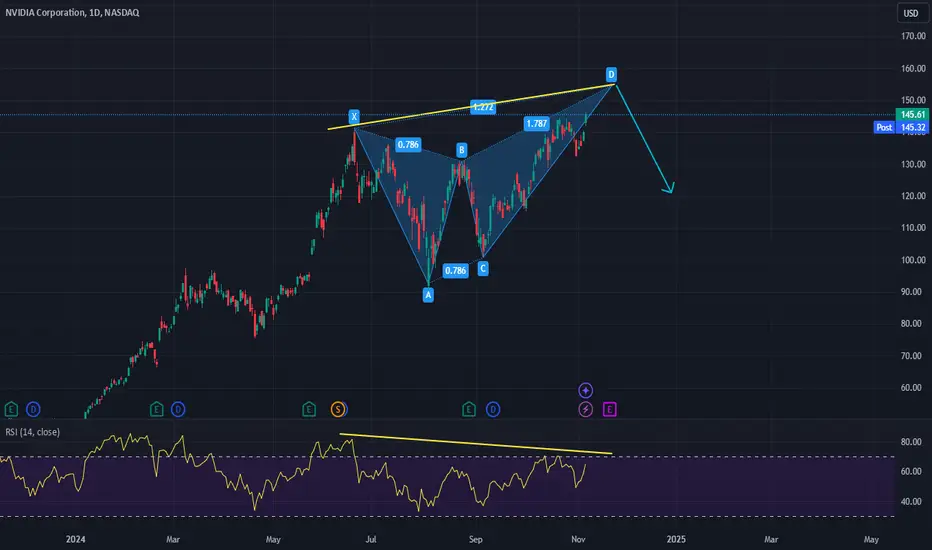
Potential pull-back on the biggest stock in the world? Careful with a potential pull-back at the top of the range. Bearish butterfly harmonic pattern is forming with bearish divergence double top on the RSI. If NASDAQ:NVDA were to go down, we could potentially see its price perform badly after earnings, which could be near the pattern completion zone.
Nvidia Stock Goes 'DeepSeek', Ahead of Earnings CallNvidia's stock has experienced significant volatility recently, largely influenced by the emergence of a new AI model from Chinese startup DeepSeek. This model, known as R1, reportedly rivals the capabilities of advanced models from major U.S. tech companies like OpenAI and Google, but does so using less powerful and cheaper chips. This development has raised concerns among investors about the sustainability of Nvidia's market dominance and the high valuations of U.S. tech stocks.
Impact of DeepSeek on Nvidia Stock
Stock Performance.
On January 27, 2025, Nvidia's shares plummeted by over 16%, marking its largest intraday drop since August 2023. This decline wiped more than half-a-trillion US dollars from Nvidia's market capitalization. The stock fell approximately 12.5% in early trading, reflecting widespread investor anxiety about the implications of DeepSeek's advancements.
Investor Sentiment.
The introduction of DeepSeek's AI model has prompted a reevaluation of the heavy investments made by U.S. tech firms in AI technologies. Analysts noted that if DeepSeek can achieve competitive results with lower costs, it may lead to reduced demand for Nvidia's high-end chips. This has caused a ripple effect across the tech sector, with other semiconductor stocks also experiencing declines.
Market Reactions.
The broader tech market was affected as well, with the Nasdaq index falling nearly 4% in pre-market trading. Other companies linked to AI and technology also saw significant drops; for instance, ASML and Broadcom fell by 7% and over 12%, respectively.
Perspectives by Fundamental and Technical Analyst
Skepticism About DeepSeek.
While some analysts expressed skepticism about DeepSeek's ability to compete effectively without advanced chips, they acknowledged that its success could force U.S. companies to reconsider their strategies regarding AI investments and efficiency. For example, Citi analysts maintained a "buy" rating on Nvidia, suggesting that major U.S. companies are unlikely to shift away from using Nvidia's GPUs in the near term.
Concerns Over Valuations.
Analysts at Wedbush highlighted that U.S. tech stocks are currently valued at premium levels, which makes them vulnerable to any disruptions in perceived technological superiority. They noted that even small developments like those from DeepSeek could significantly impact stock prices due to inflated expectations surrounding AI advancements.
Future Outlook.
Despite the immediate negative impact on Nvidia's stock, some analysts believe that concerns may be exaggerated and that U.S. firms are still well-positioned for long-term growth in AI technologies. They argue that while DeepSeek's model is impressive, it does not yet match the comprehensive infrastructure and ecosystem that American tech giants have developed.
Technical Outlook.
The main technical graph for Nvidia stock (1-week resolution) indicates on epic breakthrough of upside channel, which has been alive for more than last two years, until ̶D̶o̶n̶a̶l̶d̶ ̶T̶r̶u̶m̶p̶ someone entered ̶a̶ ̶c̶h̶a̶t̶ White House.
Ahead of Nvidia Earnings call (scheduled on February, 26) our 'fancy-nancy' Analyst Team is strongly against any Nvidia stock purchase below ready to be lost, $130 per share level.
Potentially 52-week SMA can support a stock for a while near $115 a share, otherwise we believe Nvidia stock will dive below $100 level again.
Conclusion
In summary, the rise of DeepSeek represents a pivotal moment for Nvidia and the broader tech sector, challenging existing assumptions about AI development costs and market dynamics. The ongoing situation will likely lead to further scrutiny of investment strategies within the industry as stakeholders assess the long-term implications of this emerging competition.

DeepSeek AI | TechStocks Crash | NVIDIA down -17%On Monday (yesterday), Wall Street reacted wildly with the release of Chinese AI app DeepSeek.
Throughout the day, roughly 1 Trillion US Dollars was wiped from the stock market, largely from chip and tech stocks suck as Nvidia which caused a larger sell-off.
OpenAI CEO Sam Altman called it an "impressive model" and POTUS Donald Trump said that it should be a "wakeup call for our industries".
The bright side of this, is that there can be some excellent entry points found across the market after the sell-off.
_______________
NASDAQ:NVDA

Discounts just arrived for NVDA stock Yesterday, NVDA shares closed down nearly 17% because of... Deep seek making a model which uses NVDA gpus more efficiently? Ultimately in the long run, with the 500 billion investment going into AI, NVDA is still going to make a killing, and this crash is certainly an overreaction

Analysing the Impact of Nvidia's Stock Price DropWhile the sharp decline in Nvidia's stock price made headlines yesterday, let’s assess the actual technical damage caused by the move.
Attached is a weekly chart, displayed with logarithmic scaling. This scaling method is used because Nvidia's share price has grown exponentially over the past few years, making percentage-based changes more meaningful for analysis. On a logarithmic scale, vertical spacing represents percentage changes, ensuring a consistent visual representation of relative movements.
Key Observations:
1. Trend Break Confirmation
The first notable point is that Nvidia's uptrend, which began in 2022, was broken not yesterday but several weeks ago. This predated the recent sell-off, indicating the potential for weakness had already emerged.
2. Critical Support Levels
The sell-off now approaches two significant technical levels:
o The 55-week moving average (MA) at 112.46.
o The 38.2% Fibonacci retracement level at 98.52.
These levels are worth monitoring closely as potential support zones.
Questioning the Trend
The pressing question is whether this marks the end of the bull run or merely an aggressive correction within an ongoing uptrend. For now, I lean towards the latter interpretation, as there isn't sufficient evidence to declare a full trend reversal. A single day of sharp decline doesn’t necessarily confirm the onset of a bear market—at least not yet.
Final Thought
One down day, while significant, doesn't define a bear market. It’s important to watch how the price action unfolds around the aforementioned support levels to gain clarity on the longer-term trajectory. Not investment advice
________________________________________
About Logarithmic Scaling
Logarithmic, or "percentage," scaling ensures that equal vertical distances represent equal percentage changes. For example, the vertical distance between 10 and 20 (a 100% increase) is the same as the distance between 50 and 100. This scaling is particularly useful for analysing stocks with large price growth over time.
Disclaimer:
The information posted on Trading View is for informative purposes and is not intended to constitute advice in any form, including but not limited to investment, accounting, tax, legal or regulatory advice. The information therefore has no regard to the specific investment objectives, financial situation or particular needs of any specific recipient. Opinions expressed are our current opinions as of the date appearing on Trading View only. All illustrations, forecasts or hypothetical data are for illustrative purposes only. The Society of Technical Analysts Ltd does not make representation that the information provided is appropriate for use in all jurisdictions or by all Investors or other potential Investors. Parties are therefore responsible for compliance with applicable local laws and regulations. The Society of Technical Analysts will not be held liable for any loss or damage resulting directly or indirectly from the use of any information on this site.

Double top by the wayThe price fails to reach a new ATH and starts a strong correction towards the green support area.
The breakdown of the support will result in the completion of the double top with the first target at the weekly SMA50, which also coincides with the medium-term support trendline (blue).
If the support holds, there will be a third attempt for an ATH.

Mr.Million | Why I am Bearish on NVDA Near TermNVDA appears to have completed Wave (3) and could drop to ~$100.
A potential ending diagonal forming + DOUBLE bearish divergence. 🚨
NVDA feels heavy. Unlike the past two breakouts that blasted through resistance like a 🚀, the latest breakout at ~$141 feels like it’s stuck in the mud! 😞
So, where would I go long?
🔥~$100 = Very Strong Buy 🚛🚛🚛
Remember: if NVDA falls, so will Nasdaq (and BTC)! I am holding lots of cash! 💰💰
