TSLA LongTSLA Long
Current demand Zone (218) confirmed,
Sell put below next two demand
Long entry 225
no Stop
Target 300
Risk management is much more important than a good entry point.
I am not a PRO trader.
In my trading plan, the Max Risk of each short term trade should be less than 1% of an account.
TL0 trade ideas

Trading Journal $TSLAUnfortunately a 1/2 position instead of a full position.
Selling into strength on 1/2 position
Market gapped up.. US CHINA Deal..
AMEX:SPY and NASDAQ:QQQ are way extended now above the 50day MA .. needs time for market to digest their gains
so this could pull back with it

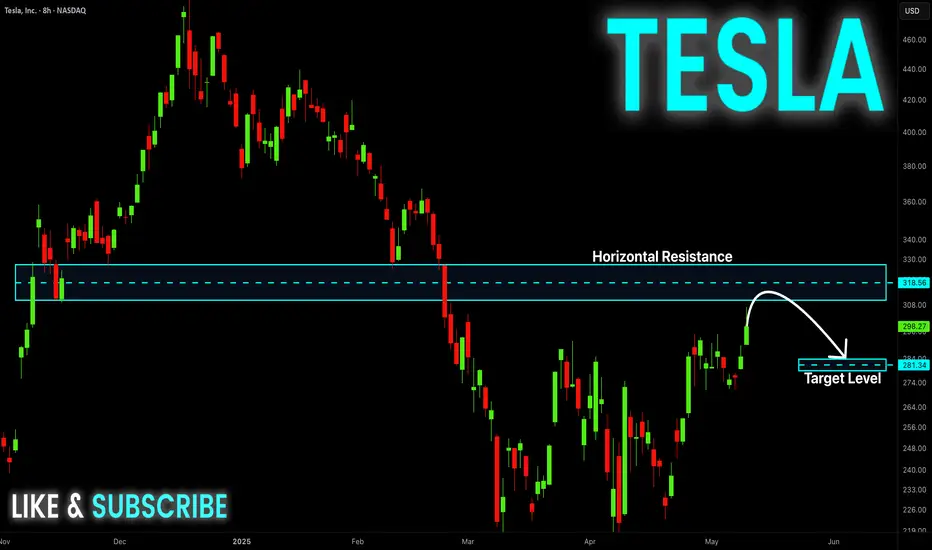
$TSLA – Base Breakout Setup with Dual Entry StrategyTesla ( NASDAQ:TSLA ) is coiling up, forming a classic base breakout setup with a dual approach for traders who want precision:
🔹 Support Zone Entry (280-285)
Shaded area = the zone between the 9 EMA (blue) and 20 EMA (yellow) — a key dynamic support area.
I'm taking a starter position here with a stop just below yesterday's low for tight risk control.
🔹 Breakout Confirmation (Above 295)
Full size only if we see a clean breakout above $295, confirming momentum.
This is where I’ll add size, looking for a strong continuation.
🔹 Execution Plan
Starter position: Shares and options at support zone ($280-$285).
Full position: Add at breakout ($295) with a mix of shares and options.
Risk: Tight stop below yesterday's low for the starter position.
⚠️ Risk Management: Always respect your stops — discipline over hope.

TSLA: Continuation of the upward trendOn TSLA we would have a continuation of the upward trend if and only if the resistance line is broken forcefully.

Tesla Breaks Key Resistance: Bullish Momentum Signals $314 Targe
Current Price: $298.26
Direction: LONG
Targets:
- T1 = $307.00
- T2 = $314.00
Stop Levels:
- S1 = $295.50
- S2 = $289.40
**Wisdom of Professional Traders:**
This analysis synthesizes insights from thousands of professional traders and market experts, leveraging collective intelligence to identify high-probability trade setups. The wisdom of crowds principle suggests that aggregated market perspectives from experienced professionals often outperform individual forecasts, reducing cognitive biases and highlighting consensus opportunities in Tesla.
**Key Insights:**
Tesla’s stock has successfully broken through significant resistance levels following strong earnings and heightened confidence in its growth strategy. The company’s continued investment in Full Self-Driving (FSD) technology offers a significant upside potential, particularly as market optimism around autonomous driving accelerates. Additionally, Tesla’s high trading volume and favorable gamma exposure suggest sustained bullish momentum for the near term. However, traders must remain cautious about valuation concerns, which persist due to the stock’s high price-to-earnings ratio and underlying market risks.
Tesla’s ambitious expansion strategies, including continued realignment of electric vehicle production and penetration in key global markets like China and Europe, make it uniquely positioned to grow further despite macroeconomic challenges. The short-term trajectory is driven by strong technical indicators and supportive market sentiment, making it a compelling candidate for long positions.
**Recent Performance:**
Tesla’s price has surged over 35% since its recent earnings report, riding the wave of high investor enthusiasm and strategic achievements. Its bullish momentum is reinforced by favorable technical setups, including MACD and RSI indicators that signal a continuation of the uptrend. The stock has outperformed other high-beta peers in the electric vehicle and technology sectors, reflecting a strong fundamental and technical foundation for further price appreciation.
**Expert Analysis:**
Market analysts highlight Tesla’s ability to consistently innovate across its product lines while maintaining high operating margins. Despite lingering valuation questions, the stock’s bullish trend remains supported by a robust narrative and growing speculative interest. Strategists are particularly optimistic about Tesla’s advancements in FSD technology and its ability to capture additional market share in ride-hailing and autonomous driving sectors. The company’s recent focus on leveraging artificial intelligence within its vehicle software and energy storage solutions has also fueled optimism among traders.
**News Impact:**
Recent developments in U.S.-China trade policies and economic stimulus measures amplify Tesla’s growth prospects in its largest international market—China. The company’s ongoing efforts to scale its FSD systems globally have garnered significant attention, further supporting long-term bullish sentiment. Additionally, increased option trading activity and Tesla’s exposure to high-volatility events contribute to its price action, offering traders opportunities to capture gains in the near term. Investors should watch closely for updates on international car deliveries and additional announcements regarding Tesla’s strategic initiatives.
**Trading Recommendation:**
Traders should consider taking a long position on Tesla as it exhibits sustained bullish momentum driven by technical breakout patterns, high investor sentiment, and strategic advancements. With Tesla poised to capitalize on macroeconomic tailwinds and sector-specific growth drivers, the stock is likely to test $314 as a near-term price target. Ensure proper risk management by placing stop levels at $295.50 and $289.40.
```

TESLA - LONGSAs you can see - our indicator works on any and all instruments you would like to trade....
You can search for the indicator - as we made a DEMO version available.
However to get the full version - you will need to follow and contact us!
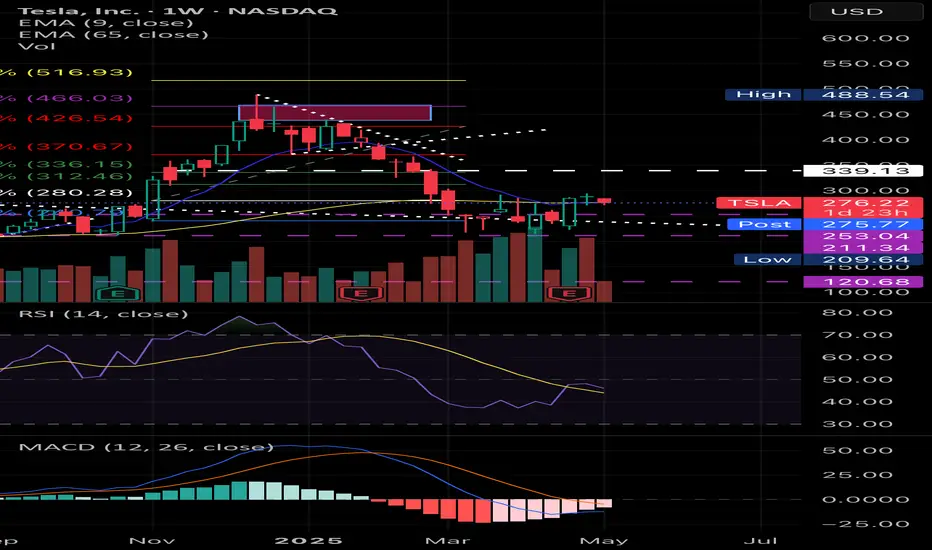
Tesla Shares (TSLA) Hit Two-Month HighTesla Shares (TSLA) Hit Two-Month High
During Friday’s trading session, Tesla shares briefly rose above the $300 mark — the first time in over two months. Although the daily candle closed below this key psychological level, TSLA still outperformed the broader stock market.
This move was supported by:
→ Investor approval of Elon Musk’s late-April pledge to spend less time on the Department of Government Efficiency (DOGE) and focus more on his role at the company.
→ A recent announcement from the Trump administration regarding a trade deal with the UK, alongside hints that more agreements may follow — potentially alluding to US-China negotiations.
Technical Analysis of TSLA Shares
In our previous analysis of TSLA’s stock price, we:
→ Highlighted the key support level around $220, which prevented deeper declines in early April even as broader indices saw more bearish trends;
→ Identified a descending channel (marked in red).
This channel remains relevant for now, but the price has already approached its upper boundary. It’s reasonable to assume that this level could act as resistance — similar to the midline of the channel (as indicated by arrows) — especially when reinforced by the psychological $300 level.
However, bulls may find strong support from any further details on a US-China trade deal (as discussed earlier today). A bullish breakout of the red channel in the coming days cannot be ruled out, potentially confirming the relative strength of TSLA stock and extending the trajectory marked by the blue lines.
This article represents the opinion of the Companies operating under the FXOpen brand only. It is not to be construed as an offer, solicitation, or recommendation with respect to products and services provided by the Companies operating under the FXOpen brand, nor is it to be considered financial advice.

OptionsMastery: Looking for an immediate buy on TSLA! 📣Make sure to watch fullscreen!📣
Thank you as always for watching my videos. I hope that you learned something very educational! Please feel free to like, share, and comment on this post. Remember only risk what you are willing to lose. Trading is very risky but it can change your life!


TESLA Set To Fall! SELL!
My dear subscribers,
This is my opinion on the TESLA next move:
The instrument tests an important psychological level 298.27
Bias - Bearish
Technical Indicators: Supper Trend gives a precise Bearish signal, while Pivot Point HL predicts price changes and potential reversals in the market.
Target - 288.52
About Used Indicators:
On the subsequent day, trading above the pivot point is thought to indicate ongoing bullish sentiment, while trading below the pivot point indicates bearish sentiment.
Disclosure: I am part of Trade Nation's Influencer program and receive a monthly fee for using their TradingView charts in my analysis.
———————————
WISH YOU ALL LUCK

TESLA Resistance Ahead! Sell!
Hello,Traders!
TESLA stock is growing
And we are bullish biased
Mid-term but the price is
About to hit a horizontal
Resistance of 322.00$
So after the retest we
Will be expecting a local
Bearish correction
Sell!
Comment and subscribe to help us grow!
Check out other forecasts below too!
Disclosure: I am part of Trade Nation's Influencer program and receive a monthly fee for using their TradingView charts in my analysis.
TESLA: Short Trade with Entry/SL/TP
TESLA
- Classic bearish formation
- Our team expects fall
SUGGESTED TRADE:
Swing Trade
Sell TESLA
Entry Level - 298.27
Sl - 310.31
Tp - 265.48
Our Risk - 1%
Start protection of your profits from lower levels
Disclosure: I am part of Trade Nation's Influencer program and receive a monthly fee for using their TradingView charts in my analysis.
❤️ Please, support our work with like & comment! ❤️

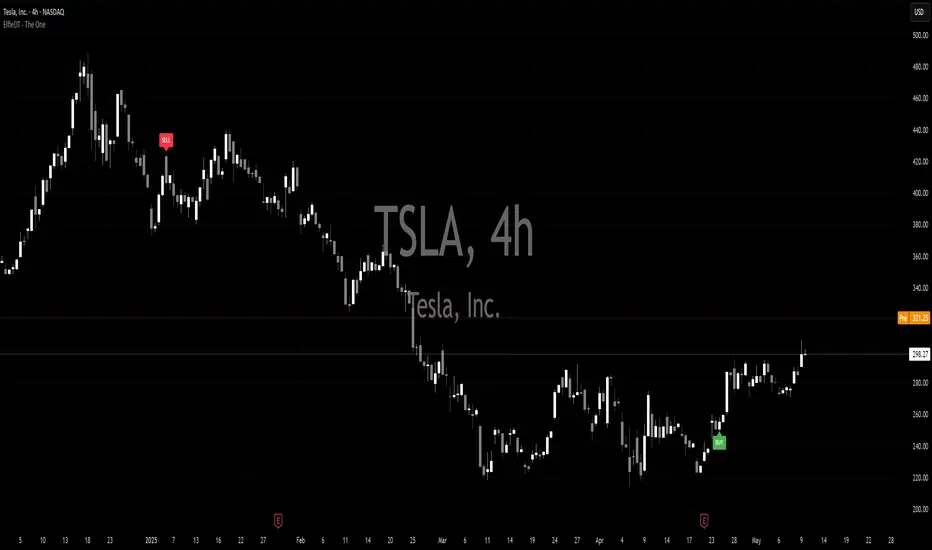
Trade Review (TSLA)Trade Review (TSLA)
key notes
- displacement -> consolidation. no bearish CISD or MSS on higher time frames
- pullback into OTE of original displacement
- unswept liquidity targets
- 4hour bullish market structure shift
- displacment, creation of a HTF fair value gap and retracement into fair value gap (Entry)
- exit at internal buyside liqudity

TSLA about to rip!Closed above the 200 SMA and flipped supply into demand. 325 on deck possible next week

Tesla May 9th 2025 this is a follow-up on Tesla it just made a minor new high and now it's going to expand and go a lot higher.

TSLA double bottomAlthough very bad bad last quarter report regarding the Revenue, TSLA in terms of technical analysis has just made double bottom and has broken a critical price range of 270.
Calculated risk of 5-10% of the portfolio can be good for this trade imo, however looking for a strong buy signal that is supported by buying volume.

Tsla Look GoodTsla 294 first resist but I can see it pass 300. IMO. clean break and held with volume once rest

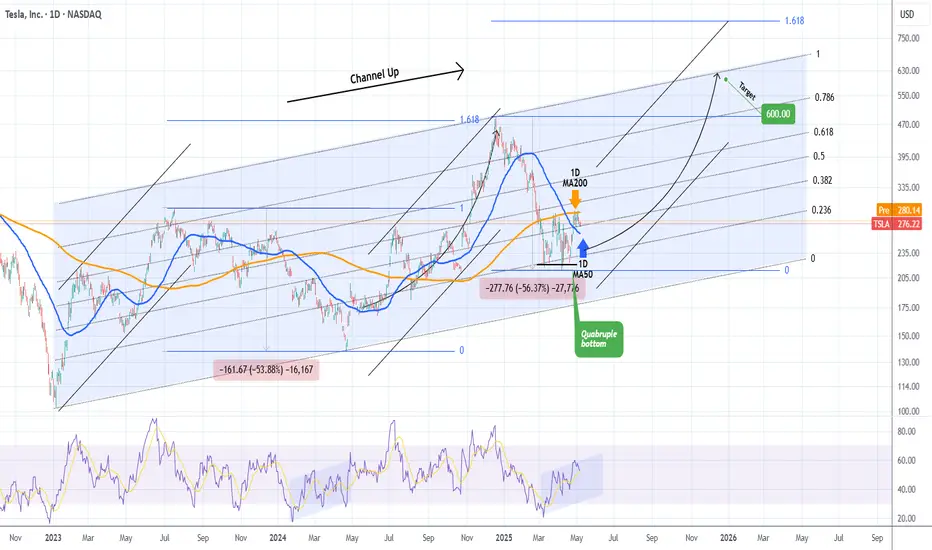
TESLA Is a $600 price tag a pipe dream?Tesla (TSLA) is seeing a steady recovery from the April 21 2025 Low, which has been a Quadruple Bottom, and has found itself consolidating the last 10 days within the 1D MA200 (orange trend-line) and the 1D MA50 (blue trend-line).
The 2.5 year pattern is a Channel Up and this Quadruple Bottom took place exactly on its 0.236 Fibonacci level, with a 1D RSI sequence that resembles the Bullish Divergence of its previous bottom on April 22 2024. The similarities don't stop there as the Bearish Legs that led to those bottoms have almost been identical (-53.88% and -56.37% respectively).
As a result we can technically assume that the current Bullish Leg that will be confirmed with a break above the 1D MA200, will be symmetrical to the previous one, which made a Higher High on the 1.618 Fibonacci extension from the bottom. That is now at $823 but falls outside of the 2.5-year Channel Up, so our long-term Target for the end of the year is $600, which is right at the top of the pattern.
-------------------------------------------------------------------------------
** Please LIKE 👍, FOLLOW ✅, SHARE 🙌 and COMMENT ✍ if you enjoy this idea! Also share your ideas and charts in the comments section below! This is best way to keep it relevant, support us, keep the content here free and allow the idea to reach as many people as possible. **
-------------------------------------------------------------------------------
💸💸💸💸💸💸
👇 👇 👇 👇 👇 👇
An Example Of How To Trade When You Live A Busy LifeIn this video, I demonstrate a swing trading approach that requires very little time in your day.
This type of trading, using limit orders, allows you to locate a strategy set-up, place your order in the market, set an alert, and then just let the market do it's thing.
I hope it's insightful!
The Meditrader


Tesla - TSLA - moving to $328 Step on up, buy your July Tesla $330 calls! Right here folks, step on up!
Tesla about to surge, what will the NPC News say is the reason? Tariff Deal?
GO Murrey
GO Elliott
GO Gann
GO Kumar

$acmr has the same price action as $tesla did a few months agoIt Wouldn't suprise me if ACMR research would break out in the coming months out of the inverted H&S pattern!

$TSLA NASDAQ:TSLA Outlook:
Tesla remains at an attractive price level. Bullish momentum may continue, driven by Elon Musk’s strategic satellite investments via Starlink. Additionally, steady Cybertruck demand and advancements in autonomous technology projects are supporting long term growth potential.