TSLA: Pausing at Key Zone – Swing & Scalp Setups for Sept 171-Hour Chart Technical View
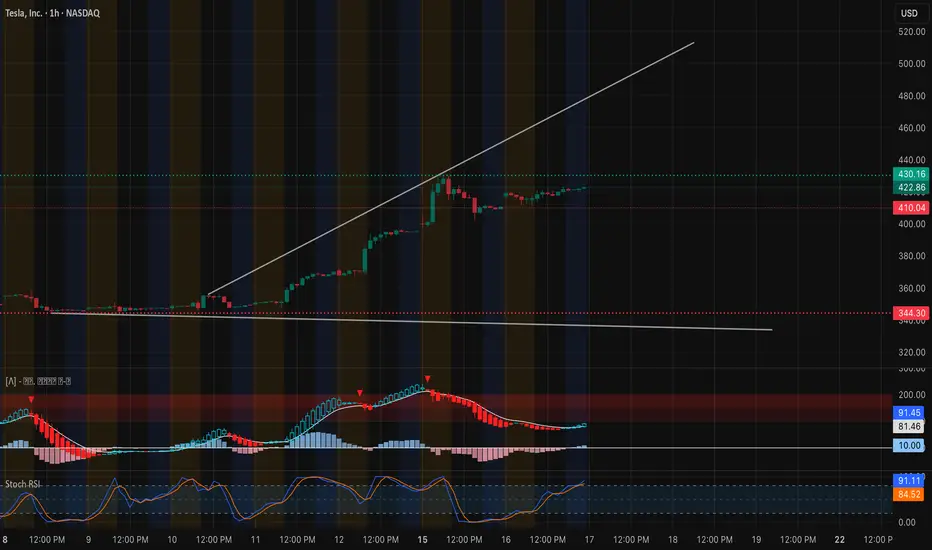
Tesla’s rally from sub-$350 to the $420 area is now consolidating. After an explosive breakout on Sept 12–13, the 1-hour candles are moving sideways in a tight $410–$430 box. MACD has cooled from overbought and is starting to curl back up, while Stoch RSI is hovering in a neutral zone—showing that momentum is recharging, not reversing.
* Immediate Support: $410 (critical breakout retest)
* Major Support: $344 (key demand and high-volume node)
* Near-Term Resistance: $430–$440 (current supply zone)
* Upside Magnet: $450 and $484 if $440 clears with volume
EMA alignment (9 above 21) still favors the bulls, and price continues to respect the uptrend line from the early September pivot.
GEX & Options Flow
Options data underline strong bullish hedging pressure:
* Call Walls: $430 (2nd call wall), $440 (highest positive NET GEX / gamma resistance), $450 next target.
* Put Walls: $407.5 (1st defense), then $385 and $322.5.
* GEX Bias: Calls dominate with 92.8% call-weighted exposure. IVR at 20.1 (IVx ~65.9)
suggests decent option premiums but not extreme volatility pricing.
This configuration typically supports dip buying and favors upward grind, provided $410 stays intact.
Trade Thoughts & Suggestions
* Swing Idea: Accumulation on 1-hour closes above $410 with a stop below $400, aiming for $440–$450, and possibly $484 on continuation.
* Scalp Idea: Intraday traders can fade extremes inside the $410–$430 range, or take a momentum scalp if $430 breaks on strong volume.
* Bearish Scenario: A decisive break under $400 could unwind gamma support and invite a test of $385 and $344.
Quick Take
TSLA is digesting sharp gains in a healthy range. Strong call gamma at $430–$440 is both a near-term lid and a potential springboard. For Sept 17, look for continuation plays if $430 is taken out with conviction.
Disclaimer: This analysis is for educational purposes only and does not constitute financial advice. Always do your own research and manage risk before trading.
TL0 trade ideas
Yes, Elon Musk Buys $1 billion of Tesla Stock - $TSLAYes, Elon Musk bought approximately $1 billion worth of Tesla stock on September 15, 2025. We had a nice Fib retracement buy zone on this one around $214-$235 levels. We got in late ourselves and got in at $340. As a value play, this stock still trades at premium valuations, hovering near $410 per share with a trailing P/E above 200x—far higher than both traditional automakers and most growth tech peers.
Risks remain significant. Competition from Chinese rivals, ongoing price cuts that pressure vehicle margins, and regulatory challenges in key markets raise questions about how sustainable current profitability will be. For trading purposes, I would never short the stock, but buy oversold dips and swing trade it.
--------------------------------------------------------------------------------------
Disclaimer:
I do not provide personal investment advice and I am not a qualified licensed investment advisor. I am an amateur investor.
All information found here, including any ideas, opinions, views, predictions, forecasts, commentaries, suggestions, or stock picks, expressed or implied herein, are for informational, entertainment or educational purposes only and should not be construed as personal investment advice. While the information provided is believed to be accurate, it may include errors or inaccuracies. I will not and cannot be held liable for any actions you take as a result of anything you read here.
Conduct your own due diligence, or consult a licensed financial advisor or broker before making any and all investment decisions. Any investments, trades, speculations, or decisions made on the basis of any information found on here, expressed or implied herein, are committed at your own risk, financial or otherwise.
Feel free to give us a follow and shoot us a like for more analysis updates.

CUP AND HANDLE $TSLA TO $515 MINIMUMThe cup and handle is a bullish chart pattern commonly used by traders to spot potential buying opportunities. It features a rounded "cup" formation followed by a slight downward drift forming the "handle." This pattern typically signals a continuation of an upward trend once the handle completes its consolidation phase.
ROBOTAXI BOOM
BUY NOW NASDAQ:TSLL NASDAQ:TSLA

Im already long, but here is a trade idea for swings First of all, I'm just overall in general bullish on tesla.
I'm a firm believer its just one of those stocks that you can always buy and make money on equity if your patient enough.
Ive got about a $320 average on this. Truthly I dont have a stop loss because if we loose this $300 level then I know we can test $225 again and I know I can buy some more shares down there. (Which I'm OK with turning into a long term play)
Elon Musk may have screwed up his Trump friendship, but look how well this stock has held since then. Consolidation above the Daily 200 ema. I love it.
Every time he Tweets and talks shit about trump people sell and buyers are ready at $300.
-That price is the floor in this consolidation.
The Reason to be Long:
So far we have broken out and retested the break out. Good to play options on this if we get a pull back on price on Monday.
So if I was to trade with shares and equity on this then I would play "soft stops" and close the position manually if we have a very bearish red daily close with a huge fair value gap that displaces through the daily 200 ema, the $300 "floor", and a swing low broken to the downside on a higher time frame.
Now we did just sweep BSL (Buyside liquidity) and we are coming down to retest this trendline. I'm not really a trendline trader but I like to throw them up on my chart to see if they respect them.
Price can pull back to $320 and have an explosive move up.
I can see this running into the $400 range but you do have to be careful With $355 and $367.
Those are the two prices that I will look to sell some shares IF price sweeps and rejects that area.
If your overall long term bullish on this stock and Elon Musk, then just buy it here and swing it into all time highs. It will 100% go back there if your patient (:
Long TESLATrading Fam,
Today my indicator has signaled a BUY on $TSLA. The technicals align. M pattern looks to have completed at strong support (RED TL) and is bouncing upwards inside of a solid liquidity block. Buyers are stepping in. I'm in at $315 and will shoot for $430 (probably taking some profit along the way). My SL is currently $241 but will trail as we enter profit.
Best,
Stew


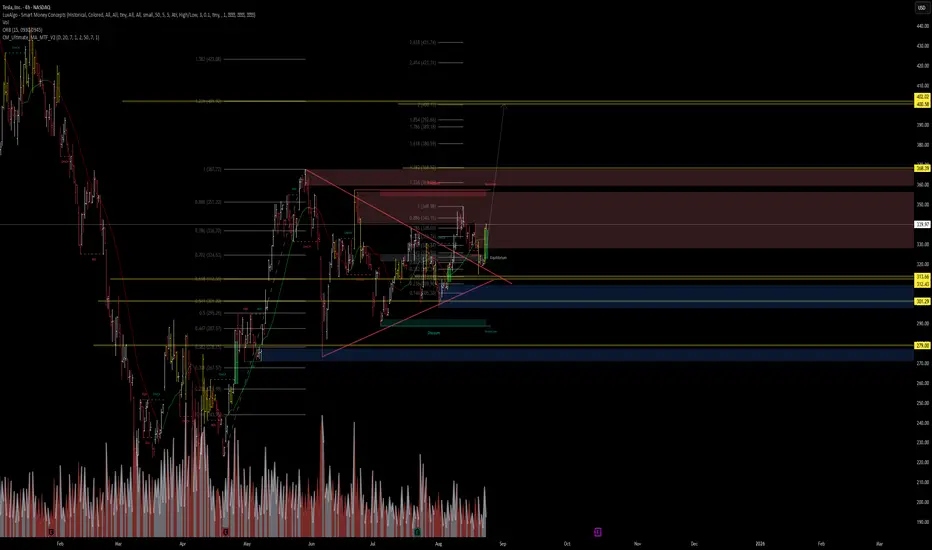
TSLA bull run to $500 before the end of 2025Based on the recent breakout from the triangle pattern, it seems like Tesla is ready to start a bullish run to reach the previous all time high of $488 before the end of 2025.
Once it reaches that resistance level, $500+ will be possible for 2026.
If you decided to trade in Tesla for the upcoming months, check out the current support levels to pick a stop loss according to your Risk - Reward parameters.

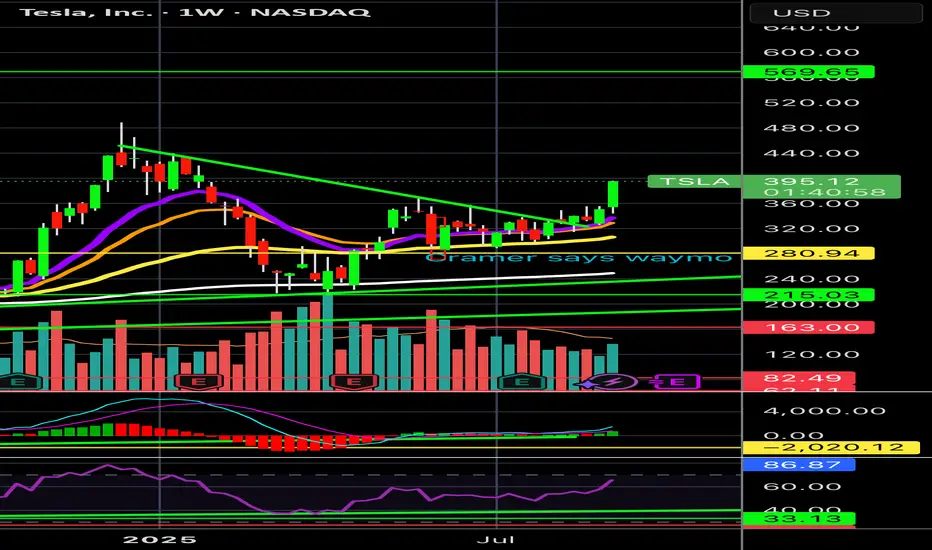
TeslaLevels Ive had for Tesla to hit for the last few months. Seems like we are getting there. Most likely will get there by Feb-March 2026 at the latest before a HUGE DROP.

Check if it can rise above 347.21
Hello, traders!
Follow us to get the latest updates quickly.
Have a great day!
-------------------------------------
(TSLA 1D chart)
The key is to determine which direction the price breaks out of the two support and resistance areas of 268.07-311.48 and 347.21-382.40.
For a step-up trend to occur, the price must remain above 334.09-347.21.
However, a step-up trend is highly likely only if the price rises above the support and resistance levels of 382.40 and 421.06 on the 1W and 1M charts.
Even so, a larger increase is likely if the price rises above the 334.09-347.21 range on the 1D chart.
-
The 268.07-311.48 range also falls within the HA-High indicator.
Therefore, it's important to remember that the current position is not a buy position, but rather a sell position.
However, for new buys, it's best to initiate them when support is found near the M-Signal indicator on the 1M chart, if possible.
Therefore, when the 268.07-311.48 range acts as a support zone, it can be considered a buying opportunity.
However, since it's within the HA-High indicator zone, trades should be executed with short and quick responses.
The key volatility period is around October 7th, but before that, we should check the movements around September 5th and September 12th.
At this time, the trend is likely to be determined by which direction the price moves: the 268.07-311.48 range or the 347.21-382.40 range.
-
Thank you for reading to the end.
I wish you successful trading.
--------------------------------------------------

TSLA: AI + Technicals Meets Macro TailwindsAI Forecast (VolanX Protocol)
Current Price: $340.01
30-Day Target: $387.70 → +14.0% upside
Institutional Trade Plan:
Entry: $340.01
Stop Loss: $314.45
Targets: $346.81 / $387.70
Risk/Reward: 1.87:1
Model Agreement: 8/9 bullish
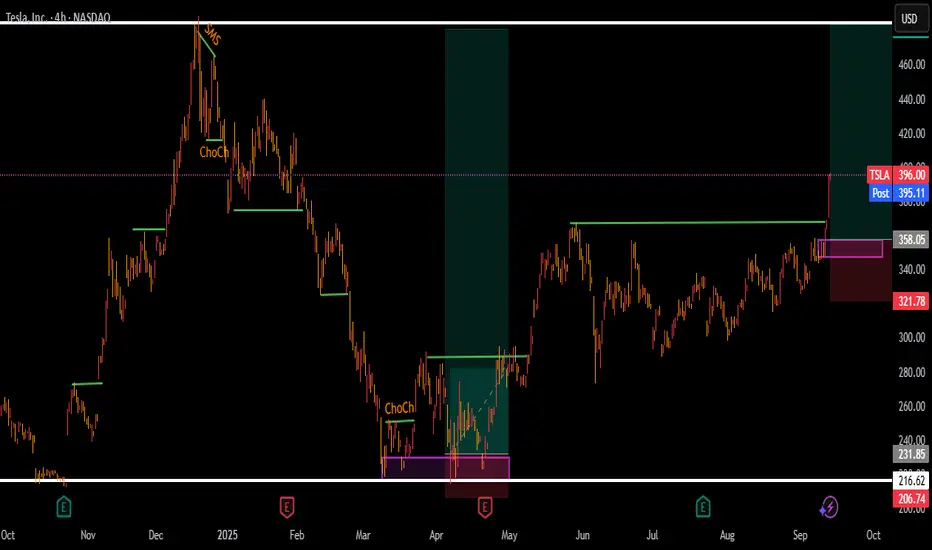
Technical Structure (4H Chart):
Broke above a triangular consolidation, now testing equilibrium from below.
Key support levels: $313.60 / $301.30 (discount zone).
Resistance / extension zones lined up at:
First: $368–$369
Extended: $400–$402 (1.618–2.618 fib levels).
Macro Catalysts & Market Context:
Fed Rate Sentiment Improving: Powell hinted at possible September rate cuts; markets rallied with Tesla leading, rising 6%.
Value Sense Blog
+6
Barron's
+6
Investors
+6
Investopedia
+1
EV Tax Credit Flexibility: New IRS guidance allows buyers to secure the $7,500 credit via contracts before Sept 30, potentially boosting demand.
Investors
+1
Mixed Q2 Fundamentals: Q2 saw declining deliveries & regulatory credits; Musk warned of “rough quarters” ahead, but emphasized AI & robotaxi growth.
Investors
+6
Investors
+6
New York Post
+6
Geopolitical Risks & Tariffs: Tariff pressure, fading EV credits, and sales underperformance in key regions keep long-term risks present. Analyst targets range widely.
Investopedia
MarketWatch
Value Sense Blog
Investors
Probabilistic Outcome Mix:
Base Case (50%) → $346–$368 (near-term resistance test aligned with AI target)
Bull Extension (25%) → $387–$402 if macro tailwinds persist and structure sustains breakout
Bear Risk (25%) → Breakdown below $340 could retest $313–$301
Trade Setup Breakdown:
Long Entry: $340
Stop: $315
Take Profit #1: $368
Take Profit #2: $388
Option: scale into $400s if breakout momentum holds
Why It Matters:
This setup represents AI-driven momentum meeting technical trend alignment and favorable macro catalysts. If Fed signals, EV policy flexibility, and optimism around Tesla’s AI/autonomy can power continued upside, $387–$400 becomes very plausible. However, macro risks and execution hurdles need monitoring.
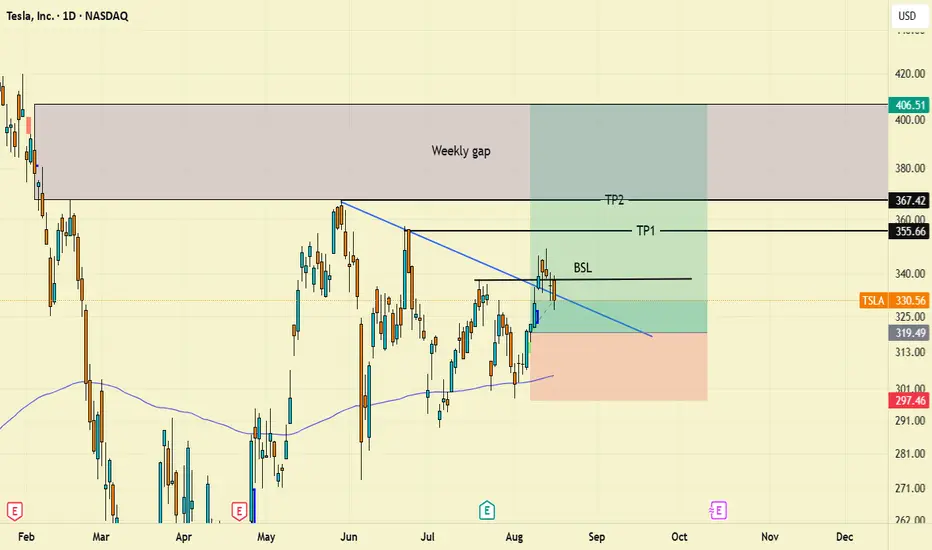
LONG | TSLA NASDAQ:TSLA
TSLA is pressing against a key confluence zone $352–$356 (TP1), aligning with daily and weekly resistance. A confirmed breakout could open the path toward $367 (TP2) and $404 (TP3) in the medium term.
Supports: $326 / $318 – must hold to maintain bullish momentum.
Bias: Bullish if above $326; consolidation or pullback likely if rejected at $356.
A monthly close above $367 would confirm a long-term cup breakout, projecting toward the $500 area over the next cycles.

Tesla Financials: Q1 2025The market is currently staging a short-term rally - essentially a speculative mean reversion bounce as a reaction to -55% crash from all-time high. This move appears driven largely by retail traders seizing what it perceives as a rare opportunity to accumulate an oversold "large-caps".
While retail participation and opportunistic capital are supporting the current bounce, this alone is insufficient to sustain a full recovery. As the price approaches higher levels, particularly near key supply zones, it will likely encounter significant resistance, resulting in reversal.
Let's not forget the fact that figures in Tesla’s Q4 '24 financial report initiated bearish sentiment among institutional investors which resulted in market crash. Similarly, the upcoming Q1 earnings report presents a clear downside risk, as the significant events throughout this quarter will inevitably be reflected in the financial figures!
Anticipated impact of significant developments on Tesla’s Q1 2025 Financial Statements
🛑 Revenue Decline
• U.S. Market Weakness: Lower-than-anticipated vehicle sales in the U.S. directly reduce automotive revenue.
• Severe European Slump: A significant 76% sales decline in Germany and weakness elsewhere in Europe will notably reduce international revenues.
• Chinese Market Challenges: A substantial 49% sales drop in China will negatively affect one of Tesla’s crucial growth markets.
• Cybertruck Weakness and Recalls: Reduced demand and multiple recalls of Cybertruck models further erode revenue growth.
• Resale Value Decline and Trade-Ins: Increased vehicle trade-ins indicate lower demand, causing inventory buildup, discounting pressures, and further sales reductions.
🛑 Gross Margin Erosion
• Price Reductions and Sales Incentives: Competitive pressures and lower demand likely forced Tesla to reduce vehicle prices and offer incentives, compressing gross margins.
• Increased Competition from BYD: BYD’s advanced battery technology (providing 400 km of range in just 5 minutes of charging) pressures Tesla to increase R&D spending or cut prices further, negatively affecting margins.
• Production Challenges (Supply Chain and Battery Issues): Ongoing global supply chain disruptions and difficulties scaling battery production significantly increase manufacturing costs, further squeezing gross margins.
🛑 Increased Operating Expenses
• Recall Costs and Legal Expenses: Vehicle recalls, along with lawsuits related to product issues such as phantom braking, will significantly increase warranty provisions, legal fees, and related operating expenses.
• Protests and Vandalism Costs: Public backlash and vandalism necessitate additional expenditures on security, facility repairs, and public relations initiatives.
• Employee Turnover Costs: Departures of key personnel result in increased recruiting, training, onboarding, and severance expenses.
🛑 Net Income and EPS Impact
• Analyst Earnings Downgrades: Already-reduced EPS projections by major analysts suggest Tesla will likely report earnings below expectations, reflecting revenue shortfalls and elevated expenses.
• $1.4 Billion Financial Discrepancy: If confirmed or unresolved, this discrepancy could lead to substantial asset impairments, restatements, or write-downs, negatively impacting net income and earnings per share (EPS).
🛑 Cash Flow and Liquidity Pressures
• Lower Operating Cash Flows: Reduced revenue coupled with rising operating costs (including recalls, lawsuits, security, and PR spending) severely diminish cash generated from business operations.
• Increased Capital Expenditures: Additional CapEx is likely required to address battery production bottlenecks and delays in autonomous driving technology development, resulting in elevated investing cash outflows.
• Investor Divestment and Stock Volatility: Negative investor sentiment could lead to costly equity financing conditions if Tesla needs to raise capital, adversely affecting financing cash flows and liquidity.
🛑 Balance Sheet Risks
• Rising Inventory Levels: Weak sales combined with continued vehicle production may lead to increased inventory levels, reducing cash and potentially requiring markdowns or provisions.
• Debt and Liquidity Challenges: Deteriorating credit metrics or covenant breaches could make refinancing existing debt more expensive or complicated, negatively impacting Tesla’s financial stability.

TESLA stock to gain more heights again!Tesla has finally broke out of that ardous consolidation it was in! investors can look for the buying opportunities for a probable pullback on a shown order block!
Tesla Near Term SpeculationBuilding on the flag formation from the past 3 years, its possible an rising wedge could form. Very early days and highly speculative, but if price plays out somewhat like my chart, an ascending wedge could form. Indicating that Tesla may have hit a near/mid term high and can't won't break through for a few years, with several implied price crashes going into 2026 and 2027.
Economic conditions and the apparent slow down in sales, would also support the technical analysis with macro fundamentals.
Very curious to see how things play out, again, highly speculative, just wanted to post to remind myself to keep and eye on this. The potential volatility is presenting interesting trades ahead.

Breakout time $TSLA$570 inbound
The start of the Energy abundance and Robotaxi era is upon us. Autonomous robots will transport everything within the next 10 years.
Optimus wave will follow shortly behind over the next 5 years.
TAM Potential: 10X autonomous transport.
How high this eventually goes is almost laughable, time to sit back and watch compound growth and all its magical glory.
Tesla Breakout? For the majority of the calendar year TESLA has been in a range between $220 - $365 with a clear midpoint of $295.
From March to the beginning of May TESLA bounced between range low and the midpoint until finally breaking through into the upper half of the range where it has stayed ever since. However, there is a clear diagonal resistance level that is preventing higher highs.
So will TESLA breakout, or will it lose the midpoint? Structurally it is clear that the bulls have a set level they are happy to buy at (Midpoint) but the bears are getting more aggressive with their selling, hence the lower highs. This compression inevitably leads to an impulse move but the direction is not so clear.
Bullish scenario: A clean breakout with volume that makes a new higher high, signaling a shift in structure. A pullback and retest of the breakout would be an ideal opportunity to go long and aim for that range high before expecting resistance.
Bearish scenario: The lower highs keep printing until the midpoint is lost and price accepts below it, that would then signify to me the new trading range is between Range Low and Midpoint.
The fakeout scenario is a risk but with price so close to the midpoint already it follows the same invalidation criteria as the bullish scenario, the midpoint is vital to both sides.

#TESLA - $40 Swing?Date: 14-08-2025
#Tesla - Current Price: 339
#Tesla Pivot Point: 339 Support: 331 Resistance: 347
#Tesla Upside Targets:
| 🎯 Target 1 | 356 |
| 🎯 Target 2 | 365 |
| 🎯 Target 3 | 374 |
| 🎯 Target 4 | 384 |
#Tesla Downside Targets:
| 🎯 Target 1 | 323 |
| 🎯 Target 2 | 314 |
| 🎯 Target 3 | 304 |
| 🎯 Target 4 | 295 |
#TradingView #Nifty #BankNifty #DJI #NDQ #SENSEX #DAX #USOIL #GOLD #SILVER

Possible retrace before upside moveThe initial upward move from 214 is corrective in nature. Since the current correction to 273 doesn't seem to be proper ABC correction, I am expecting further C wave correction to the Green box. Breaking the Red Box and the trendline with a retest will invalidate further downward correction. Based on the Major Indexes structure, I am not expecting Tesla to retrace below 213 as depicted by red line .
Note
**Disclaimer** : All details shared here is for educational purpose only. Please do your own research and consider appropriate risk management before making short term or long-term investment decisions.
Approach Market always with probabilities and make sure risk management in place.
Request your support by like, comment and follow

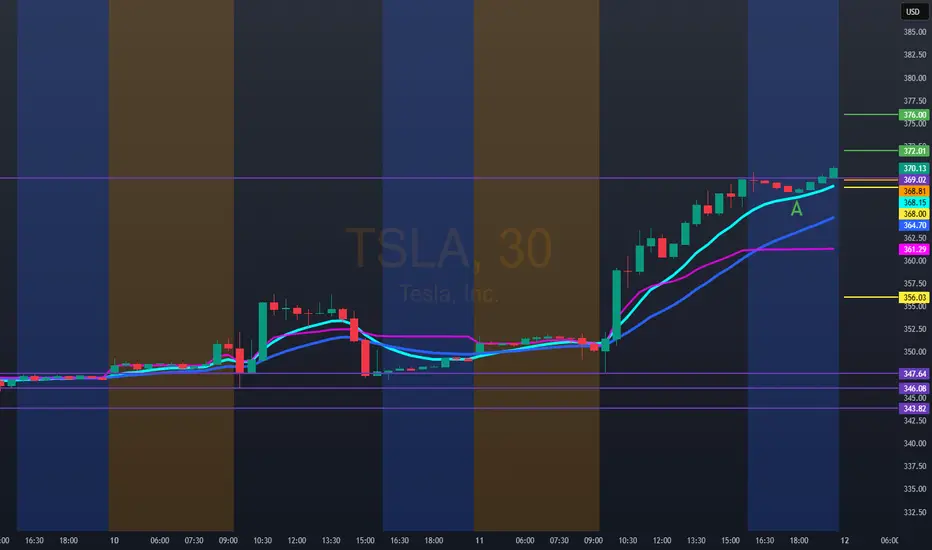
Hello trader, nice to meet you. For tomorrow, TSLA: 368.81we have a bullish entry at 372.00/376.00. Next, a possible target is 385.00/390.00. For better control of your stop, you can use the VWAP.
Bearish technical entry at 368.00. If you lose, this area could reach the 356.00 zone with a possible rebound. It's important to keep in mind that September is often a negative month for TSLA.
TSLA (daytrading) 2 plan for itPlan 2 could be possible because:
(p1 price is on sma 50 d1,p2 could be sma 200)
TSLA still has a small gap below that might need to be filled.
This week doesn’t look good for the overall market.
I will continue to watch it closely


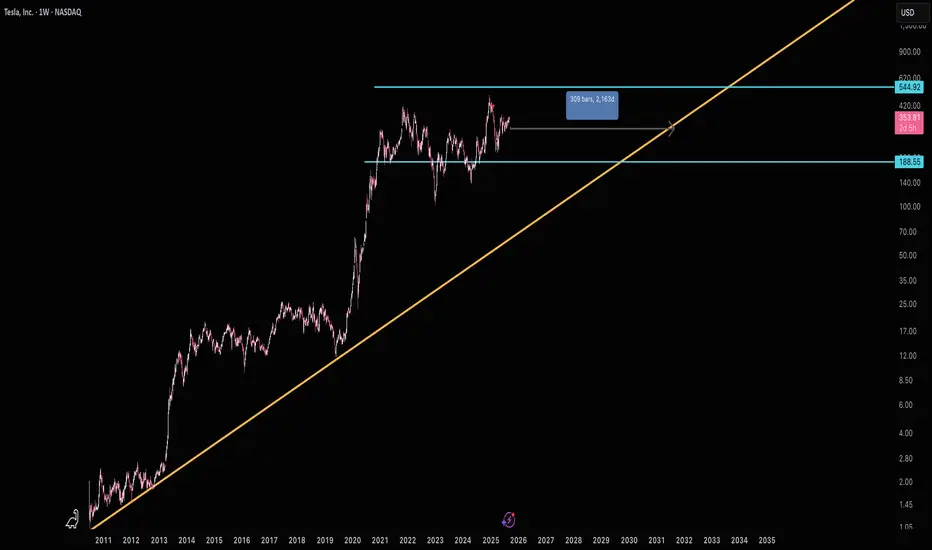
Tesla range locked until ~2030My bias on Tesla is obviously down as I think it is one of the biggest bubbles of our time. However the market doesn't think so, and because of this it Tesla has greatly outpaced it's growth rate accelerating returns by almost a decade.
I speculate there's still around 5 years left of sideways for Tesla before it's able to do anything. I would come up with your best options strategies for this range with a slight downward bias perhaps.
Good luck!
TSLA 45Minutes Time frameTSLA 45-Minute Snapshot
Current Price: $346.97 USD
Change: +0.18% from the previous close
Intraday Range: Not available
🔎 Technical Indicators
RSI (14): 53.64 — Neutral
MACD: 1.78 — Buy signal
Moving Averages:
5-period SMA: $347.01 — Sell signal
10-period SMA: $346.78 — Buy signal
20-period SMA: $347.82 — Sell signal
50-period SMA: $340.53 — Buy signal
📈 Market Sentiment
Pivot Points:
R1: $347.52
R2: $348.18
R3: $348.95
S1: $345.32
S2: $344.65
S3: $343.99
📅 Outlook
Bullish Scenario: A breakout above $347.52 could lead to a push toward $348.18 and higher.
Bearish Scenario: A drop below $345.32 may test support around $344.65.
Overall Bias: Neutral to slightly bullish, with mixed signals from moving averages.
