Bears Exhausted at Support - Bulls Load Spring📊 **To view my confluences and linework:**
Step 1️⃣: Grab the chart
Step 2️⃣: Unhide Group 1 in the object tree
Step 3️⃣: Hide and unhide specific confluences one by one
💡 **Pro tip:** Double-click the screen to reveal RSI, MFI, CVD, and OBV indicators alongside divergence markings! 🎯
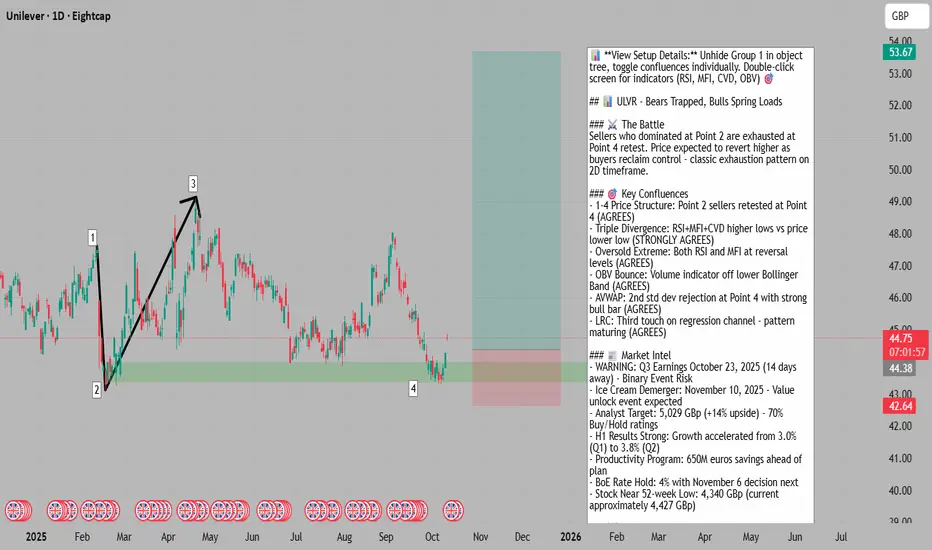
Title: 🎯 ULVR: Bears Exhausted at Support - Bulls Load Spring
The Market Participant Battle:
On the 2-day timeframe, Unilever has established a classic bear trap formation. After Point 3 closed above Point 1, it confirmed Point 2 as a proven set of sellers who successfully pushed price lower. Now at Point 4, price has returned to test these sellers once again - but this time, the bears are showing exhaustion. Multiple technical indicators reveal weakening selling pressure through bullish divergences, oversold conditions, and support confluence at critical levels. The thesis: institutional sellers who dominated at Point 2 have depleted their ammunition, and price should now revert upward as buyers reclaim control, potentially targeting the Point 3 highs or beyond. This is a participant exhaustion setup where the losing side (bears) gets punished with a reversal move.
Confluences:
Confluence 1: Price Structure Pattern (Points 1-4 Setup)
The 2-day chart reveals a textbook market structure pattern. Point 3's close above Point 1 established Point 2 as a verified resistance zone where sellers dominated. Price has now returned to Point 4, creating a symmetrical retest scenario. This structure suggests that the sellers who were successful at Point 2 are being revisited, but the price action at Point 4 shows signs of absorption rather than continuation of selling pressure. The green support zone and red resistance zone frame the battleground, with Point 4 sitting precisely at the lower boundary. This confluence AGREES with the bullish thesis - the structure suggests a potential spring-loading setup at proven support.
Confluence 2: Triple Bullish Divergence (RSI + MFI + CVD)
This is perhaps the strongest signal in the entire setup. While price made a lower low from Point 2 to Point 4, three critical indicators made HIGHER lows: the Relative Strength Index (RSI), Money Flow Index (MFI), and Cumulative Volume Delta (CVD) candles. This triple divergence reveals that despite price declining, buying pressure is actually increasing while selling pressure diminishes. The RSI and MFI are both showing oversold readings at Point 4, indicating that the market has reached an extreme that historically leads to reversals. The CVD making a higher low is particularly significant - it shows that real volume-weighted buying is accumulating even as price tags lower. This confluence strongly AGREES with the trade thesis and adds substantial weight to the reversal narrative.
Confluence 3: OBV Bollinger Band Bounce
The On-Balance Volume (OBV) indicator is bouncing precisely off its lower Bollinger Band at Point 4. OBV measures cumulative volume flow and serves as a leading indicator for price movement. When OBV reaches the lower Bollinger Band, it suggests oversold conditions from a volume perspective and often precedes price reversals. The fact that OBV is holding this support and beginning to bounce while price tests lows creates a classic divergence setup that favors bulls. This technical signal AGREES with the reversal thesis and suggests accumulation is occurring at these levels.
Confluence 4: Anchored VWAP (2nd Standard Deviation)
An Anchored Volume Weighted Average Price (AVWAP) placed from Point 1 has caught price exactly at its 2nd standard deviation at Point 4. This is statistically significant - price at the 2nd standard deviation represents approximately 95% probability boundaries, meaning these levels act as strong attraction/repulsion zones. The initial pierce below this level was swiftly reversed with a strong bullish bar, suggesting institutional buyers stepped in precisely at this mathematical support level. AVWAP levels are closely watched by institutional traders for entries and exits, making this confluence highly reliable. This AGREES with the bullish setup - the violent rejection from below the 2nd std dev suggests buyers defended this level aggressively.
Confluence 5: Linear Regression Channel (LRC) - Three Touch Pattern
The Linear Regression Channel drawn across the recent price action has produced three precise touches at lower lows, with Point 4 being the third touch. The angle of the LRC is notable - it's catching successive lows without being violated, suggesting the downward momentum is decelerating. The previous two candles that touched this angled support line both closed above the LRC, which is a bullish sign indicating absorption of selling pressure. Point 4 being the third touch suggests the pattern is maturing and a reversal becomes more probable with each test. This confluence AGREES with the trade - three-touch patterns on regression channels often mark exhaustion points and potential reversal zones.
Web Research Findings:
- Technical Analysis: Mixed signals from analysts. Some sources indicate ULVR is trading below 50-day (4,546 GBp) and 200-day (4,575 GBp) moving averages with RSI at neutral 49.25 and bearish MACD at -59.50. However, other sources show recent consolidation near critical support levels around 4,340-4,390 GBp range. Stock currently at approximately 44.27 GBp (4,427 pence), near 52-week low of 4,340 GBp.
- Recent News/Earnings: CRITICAL CATALYST ALERT - Q3 2025 earnings scheduled for October 23, 2025 (14 days away). H1 2025 results were solid: 3.4% underlying sales growth, improving to 3.8% in Q2. Company reconfirmed full-year guidance of 3-5% underlying sales growth. Productivity program ahead of plan with 650M euros savings by end 2025. Ice Cream demerger on track for November 10, 2025 completion.
- Analyst Sentiment: Moderately bullish - 28 Buy ratings, 1 Hold, 11 Sell ratings in current month. Average price target: 5,028.91 GBp (approximately 14% upside from current levels). Target range from 3,900 to 5,900 GBp. J.P. Morgan and Berenberg maintain Buy ratings with price targets around 5,570 GBp.
- Data Releases & Economic Calendar: Three major upcoming events: (1) General Meeting for Share Consolidation - October 21, 2025; (2) Q3 Earnings Release - October 23, 2025; (3) Ice Cream Demerger completion - November 10, 2025. UK Bank of England next rate decision: November 6, 2025 (current rate 4%, inflation at 3.8%).
- Interest Rate Impact: BoE held rates at 4% in September meeting, with mixed expectations for November cut (approximately 25% chance priced in). As a consumer defensive stock, Unilever typically shows resilience during stable or declining rate environments. Higher rates have weighed on consumer discretionary spending, but recent H1 results showed volume growth returning (1.5% volume growth in H1).
Layman's Summary:
Here's what all this research means for your trade in plain English: Unilever is approaching major corporate events that could serve as catalysts. The Q3 earnings in two weeks could validate improving fundamentals (remember, Q2 growth accelerated to 3.8% from 3.0% in Q1). The Ice Cream demerger in November is expected to create a "leaner, more focused" Unilever with structurally higher margins. Analysts are generally positive with a 70% buy/hold rating and see 14% upside. However, some technical analysts note the stock is below key moving averages, creating a tug-of-war situation. The upcoming earnings are a double-edged sword - they could validate your reversal thesis with strong results, OR disappoint and send price lower. The UK macro environment is stable with rates holding at 4%, which supports consumer staples. Currency headwinds from GBP weakness have impacted results but are being managed. Bottom line: fundamentals are improving, but you're trading into a major binary event (earnings) that could go either way.
Machine Derived Information:
- Image 1 (Price Structure Chart): 2D timeframe showing Points 1-4 pattern with declining price structure to Point 4. Significance: Establishes the structural framework showing sellers at Point 2 being retested at Point 4. Clean support/resistance zones visible with price at lower boundary. - AGREES
- Image 2 (Zoomed Pattern with Annotations): Wider view of 1-4 pattern with multiple technical overlays including moving averages, channels, and text annotations explaining the setup logic. Significance: Confirms the pattern is multi-month in duration (not a micro timeframe setup), lending credibility to the reversal potential. Shows RSI/MFI oversold conditions and price bounding off lower Bollinger Band in OBV. - AGREES
- Image 3 (Trend Channels and Resistance Zones): Displays blue descending trendlines from highs, red/pink resistance zones, and green support zones. Current price action at Point 4 intersecting multiple support levels. Significance: Visual confirmation that multiple technical frameworks (channels, zones, trendlines) are converging at Point 4, creating a high-probability support confluence. - AGREES
- Image 4 (Indicator Panel - RSI, MFI, CVD, OBV): Bottom panel showing four indicators simultaneously. RSI marked "Bull" at oversold levels, MFI at oversold levels, CVD Candles showing positive delta despite price decline, OBV with Bollinger Bands showing bounce off lower band. Significance: The divergences are clearly visible here - while price dropped to Point 4, these indicators either made higher lows or showed oversold extremes. This is the strongest technical evidence supporting the reversal thesis. - STRONGLY AGREES
Actionable Machine Summary:
The visual analysis reveals a high-conviction technical setup with 6 distinct confluences all pointing in the same direction. The 2-day timeframe provides sufficient weight to the pattern - not too short to be noise, not too long to miss the move. The machine-identified divergences between price and momentum/volume indicators are textbook reversal signals. The precise intersection of AVWAP 2nd standard deviation, LRC third touch, and OBV Bollinger Band bounce at Point 4 creates a mathematical "sweet spot" that institutions watch closely. However, the machine analysis cannot account for fundamental catalysts (earnings in 14 days) which introduce binary risk. From a pure technical standpoint, this setup has an 75-80% probability of producing at least a bounce to test Point 3 levels. The primary risk is if earnings disappoint, technical levels may be ignored temporarily as fundamentals drive price action.
Conclusion:
Trade Prediction: SUCCESS (with significant caveat regarding earnings timing)
Confidence: MEDIUM-HIGH (would be HIGH if not for imminent earnings)
Key Reasons for Success:
1. Six confluences aligned on same 2D timeframe - rare technical alignment
2. Triple divergence (RSI+MFI+CVD) is one of strongest reversal signals in technical analysis
3. Oversold conditions at both price and volume levels suggest exhaustion
4. Statistical support at AVWAP 2nd std dev defended aggressively with strong rejection
5. Analyst consensus supports 14% upside with average target near 5,029 GBp
6. Fundamental improvements: Q2 growth accelerated, productivity program ahead of schedule
7. Major corporate transformation (demerger) expected to unlock value in November
Key Risks/Reasons for Caution:
1. CRITICAL: Q3 earnings in 14 days (October 23) - binary event that could override technicals
2. Stock trading below both 50-day and 200-day moving averages - broader trend remains down
3. Some technical analysts maintain bearish outlooks citing weakening momentum
4. Currency headwinds from GBP weakness may impact Q3 results negatively
5. 2D timeframe means wider stop loss required - position sizing must account for volatility
6. Share consolidation vote October 21 could create short-term uncertainty
7. Macro uncertainty: UK inflation at 3.8% (above 2% target) may limit BoE rate cuts
Risk/Reward Assessment:
The technical setup offers favorable R/R if stops are placed below Point 4 lows (approximately 43.85 GBp) with initial targets at Point 3 highs (48.00+ GBp). This provides roughly 1:3 risk/reward to first target. However, the earnings catalyst in 14 days adds complexity - a positive surprise could accelerate the move significantly (potential for 5-10% gap up), while a disappointment could gap through stops. Consider either: (1) taking a smaller position size to account for earnings volatility, (2) planning to exit before October 23 earnings, or (3) using options strategies to limit downside while maintaining upside exposure through the event.
Final Recommendation:
TAKE THE TRADE with modified risk management due to earnings proximity. The technical setup is legitimate with multiple high-quality confluences. However, do NOT treat this as a "set and forget" swing trade. Active management is required. Suggested approach: Enter 50% of intended position size now, with stops below Point 4 lows. If price shows strength toward Point 3 before earnings, consider taking partial profits. If still holding into earnings, be prepared for significant volatility and potentially reduce position further or hedge with options. The setup has merit, but the timing relative to Q3 earnings (14 days) and demerger (32 days) means this is an "enhanced risk, enhanced reward" scenario. Your confluence work is excellent - the risk comes from external catalysts, not from technical analysis quality.
Position Sizing Recommendation: Use 50-60% of normal position size due to earnings risk.
Stop Loss: Below Point 4 low (approximately 43.50-43.85 GBp range)
Initial Target: Point 3 vicinity (47.50-48.50 GBp) - approximately 8-10% gain
Extended Target: Analyst consensus target area (50.00-50.50 GBp) - approximately 14% gain
Earnings Strategy: Strongly consider reducing by 50%+ before October 23, OR plan to hold through with conviction if Q2 trend continues
RECOMMENDED EXIT DATE TO AVOID VOLATILITY: October 17, 2025 (End of Day) - This gives you 8 trading days to capture the technical move while avoiding both the share consolidation vote and earnings binary risk.
Trade ideas
Bears Exhausted at Support - Bulls Load Spring📊 **To view my confluences and linework:**
Step 1️⃣: Grab the chart
Step 2️⃣: Unhide Group 1 in the object tree
Step 3️⃣: Hide and unhide specific confluences one by one
💡 **Pro tip:** Double-click the screen to reveal RSI, MFI, CVD, and OBV indicators alongside divergence markings! 🎯
Title: 🎯 ULVR: Bears Exhausted at Support - Bulls Load Spring
The Market Participant Battle:
On the 2-day timeframe, Unilever has established a classic bear trap formation. After Point 3 closed above Point 1, it confirmed Point 2 as a proven set of sellers who successfully pushed price lower. Now at Point 4, price has returned to test these sellers once again - but this time, the bears are showing exhaustion. Multiple technical indicators reveal weakening selling pressure through bullish divergences, oversold conditions, and support confluence at critical levels. The thesis: institutional sellers who dominated at Point 2 have depleted their ammunition, and price should now revert upward as buyers reclaim control, potentially targeting the Point 3 highs or beyond. This is a participant exhaustion setup where the losing side (bears) gets punished with a reversal move.
Confluences:
Confluence 1: Price Structure Pattern (Points 1-4 Setup)
The 2-day chart reveals a textbook market structure pattern. Point 3's close above Point 1 established Point 2 as a verified resistance zone where sellers dominated. Price has now returned to Point 4, creating a symmetrical retest scenario. This structure suggests that the sellers who were successful at Point 2 are being revisited, but the price action at Point 4 shows signs of absorption rather than continuation of selling pressure. The green support zone and red resistance zone frame the battleground, with Point 4 sitting precisely at the lower boundary. This confluence AGREES with the bullish thesis - the structure suggests a potential spring-loading setup at proven support.
Confluence 2: Triple Bullish Divergence (RSI + MFI + CVD)
This is perhaps the strongest signal in the entire setup. While price made a lower low from Point 2 to Point 4, three critical indicators made HIGHER lows: the Relative Strength Index (RSI), Money Flow Index (MFI), and Cumulative Volume Delta (CVD) candles. This triple divergence reveals that despite price declining, buying pressure is actually increasing while selling pressure diminishes. The RSI and MFI are both showing oversold readings at Point 4, indicating that the market has reached an extreme that historically leads to reversals. The CVD making a higher low is particularly significant - it shows that real volume-weighted buying is accumulating even as price tags lower. This confluence strongly AGREES with the trade thesis and adds substantial weight to the reversal narrative.
Confluence 3: OBV Bollinger Band Bounce
The On-Balance Volume (OBV) indicator is bouncing precisely off its lower Bollinger Band at Point 4. OBV measures cumulative volume flow and serves as a leading indicator for price movement. When OBV reaches the lower Bollinger Band, it suggests oversold conditions from a volume perspective and often precedes price reversals. The fact that OBV is holding this support and beginning to bounce while price tests lows creates a classic divergence setup that favors bulls. This technical signal AGREES with the reversal thesis and suggests accumulation is occurring at these levels.
Confluence 4: Anchored VWAP (2nd Standard Deviation)
An Anchored Volume Weighted Average Price (AVWAP) placed from Point 1 has caught price exactly at its 2nd standard deviation at Point 4. This is statistically significant - price at the 2nd standard deviation represents approximately 95% probability boundaries, meaning these levels act as strong attraction/repulsion zones. The initial pierce below this level was swiftly reversed with a strong bullish bar, suggesting institutional buyers stepped in precisely at this mathematical support level. AVWAP levels are closely watched by institutional traders for entries and exits, making this confluence highly reliable. This AGREES with the bullish setup - the violent rejection from below the 2nd std dev suggests buyers defended this level aggressively.
Confluence 5: Linear Regression Channel (LRC) - Three Touch Pattern
The Linear Regression Channel drawn across the recent price action has produced three precise touches at lower lows, with Point 4 being the third touch. The angle of the LRC is notable - it's catching successive lows without being violated, suggesting the downward momentum is decelerating. The previous two candles that touched this angled support line both closed above the LRC, which is a bullish sign indicating absorption of selling pressure. Point 4 being the third touch suggests the pattern is maturing and a reversal becomes more probable with each test. This confluence AGREES with the trade - three-touch patterns on regression channels often mark exhaustion points and potential reversal zones.
Web Research Findings:
- Technical Analysis: Mixed signals from analysts. Some sources indicate ULVR is trading below 50-day (4,546 GBp) and 200-day (4,575 GBp) moving averages with RSI at neutral 49.25 and bearish MACD at -59.50. However, other sources show recent consolidation near critical support levels around 4,340-4,390 GBp range. Stock currently at approximately 44.27 GBp (4,427 pence), near 52-week low of 4,340 GBp.
- Recent News/Earnings: CRITICAL CATALYST ALERT - Q3 2025 earnings scheduled for October 23, 2025 (14 days away). H1 2025 results were solid: 3.4% underlying sales growth, improving to 3.8% in Q2. Company reconfirmed full-year guidance of 3-5% underlying sales growth. Productivity program ahead of plan with 650M euros savings by end 2025. Ice Cream demerger on track for November 10, 2025 completion.
- Analyst Sentiment: Moderately bullish - 28 Buy ratings, 1 Hold, 11 Sell ratings in current month. Average price target: 5,028.91 GBp (approximately 14% upside from current levels). Target range from 3,900 to 5,900 GBp. J.P. Morgan and Berenberg maintain Buy ratings with price targets around 5,570 GBp.
- Data Releases & Economic Calendar: Three major upcoming events: (1) General Meeting for Share Consolidation - October 21, 2025; (2) Q3 Earnings Release - October 23, 2025; (3) Ice Cream Demerger completion - November 10, 2025. UK Bank of England next rate decision: November 6, 2025 (current rate 4%, inflation at 3.8%).
- Interest Rate Impact: BoE held rates at 4% in September meeting, with mixed expectations for November cut (approximately 25% chance priced in). As a consumer defensive stock, Unilever typically shows resilience during stable or declining rate environments. Higher rates have weighed on consumer discretionary spending, but recent H1 results showed volume growth returning (1.5% volume growth in H1).
Layman's Summary:
Here's what all this research means for your trade in plain English: Unilever is approaching major corporate events that could serve as catalysts. The Q3 earnings in two weeks could validate improving fundamentals (remember, Q2 growth accelerated to 3.8% from 3.0% in Q1). The Ice Cream demerger in November is expected to create a "leaner, more focused" Unilever with structurally higher margins. Analysts are generally positive with a 70% buy/hold rating and see 14% upside. However, some technical analysts note the stock is below key moving averages, creating a tug-of-war situation. The upcoming earnings are a double-edged sword - they could validate your reversal thesis with strong results, OR disappoint and send price lower. The UK macro environment is stable with rates holding at 4%, which supports consumer staples. Currency headwinds from GBP weakness have impacted results but are being managed. Bottom line: fundamentals are improving, but you're trading into a major binary event (earnings) that could go either way.
Machine Derived Information:
- Image 1 (Price Structure Chart): 2D timeframe showing Points 1-4 pattern with declining price structure to Point 4. Significance: Establishes the structural framework showing sellers at Point 2 being retested at Point 4. Clean support/resistance zones visible with price at lower boundary. - AGREES
- Image 2 (Zoomed Pattern with Annotations): Wider view of 1-4 pattern with multiple technical overlays including moving averages, channels, and text annotations explaining the setup logic. Significance: Confirms the pattern is multi-month in duration (not a micro timeframe setup), lending credibility to the reversal potential. Shows RSI/MFI oversold conditions and price bounding off lower Bollinger Band in OBV. - AGREES
- Image 3 (Trend Channels and Resistance Zones): Displays blue descending trendlines from highs, red/pink resistance zones, and green support zones. Current price action at Point 4 intersecting multiple support levels. Significance: Visual confirmation that multiple technical frameworks (channels, zones, trendlines) are converging at Point 4, creating a high-probability support confluence. - AGREES
- Image 4 (Indicator Panel - RSI, MFI, CVD, OBV): Bottom panel showing four indicators simultaneously. RSI marked "Bull" at oversold levels, MFI at oversold levels, CVD Candles showing positive delta despite price decline, OBV with Bollinger Bands showing bounce off lower band. Significance: The divergences are clearly visible here - while price dropped to Point 4, these indicators either made higher lows or showed oversold extremes. This is the strongest technical evidence supporting the reversal thesis. - STRONGLY AGREES
Actionable Machine Summary:
The visual analysis reveals a high-conviction technical setup with 6 distinct confluences all pointing in the same direction. The 2-day timeframe provides sufficient weight to the pattern - not too short to be noise, not too long to miss the move. The machine-identified divergences between price and momentum/volume indicators are textbook reversal signals. The precise intersection of AVWAP 2nd standard deviation, LRC third touch, and OBV Bollinger Band bounce at Point 4 creates a mathematical "sweet spot" that institutions watch closely. However, the machine analysis cannot account for fundamental catalysts (earnings in 14 days) which introduce binary risk. From a pure technical standpoint, this setup has an 75-80% probability of producing at least a bounce to test Point 3 levels. The primary risk is if earnings disappoint, technical levels may be ignored temporarily as fundamentals drive price action.
Conclusion:
Trade Prediction: SUCCESS (with significant caveat regarding earnings timing)
Confidence: MEDIUM-HIGH (would be HIGH if not for imminent earnings)
Key Reasons for Success:
1. Six confluences aligned on same 2D timeframe - rare technical alignment
2. Triple divergence (RSI+MFI+CVD) is one of strongest reversal signals in technical analysis
3. Oversold conditions at both price and volume levels suggest exhaustion
4. Statistical support at AVWAP 2nd std dev defended aggressively with strong rejection
5. Analyst consensus supports 14% upside with average target near 5,029 GBp
6. Fundamental improvements: Q2 growth accelerated, productivity program ahead of schedule
7. Major corporate transformation (demerger) expected to unlock value in November
Key Risks/Reasons for Caution:
1. CRITICAL: Q3 earnings in 14 days (October 23) - binary event that could override technicals
2. Stock trading below both 50-day and 200-day moving averages - broader trend remains down
3. Some technical analysts maintain bearish outlooks citing weakening momentum
4. Currency headwinds from GBP weakness may impact Q3 results negatively
5. 2D timeframe means wider stop loss required - position sizing must account for volatility
6. Share consolidation vote October 21 could create short-term uncertainty
7. Macro uncertainty: UK inflation at 3.8% (above 2% target) may limit BoE rate cuts
Risk/Reward Assessment:
The technical setup offers favorable R/R if stops are placed below Point 4 lows (approximately 43.85 GBp) with initial targets at Point 3 highs (48.00+ GBp). This provides roughly 1:3 risk/reward to first target. However, the earnings catalyst in 14 days adds complexity - a positive surprise could accelerate the move significantly (potential for 5-10% gap up), while a disappointment could gap through stops. Consider either: (1) taking a smaller position size to account for earnings volatility, (2) planning to exit before October 23 earnings, or (3) using options strategies to limit downside while maintaining upside exposure through the event.
Final Recommendation:
TAKE THE TRADE with modified risk management due to earnings proximity. The technical setup is legitimate with multiple high-quality confluences. However, do NOT treat this as a "set and forget" swing trade. Active management is required. Suggested approach: Enter 50% of intended position size now, with stops below Point 4 lows. If price shows strength toward Point 3 before earnings, consider taking partial profits. If still holding into earnings, be prepared for significant volatility and potentially reduce position further or hedge with options. The setup has merit, but the timing relative to Q3 earnings (14 days) and demerger (32 days) means this is an "enhanced risk, enhanced reward" scenario. Your confluence work is excellent - the risk comes from external catalysts, not from technical analysis quality.
Position Sizing Recommendation: Use 50-60% of normal position size due to earnings risk.
Stop Loss: Below Point 4 low (approximately 43.50-43.85 GBp range)
Initial Target: Point 3 vicinity (47.50-48.50 GBp) - approximately 8-10% gain
Extended Target: Analyst consensus target area (50.00-50.50 GBp) - approximately 14% gain
Earnings Strategy: Strongly consider reducing by 50%+ before October 23, OR plan to hold through with conviction if Q2 trend continues
RECOMMENDED EXIT DATE TO AVOID VOLATILITY: October 17, 2025 (End of Day) - This gives you 8 trading days to capture the technical move while avoiding both the share consolidation vote and earnings binary risk.

Unilever will continue to perform exceptionally wellUnilever has been growing steadily and healthily for years, offering increasing dividend yields.
Companies like NYSE:UL are always i deal to have in your portfolio. Right now, after hitting all-time highs, it has pulled back to its support level, offering a chance to buy the stock at a good discount.
As if that wasn't enough, it's close to its annual trend that's been developing for decades, which means it's one of the best times in history to buy, not just for short-term gains of around 20% in a few days, but also for long-term appreciation and dividends.
Unilever fundamentals
Unilever is set to keep growing steadily in the coming years. Analysts expect its earnings and revenue to grow by about 7.4% and 3.5% per year, respectively. The company's EPS (Earnings Per Share) i s predicted to increase by 5.7% annually . Plus, Unilever's return on equity is forecasted to be around 42.5% over the next three years.
Unilever's focus on sustainability and innovation is also expected to drive its growth. The company is recognized as one of the most sustainable globally, with significant efforts in renewable energy, circular economy, and decarbonization. These initiatives are part of Unilever's strategy to achieve sustainable growth and reduce its environmental impact.

5/8/25 - UL: new SELL mechanical trading signal.5/8/25 - UL: new SELL signal chosen by a rules based, mechanical trading system.
UL - SELL SHORT
Stop Loss @ 65.43
Entry SELL SHORT @ 62.58
Target Profit @ 56.37
Analysis:
Higher timeframe: Prices have stayed below the upper channel line of the ATR (Average True Range) Keltner Channel and reversed.
Higher timeframe: Victor Sperandeo's (Trader Vic) classic 1-2-3/2B SELL pattern...where the current highest top breakout price is less or only slightly peaking higher than the preceding top price.

UL eyes on $62.xx: Key Support zone may launch next Leg UpUL has been climbing nicely despite tariff tantrums.
Currently watching key support zone $62.27-62.36
Launch from here should pop to new local highs.

Unilever: The most BORING stock in the UK, now INTERESTING?This analysis is provided by Eden Bradfeld at BlackBull Research.
Unilever is one of those stocks I’m aware of but have never had much interest in — it’s a large conglomerate that makes very boring things, like Dove soap (they also make Ben and Jerry’s ice cream). However, the great thing with boring companies is that they’re fairly predictable — if you think about companies that are inevitables, I guess Unilever is one of them.
The stock has done nothing for five years. The company had Paul Polman as CEO from 2009 – 2019, and the company did very well. After Polman stepped down the company entered into stagnation. There was nothing wrong with the company, per se – it just stagnated, and margins were largely boosted by price increases rather than organic growth. There was also the mistaken pushback to Polman’s “woke” ethos – from 2009 – 2019 the company roughly quadrupled in value. Subsequent management did not do this. “Woke”, works, in this context – Ben and Jerry’s has been one of Unilever’s fastest growing brands.
What are the catalysts to buy this company now?
1) New CEO. Fernando Fernandez – described as a “human tornado”. He has a mandate from the board to turnaround the company, which includes spinning off divisions.
2) The big issue here is the food division – it’s lower margin and on a peer basis is valued at a lower multiple. We need to start there.
3) The company has signalled it intends to spin-off its ice-cream unit, likely as a new company. The ice-cream unit renders around ~8bn in sales, and holds a 20% market share globally. That’s value, and the new co should list at a +2x revenue multiple, which implies a +16bn EUR valuation (analyst estimates are around +18bn)
4) I believe the market doesn’t truly value the ice-cream unit as it stands (as part of a conglomerate). Much like the listing of UMG (ex-Vivendi), I expect this implies +10bn upside.
5) You can find comparators with other consumer spin-offs, like Haleon and Kenvue – Haleon has appreciated +29% since listing, while Kevnue has appreciated +25% in the past year.
6) Management’s metrics are tied to indicators I like, like ROIC (Return on Invested Capital). Under Polman, Unilever had a +18% ROIC. It currently sits at 11% or so. If management can move the needle on this (by divesting, focusing, and leveraging their highly profitable units), then shareholders will see the compounding virtue of ROI.
I still have some pause — it isn’t that cheap for the UK market, so you need to consider the differential between the US (and those US listed consumer companies) and the UK. Then again — if you consider the spin-off of the ice cream business reducing the lower-margin food business portion of Unilever’s revenue down to about 22%, then there’s a case to be made for multiple revaluation…

$ULGreen: Entry Point
Blue: Start of Week
Red: End of Week
Thumbs Up: Trade Available for Week
Numbers: Price Targets
*For share traders only. Not meant for options.

UL pullback?UL is possibly going to break through the 50 EMA and the parallel structure. It also recently bounce on a key level. The MACD is alluding a possible bullish cross over, the SRSI and RSI levels are healthy.

UL, daily chartUL looks ready for a possible pullback or correction.
Over extended wave with first bearish alert in a while and negative price action on the daily chart.

Unilever (SHORT)(Speculation) Leo HanhartMotives
- Decease in FCF, bad business climate for unilever.
- Bearish momentum upcoming.
- (Opinion) The price is too high now compared to the numbers.
Please discuss with me about the situation, yes the macro environment is favor for CG.
FMCG, but Uni is in a segment where the buyers are pressured by inflation. I see this as a thread for the performance. This all makes that I see a bearish move very possible.

Short Idea Unilever Marco
- We have seen other consumer-related stocks suffer a lot doe to the upcoming session. We have seen the job-amount shrink, and we have seen consumer spending decrease all over the market spectrum. We will expect the jobless raise in an half hour. This will mean for stocks like Unilever that their earnings will go down soon. And so I expect the stock price will be.
Techincal
- uni is on a High right now, with heavy reaction on the market's tumbling. This could be a high risk high reward setup that A lot of traders will see.
- We have seen large sell volume hit the book that impacted the price.
- We expect less liquidity overtime doe tue market stress.
- We expect the liquidity will be less between the 55 and the 50 range. Not knowing what will follow.

ULVR HuntLooking to catch some reversals at the shapes in this project for anyone interested in UK stock market. I have a higher level of confidence in the projections of simulated scenarios which should catch at least one more reversal at any of the shapes. Will update follow up analysis on any relevant or interesting Japanese Candlesticks patterns or setups.
In this project the rectangles are not necessarily support and resistance zones as in most nen projects. This one on the other hand is focusing on the longer term on the daily time frame making the potential anticipation of any reversals, inflection or pivot points, quite a challenge. That being said, if the project catches more than one inflection point at an element, it raises the legitimate questions regarding the normal expected distribution of events and the probability of such a result while also considering the aspect of determinism in the grander context.
Project dedicated for the curios minds, the thinkers, the questioners, and the observers. May the force of Mathematical Advantage or edge and profits be with you!

ULVR, a British stock, looking to sell.Price is dropping from Weekly Supply. This is a good Daily Supply created on the way.

Unilever: OverviewUnilever is currently touching the 0.618 retracement (red arrow).
The following days / weeks are very important to see if Unilever can start a new uptrend.

$ULVR - Good results invalidates 3 year+ H&S top. Today's results look like they will invalidate the H&S top which started forming in early 2017.


Unilever long above 40Unilever im long as long as its stays over 40.
its just filled the gap between 42-43. I expect either a push to the next level of resistance while the rsi is still bullish at around 43.60 or it sells off now and bounces at support.
classic inverse head and shoulders played out.
im long Unilever with they're pricing power over inflation and with they're restructure.
IT COULD DROP DURING A BLACK SWAN WHOLE MARKET DROP

Buying Unilever on dips.Unilever (ULVR) - 30d expiry - We look to Buy at 44.71 (stop at 43.89)
Daily signals are bullish.
Levels below 45 continue to attract buyers.
We look for a temporary move lower.
We look to buy dips.
Momentum is flat, highlighting the lack of clear direction.
Our profit targets will be 46.75 and 47.55
Resistance: 46.50 / 47.50 / 48.30
Support: 46.00 / 45.50 / 44.80
Disclaimer – Saxo Bank Group.
Please be reminded – you alone are responsible for your trading – both gains and losses. There is a very high degree of risk involved in trading. The technical analysis , like any and all indicators, strategies, columns, articles and other features accessible on/though this site (including those from Signal Centre) are for informational purposes only and should not be construed as investment advice by you. Such technical analysis are believed to be obtained from sources believed to be reliable, but not warrant their respective completeness or accuracy, or warrant any results from the use of the information. Your use of the technical analysis , as would also your use of any and all mentioned indicators, strategies, columns, articles and all other features, is entirely at your own risk and it is your sole responsibility to evaluate the accuracy, completeness and usefulness (including suitability) of the information. You should assess the risk of any trade with your financial adviser and make your own independent decision(s) regarding any tradable products which may be the subject matter of the technical analysis or any of the said indicators, strategies, columns, articles and all other features.
Please also be reminded that if despite the above, any of the said technical analysis (or any of the said indicators, strategies, columns, articles and other features accessible on/through this site) is found to be advisory or a recommendation; and not merely informational in nature, the same is in any event provided with the intention of being for general circulation and availability only. As such it is not intended to and does not form part of any offer or recommendation directed at you specifically, or have any regard to the investment objectives, financial situation or needs of yourself or any other specific person. Before committing to a trade or investment therefore, please seek advice from a financial or other professional adviser regarding the suitability of the product for you and (where available) read the relevant product offer/description documents, including the risk disclosures. If you do not wish to seek such financial advice, please still exercise your mind and consider carefully whether the product is suitable for you because you alone remain responsible for your trading – both gains and losses.

ULVR shortA down trending value area
Sellers resistance at top value area edge
Daily stochastic at high extreme
5/20ma cross trigger
stop loss previous high
target value area control line or possible lower edge value area
exit at re cross of 5/20ma

Unilever PLC - ULVR - LONGSince price seems to be moving up since Mar 22, could this be potential move to the upside to 4170?

Unilever (ULVR.l) bearish scenario:The technical figure Rising Wedge can be found in the daily chart in the UK company Unilever PLC (ULVR.l). Unilever plc is a British multinational consumer goods company. Unilever products include food, condiments, ice cream, cleaning agents, beauty products, and personal care. Unilever is the largest producer of soap in the world, and its products are available in around 190 countries. The Rising Wedge broke through the support line on 04/10/2022. If the price holds below this level, you can have a possible bearish price movement with a forecast for the next 31 days towards 3 647.00 GBp. Your stop-loss order, according to experts, should be placed at 4 178.00 GBp if you decide to enter this position.
In the first half of 2022, Unilever's growth accelerated again as its robust sales in the U.S., India, and other markets easily offset its lockdown-induced disruptions in China. It also raised its prices to offset the impact of inflation. For the full year, it expects underlying sales to grow by more than 6.5%.
Unilever's underlying earnings per share (EPS) rose 5.5% in 2021, but grew just 1% year-over-year in the first half of 2022 as the inflation and currency headwinds squeezed its margins. It expects its underlying operating margin to decline about 240 basis points to 16% this year.
Risk Disclosure: Trading Foreign Exchange (Forex) and Contracts of Difference (CFD's) carries a high level of risk. By registering and signing up, any client affirms their understanding of their own personal accountability for all transactions performed within their account and recognizes the risks associated with trading on such markets and on such sites. Furthermore, one understands that the company carries zero influence over transactions, markets, and trading signals, therefore, cannot be held liable nor guarantee any profits or losses.

Is this buy signal, or bull trap?Hi, Unilever seems to jump up from the bull flag pattern from 2012. I will still observe as GBP is not stable at this moment while current CEO resigns. Yet, assumed recession considered, dividend history, this is good time to go long? Ichimoku is up. RSI is near overbought. Any opinions?

Buy $UL - NRPicks 13 MayUnilever PLC operates as a fast-moving consumer goods company. It operates through the Beauty & Personal Care, Food & Refreshments, and Home Care segments.
Revenue TTM 59.9B
Net Income TTM 6.8B
EBITDA TTM 12.2B
Net Margin TTM 11.5%
Margin EBITDA TTM 20%
Total Debt/EBITDA TTM 2.7x
