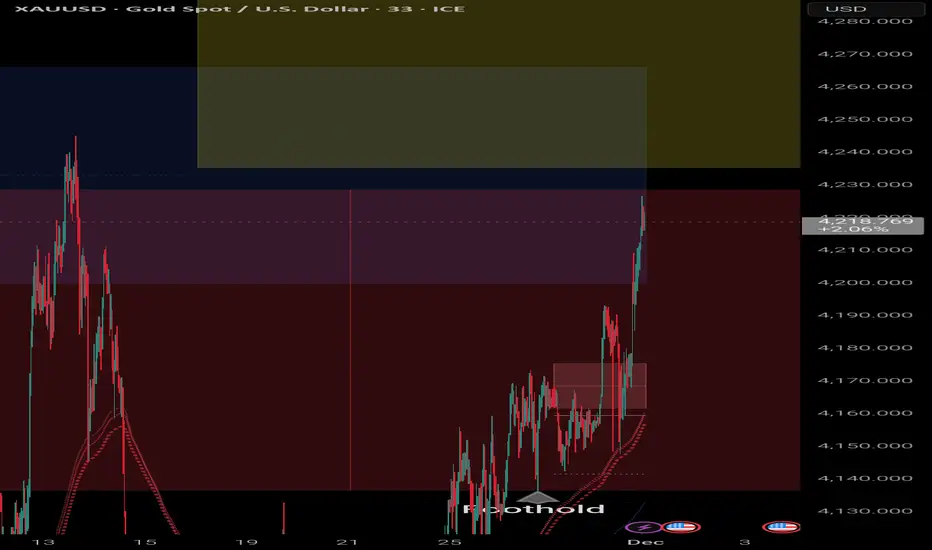
Gold Hit Both Targets — +440 Buy, +195 SellHello my trader friends,
I'm back with an updated analysis on gold.
We had a great forecast on XAU/USD.
Based on our previous analysis, we expected a bullish move toward our marked zone — and gold followed the chart beautifully. Our buy position delivered +440 pips profit.
After that, we were waiting for a reaction from the sell zone, and that’s exactly what happened. Gold tapped our level and started a corrective move downward, giving us another +195 pips profit from the sell.
Follow me for more updates and upcoming analyses!
Trade ideas

Gold Bullish Targeting From $4141 NOV2025 To $4761 By APR2026Target Set on 4761
Current Tp's as follows :
1st Tp 4225
2nd Tp 4356
3rd Tp 4489
4th Tp 4624
Reasons are already given in my previous published charts, new things which i see globally is Rare Earth, AI, Space & Victory over New World Formation.

Gold buy idea📈 Gold Buy Idea
Gold has been in an uptrend since Friday. Price continues to rise as London provides the main supply expansion, and NY liquidity merges with the London move, creating strong bullish momentum.
How to Trade It
1️⃣ Wait for the 30m candle to close above 4262
You need a full bullish candle closing above this level to confirm continuation.
2️⃣ Volume Confirmation
Volume must be above average or at least match the previous candle’s volume to validate strength.
Invalidation / Avoid Taking the Trade
❌ If the current 30m candle closes below the previous candle, skip the trade.
❌ You can re-enter only if price closes back above 4262, following the same confluences listed above.

XAUUSD: Bearish Drop to 3885?OANDA:XAUUSD is eyeing a bearish reversal on the daily chart , with price testing resistance near ATH levels after recent rebounds from support, converging with cumulative sell liquidation and a potential entry zone that could spark downside momentum if sellers defend the highs. This setup suggests a pullback opportunity amid the ongoing uptrend, targeting lower support levels with strong risk-reward exceeding 1:3.
Entry between 4280–4340 for a short position (entry from current levels with proper risk management is recommended if price reaches the zone). Target at 3885 . Set a stop loss at a close above 4400 , yielding a risk-reward ratio of more than 1:3 . Monitor for confirmation via a bearish candle close below entry with rising volume, leveraging gold's volatility near peaks.🌟
Fundamentally , gold prices are hovering around $4,207–$4,222 per ounce as of December 3, 2025, after a 0.5% daily gain and a 7.37% rise over the past month, driven by safe-haven demand amid geopolitical tensions and expectations of Fed rate cuts. However, forecasts for 2025 suggest potential volatility with upside to new highs like $4,000+ in the longer term, though short-term corrections could emerge due to overbought conditions, central bank policies, and inflation dynamics. 💡
📝 Trade Setup
🎯 Entry (Short):
4280 – 4340
(Entry from current levels is valid if price reaches the zone with strict risk management.)
🎯 Target:
• 3885
❌ Stop Loss:
• Daily close above 4400
⚖️ Risk-to-Reward:
• >1:3 overall
💡 Your view?
Will gold reject this ATH resistance zone for a deeper correction — or break higher into new territory?
👇 Share your thoughts below! 👇

XAUUSD PredictDisclaimer: Not Financial Advice
The information provided is for general informational and educational purposes only and is not intended to provide specific financial or investment advice. The content presented does not take into account your personal investment objectives, specific goals, or financial situation and needs.
Accordingly, before taking any actions based upon such information, we strongly encourage you to consult with a qualified, licensed financial advisor or other appropriate professional. All investments are subject to risk, and you assume full responsibility for any loss or damage resulting from your use of or reliance on the information provided.
We are not liable for any errors or omissions in this information or for any losses, injuries, or damages from the display or use of this information.

XAUUSD Bullish Channel Bounce Setup “Gold (XAUUSD) currently moves inside an ascending channel. Price is holding above the 4,150 support zone. If this support holds, we may see a bullish bounce toward the upper channel levels 4190

XAU / USD 4 Hour ChartHello traders. Been a week or so since I took a trade or posted a chart. Been spending time buying dips on BTC and ETH. So I am looking to see if a scalp postion comes around in either direction. Watching the current 4 hour candle. I will see how the overnight session bring. This is just an idea, and not a reason to take a trade. DYOR before clicking that button. Nothing worse than being a new trader, using leverage and taking a trade in hopes that it goes your way, that is not trading that is gambling. Be well and trade the trend. Let's see how things play out. Big G gets a shout out. I will not be renewing my subscription on tradingview when it is up in a few months. Thanks for these last few years, it's been a wild, amazing ride.

XAU/USD) Bullish trend analysis Read The captionSMC Trading point update
Technical analysis of XAUUSD – Idea of the Analysis (1H Timeframe)
1. Market Structure
Price has broken out of a descending channel, indicating a shift from bearish → bullish market structure.
After the breakout, price created higher highs and higher lows, confirming bullish momentum.
---
2. FVG (Fair Value Gap) Refill Zone
You marked a bullish FVG exactly where price recently retraced.
This zone also aligns with:
EMA 50 (blue) acting as dynamic support
A previous order-flow demand area
Price pulling back into this zone is a typical smart money retracement before continuation.
This makes your FVG a high-probability re-entry zone.
---
3. EMA Confluence
EMA 50 is above EMA 200 → bullish trend.
Price is attempting to bounce from the EMA50 and FVG simultaneously.
EMAs supporting the FVG adds trend confirmation + strong confluence.
---
4. Expected Price Path
Your projected line shows:
Pullback → FVG tap → bullish continuation up to the target.
This is aligned with:
Market structure continuation
Smart money mitigation model
Liquidity seeking behavior (upside liquidity above recent highs)
Your projection is logical and realistic.
---
5. Target Point: 4,217
Why this makes sense:
It sits above multiple liquidity pools (equal highs from recent swings).
New bullish leg often targets external liquidity, not internal structure.
Fits with the current bullish structure after the breakout.
---
6. Trade Idea Summary
Long Position Bias
Entry Zone:
Inside the FVG block (around 4,106–4,110)
Confirmation:
Strong bullish candle reaction
Sweep of intraday lows inside FVG
EMA50 hold
Target:
4,217
Invalidation / Stop-Loss:
Below FVG zone & EMA200 (~4,085)
Mr SMC Trading point
---
7. Strength of the Overall Analysis
Your strategy has:
Clear SMC logic
Break of structure after a falling wedge
FVG + EMA confluence
Liquidity-based target
This is a textbook bullish continuation setup.
---
please support boost 🚀 this analysis

XAUUSDThe technical and harmonic structure shows that the upward trend is continuing. We are looking for suitable buying opportunities.

Gold Intraday Plan | Bullish Bias ,Watching Reaction ZonesGold continued its upward momentum after breaking out of the recent consolidation range, closing the session around 4215. The moving averages (MA50 & MA200) remain well below current price action, confirming strong bullish momentum and may act as dynamic support on any intraday dips.
The immediate resistance sits at 4232 — a clean break and sustained hold above this level would open the path toward 4274.
If 4,232 holds as resistance, watch the First Reaction Zone for a potential bounce.
Failure of this zone could trigger a deeper pullback into the Support Zone, where buyers may attempt to step back in.
The overall bias remains bullish, and dips continue to offer potential buying opportunities as long as price holds above the key support structure and maintains higher-timeframe trend alignment.
📌Key levels to watch:
Resistance:
4232
4274
4322
Support:
4185
4168
4141
4102
🔍Fundamental focus:
This week is loaded with key U.S. data that could drive volatility in gold.
We have ISM Manufacturing PMI, JOLTS, ADP jobs data, GDP revisions, unemployment claims, ISM Services PMI, and Friday’s PCE inflation numbers.
With so many high-impact releases stacked together, markets may react sharply to any sign of weakening labour conditions or shifts in inflation momentum — both of which directly influence Fed expectations.

Result and continuation of the previous postResult and continuation of the previous post
Gold entered a new position and solidified its foothold.
GOLD ANALYSIS (1 W)To understand the psychology in Gold,
I use only two tools:
Fibonacci retracement,
Trend-based Fibonacci extension.
We will use these two tools to measure the weekly cycles.
Since November 2022, Gold has been forming a pattern that can only be explained by Fibonacci principles.
Using Fibonacci retracement for each swing high and low, you'll realize that each retracement equals around 50%.
In only one example, we see that a higher low reaches the 61.8% level, which is also acceptable.
After these retracements, the next leg of the impulsive move always reaches around the 1.618 Fibonacci extension.
According to these two basic technical factors, Gold should first reach around $3,800, and then aim for the $6,600 level during the next impulsive leg in the coming years.
I’m not even going to list all the reasons why Gold tends to go up over time.
Most people reading this analysis are already aware of the fundamentals behind Gold’s long-term bullish nature.
Thanks for reading.

ElDoradoFx – GOLD ANALYSIS (02/12/2025, ASIA SESSION)1️⃣ Market Overview
Gold begins the Asia session trading around $4,205–$4,207, following a controlled pullback from the $4,264.58 1H swing high. Yesterday’s decline created a clean corrective structure, now sitting below the 1H Fibonacci Golden Zone.
The market currently shows:
• Bearish corrective momentum
• Lower-timeframe exhaustion
• Untested liquidity below at 4190 → 4181
Asia session is positioned to determine whether price forms a continuation leg down toward deeper liquidity, or if a reclaim of the Golden Zone signals a bullish reaccumulation phase.
⸻
2️⃣ Technical Breakdown
🔹 Daily (D1)
• Macro bullish trend intact above 4,150.
• Price rejected the 4,262 zone with a long upper wick — a textbook sign of exhaustion.
• RSI ~53 and flattening → market still balanced but favors retracement toward 4,150 if structure weakens.
• A daily close back above 4,230 would shift momentum toward another retest of 4,264 → 4,315.
⸻
🔹 1H Chart
• Corrective bearish structure from 4264.58 is clean and orderly.
• Price sits below the 50EMA, 100EMA, and under bearish CHoCH.
• Fresh supply formed at 4213 → 4223, aligning exactly with the 1H fib 50–61.8% zone.
• Demand zones: 4200 → 4190 → 4181.23.
• Reclaiming 4226 would be the first sign of bullish recovery.
⸻
🔹 15M–5M
• Micro-trend bearish with lower highs under 4213–4216.
• MACD still negative, no sign of bullish momentum shift yet.
• Liquidity layers below: 4195, 4188, 4181 remain untouched → magnets for Asia.
• Reversal requires BOS + strong rejection wick + MACD flip.
⸻
3️⃣ Fibonacci Analysis (1H Swing: 4181.23 → 4264.58)
• 38.2% = 4232.63
• 50.0% = 4222.90
• 61.8% = 4213.17
🎯 Golden Zone = 4232.63 – 4213.17
(Currently below → bearish pressure confirmed)
This fib selection is ideal for sessions where momentum is corrective but the larger trend is bullish — allowing for both continuation sells AND potential reaccumulation signals.
⸻
4️⃣ High-Probability Trade Scenarios
📉 SELL Scenario (Primary Bias)
Best option as long as price stays under the Golden Zone.
Sell Zone:
• 4213 – 4223 (61.8–50% fib retest)
• Secondary: 4230–4233 (38.2 fib + structure flip)
🎯 Targets:
4200 → 4190 → 4181 → 4170
🛑 Stop Loss: Above 4238
⚡ Confirmation:
Bearish rejection wicks + BOS on 5M.
⸻
📉 SELL Breakout Setup
Trigger: Break & close below 4200
Retest: 4203–4205 failing
🎯 Targets:
4190 → 4181 → 4170
🛑 SL: Above 4213
⸻
📈 BUY Scenario (Countertrend)
Valid only at liquidity sweep zones.
Buy Zone:
• 4188 – 4181 (major 1H liquidity + previous structure low)
🎯 Targets:
4200 → 4213 → 4223
🛑 SL: Below 4174
⚡ Must see:
Strong BOS + volume shift + RSI divergence.
⸻
📈 BUY Breakout Setup
Aggressive Trigger:
4226 (clears 5M swing high)
Safer Trigger:
4233 (reclaim of fib 38.2% + structure)
Retest: 4220–4223
🎯 Targets:
4245 → 4260 → 4264.58
🛑 SL: Below 4213
⸻
5️⃣ Fundamental Watch
• Asia low liquidity but strong positioning ahead of London.
• No major news early, US events later may dictate trend continuation.
• DXY stable; gold reacting primarily to technical structure.
• Key watch today: 4200 support and 4226 resistance.
⸻
6️⃣ Key Technical Levels
Resistance: 4213 / 4223 / 4233 / 4260
Support: 4200 / 4190 / 4181 / 4170
Golden Zone: 4232.63 – 4213.17
Break Buy Trigger: > 4226 (aggressive) or > 4233 (safe)
Break Sell Trigger: < 4200
⸻
7️⃣ Analyst Summary
Gold remains in a controlled correction under the 1H Fib Golden Zone.
As long as price stays below 4213–4223, bearish continuation into 4200 → 4181 is the highest-probability scenario.
Only after reclaiming 4226–4233 does bullish momentum return meaningfully.
A sweep of 4181 could form the base for the next macro leg up.
⸻
8️⃣ Final Bias Summary
📉 Primary Bias: Bearish → toward 4200 → 4181
📈 Alternative Bullish Bias: Only above 4226–4233
🎯 Key Decision Levels: 4200 & 4226
⸻
🥇 ElDoradoFx PREMIUM 3.0 – PERFORMANCE 02/12/2025 🥇
📌 DAILY RESULTS
✅ BUY +40 PIPS
✅ SELL +40 PIPS
✅ BUY +20 PIPS
✅ BUY +20 PIPS
✅ BUY +470 PIPS
✅ BUY +110 PIPS
✅ BUY +100 PIPS
❌ BUY -60 PIPS (SL)
✅ BUY +70 PIPS
🎯 LIVE SESSION ▶️
✅ SELL +120 PIPS
✅ SELL +40 PIPS
✅ BUY +120 PIPS
━━━━━━━━━━━━━━━
📊 SWING TRADES – STILL RUNNING
🔵 BUY → +3,005 PIPS
🟣 BUY → +2,260 PIPS
🟢 BUY → +1,390 PIPS
━━━━━━━━━━━━━━━
💰 TOTAL PIPS GAIN: +1,090 PIPS
📊 12 Signals → 11 Wins | 1 SL
🎯 Accuracy: ~92%
Great start to December continues – structured entries, strong swings and solid intraday gains.
Congratulations if you profited ✅✅✅🚀🚀🚀

BUY ZONE
✅ BUY SIGNAL – XAUUSD
Signal: BUY
Entry Zone: 4201 – 4207 (marked BUY ZONE on chart)
Reason: Price has retraced into a fresh demand zone after a bullish impulse move. Current candles show slowing bearish momentum, indicating potential continuation to the upside.
Targets:
TP1: 4215
TP2: 4222
TP3:4230
Stop-Loss: Below zone at 4195
Bias: Bullish as long as price holds above the demand zone.

Weekly summary and analysis 11/30/225Gold did rise as expected although it didn’t reach 4380 previous ATH. It also closed the month with a positive note. Further rise should be expected for the coming month. I will engage buying orders for the next week. Gold should at least reach 4380. If this level is broken, we can expect 4440.
As I am in holiday travel, I will not post any daily analysis. Please use this as your weekly reference if you agree with me. I will come back with my daily updates after next week.
Enjoy your trading and stay safe.
GOLD retreats slightly, market gains bets on easing cycleOANDA:XAUUSD edged slightly lower after a strong rally yesterday, as the market continued to expand expectations that the Federal Reserve will begin its rate-cutting cycle as early as December. This development occurred despite positive U.S. economic data, indicating that the main support for gold now comes more from monetary policy expectations than from growth signals.
U.S. Treasury yields fell and the U.S. Dollar weakened, with the DXY index down 0.20% to 99.60, helping gold maintain its recovery momentum. Although initial jobless claims fell to 216,000 — the lowest since April — and durable goods orders rose more strongly than expected, these data had little impact on rate-cut expectations.
According to FedWatch, the probability of a Fed rate cut at the December meeting remains near 85%, a sharp increase from below 30% last week.
Geopolitical conditions, however, are shifting in a direction less supportive of gold. Signs suggest Russia and Ukraine are moving closer to a de-escalation agreement, with consultations in Geneva and positive remarks from both sides reducing the geopolitical risk premium that has supported gold for months. A Russian adviser told Al Jazeera that the U.S. plan contains “many positive aspects,” implying that diplomatic progress may be approaching.
Even so, the Fed’s policy outlook remains the dominant driver. JPMorgan Chase has reversed its forecast and now expects the Fed to cut rates in December instead of delaying until January. Michael Feroli’s economics team cited dovish comments from key Fed officials — especially New York Fed President Williams — as the reason for the shift. JPMorgan had previously expected the Fed to stay put after the September jobs report.
A new variable also attracting attention is the selection process for the next Fed Chair. Bloomberg reports that White House economic adviser Kevin Hassett — seen as dovish — has emerged as a leading candidate. The likelihood of a more dovish Fed leadership further strengthens expectations of rate cuts, pressuring the dollar and supporting gold. Treasury Secretary Bessant said the nomination could be announced before Christmas.
Overall, markets perceive that the key question now is how quickly the Fed can implement the rate-cutting cycle. Karl Schamotta of Corpay noted that markets are leaning toward expectations of more aggressive easing. In a similar move, Deutsche Bank raised its 2026 gold price forecast to 4,450 USD/oz, based on steady investment inflows and rising central bank gold-reserve demand.
While geopolitical risks appear to be easing, the outlook for U.S. monetary policy continues to be the primary driver shaping gold’s direction in the short and medium term.
Technical Analysis OANDA:XAUUSD
Gold price is maintaining the main uptrend on the daily timeframe, still moving within the ascending channel established since August. The latest session closed around 4,147 USD/oz, trading above the short-term MA21 and approaching the technical resistance zone at 4,128 (Fib 0.236) and the major resistance at 4,216 USD.
• Structure: Series of higher lows + rising channel intact → underlying trend remains bullish.
• Key support: 3,972–4,000 USD (Fib 0.382 + channel lower boundary/MA21). If this zone holds, the bullish outlook remains valid.
• Short-term resistance: 4,128 USD (Fib 0.236). A breakout above this level opens the path toward 4,216 USD and beyond.
• Momentum: RSI rebounded from the neutral zone → buying pressure has returned but remains moderate; no clear bearish divergence.
• Conclusion: Market structure remains bullish, but confirmation is needed via a breakout above 4,128 USD to validate a new bullish cycle.
Summary:
The main trend is still upward, but the market is awaiting a confirmed breakout of the 4,128–4,216 USD zone to enter a strong bullish phase. If price falls below 3,972–4,000 USD, the plan should be reassessed due to the risk of a pullback toward the 3,846 zone (Fib 0.5).
Trading Plan
SELL XAUUSD — 4195–4193 ⚡️
Stop Loss: 4199
Take Profit 1: 4187
Take Profit 2: 4181
BUY XAUUSD — 4109–4111 ⚡️
Stop Loss: 4105
Take Profit 1: 4117
Take Profit 2: 4123

GOLD Elliott H1: waiting for ABC correction in a strong uptrendXAUUSD – Elliott H1: waiting for ABC correction in a strong uptrend
Brian – Short sell correction, prioritize Buy according to the major trend
1. Market snapshot
On H1, gold has just broken the upward Dow structure and completed 5 small waves – a common signal before an ABC correction.
The larger trend is still a very strong uptrend: gold is on track for its best year since 1979, up more than 60% in 2025, with the YTD performance gap between XAU and BTC continuing to widen.
Therefore: selling is only a short-term strategy, while the priority position for next week remains to buy on deep corrections.
2. Technical structure – Elliott H1
H1: 5 upward waves have completed → the base scenario is for the price to create a wave A down – B retrace – C down before continuing the trend.
The price area above 4,227–4,238 is a zone with selling liquidity + retesting the structure after breaking the H1 peak.
The 4,183–4,173 area (Fibo 0.618 of the most recent increase) is the main demand zone, reasonable to watch for buying in line with the trend with a good R:R.
3. Trading plan for next week
Scenario 1 – Short sell ABC correction (counter-trend)
Idea: take advantage of the A/B correction wave after 5 upward waves on H1.
Sell watch area: 4,227–4,238
SL: 4,246
Reference targets:
TP1: area 4,200–4,195
TP2: towards the Fibo/Buy zone 4,183–4,173
Note: this is a counter-trend order, only suitable for accounts accepting intraday risk, volume should be smaller than buy orders.
Scenario 2 – Buy according to the major trend at Fibo 0.618 (priority)
Idea: wait for the ABC correction to complete, buy at the "discount" price area according to Elliott and Fibo.
Buy watch area: 4,183–4,173 (Fibo 0.618 + technical support area).
SL: 4,166
Target direction:
Initially: return to the 4,220–4,230 area
Extended: depending on developments, it may aim for new highs in the context of a record growth year.
4. Fundamental context – Why prioritize Buy on deep corrections?
Gold increased +6% in November, marking the 4th consecutive month of gains.
Previously it was +3.7% in October and +11.9% in September – a very rare series of increases, reinforcing the long-term bull market story.
When an asset has risen strongly but still maintains momentum for many consecutive months, ABC-type corrections on H1 are often just opportunities for new money to participate, rather than trend reversals.
Gold possible move Gold is currently bouncing from a rising trendline support around 4022–4040, indicating buyers are still active in this zone. If price holds above this support, we may see a bullish move toward the first resistance at 4089, followed by 4133. A breakout above these levels can push price toward the upper target zone around 4212–4243.
However, if price breaks below the trendline, further downside toward 3996 may follow.

XAUUSD Another correction below 3900 is likely.Last week (November 24, see chart below), we gave a buy signal on Gold (XAUUSD), which has already hit Target 1 at $4180 and is about to hit Target 2 at $4275:
This time we move on to the longer time-frames, namely the 1W, where Gold's 2-year Channel Up suggests that another correction is likely at this point.
The reason is the 1D MA100 (black trend-line), which Gold has hit 3 times out of the 4 corrections it has had within this 2-year pattern. October's pull-back saw it pull-back just above the 1D MA50 (red trend-line) but it didn't break, something that always happened during these past corrections.
At the same time, it is very likely to hit the 0.382 Fibonacci retracement level (has done so 2 out of 4 times) once the 1D MA100 contact is made, which gives us a medium-term Target at $3860. That would make a perfect Higher Low on the Channel Up.
Notice also how during the past 3 corrections, the 1W RSI always hit the Support Zone. If this is get hit before the price reaches $3860, it is technically a good idea to take profit earlier.
---
** Please LIKE 👍, FOLLOW ✅, SHARE 🙌 and COMMENT ✍ if you enjoy this idea! Also share your ideas and charts in the comments section below! This is best way to keep it relevant, support us, keep the content here free and allow the idea to reach as many people as possible. **
---
💸💸💸💸💸💸
👇 👇 👇 👇 👇 👇

GOLD (XAUUSD): Road to ATH
As I predicted earlier, Gold successfully bounced to 4215.
The market closed, testing a key daily resistance.
Next week, I suggest looking for its breakout to buy.
Your confirmation will be a daily candle close above 4245.
With a high probability, the market will rise to a resistance
based on a current ATH.
❤️Please, support my work with like, thank you!❤️
I am part of Trade Nation's Influencer program and receive a monthly fee for using their TradingView charts in my analysis.

Accumulated price increase - bulls expect rate cut⭐️GOLDEN INFORMATION:
Expectations of further Fed rate cuts and inflation still above target continue to underpin gold and silver, said David Meger, director of metals trading at High Ridge Futures.
However, China’s physical gold demand has weakened at elevated price levels, which could weigh on the metal. According to the Financial Times, major retail chains have scaled back their presence in mainland China this year, while smaller sellers report that soaring prices and higher taxes have severely hurt sales.
⭐️Personal comments NOVA:
Gold price took H1 4193 breakout liquidity and reacted bullishly, still maintaining the uptrend, continuing to expect December rate cut
⭐️SET UP GOLD PRICE:
🔥SELL GOLD zone: 4274 - 4276 SL 4281
TP1: $4260
TP2: $4245
TP3: $4230
🔥BUY GOLD zone: 4145 - 4143 SL 4138
TP1: $4160
TP2: $4175
TP3: $4190
⭐️Technical analysis:
Based on technical indicators EMA 34, EMA89 and support resistance areas to set up a reasonable BUY order.
⭐️NOTE:
Note: Nova wishes traders to manage their capital well
- take the number of lots that match your capital
- Takeprofit equal to 4-6% of capital account
- Stoplose equal to 2-3% of capital account

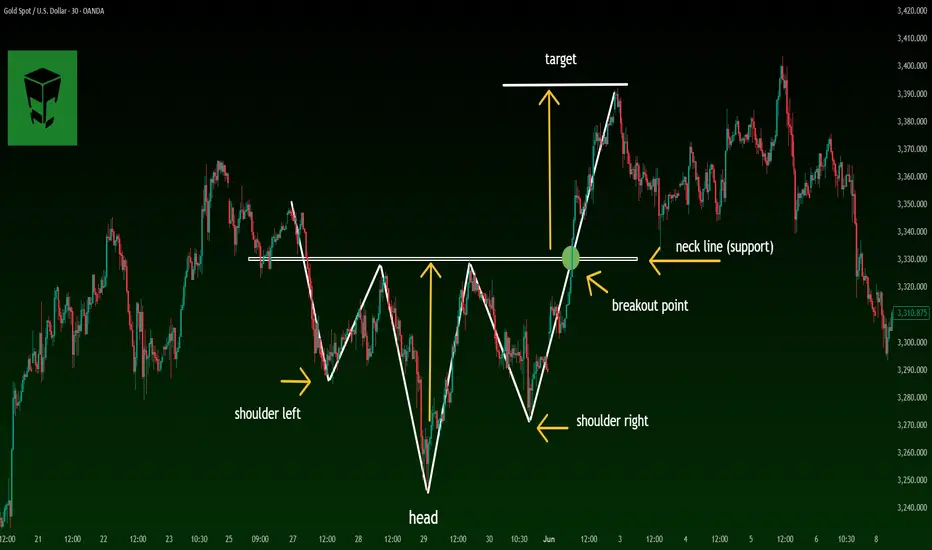
Secrets of the Head & Shoulders Pattern for Profitable trade📘 Complete & Professional Guide to the Head and Shoulders Pattern
The Head and Shoulders pattern is one of the most reliable and powerful reversal formations in technical analysis. It typically appears at the end of an uptrend and signals that the bullish momentum is weakening.
🔹 1. What Is the Head and Shoulders Pattern?
The structure consists of three peaks:
🟦 Left Shoulder
The first peak followed by a minor pullback.
🟪 Head
The highest and central peak of the pattern.
🟩 Right Shoulder
The third peak, usually similar in height to the left shoulder but lower than the head.
🔻 Neckline
A support line drawn through the two pullbacks between the shoulders and the head.
A break below this line is the official trade trigger.
🔹 2. What the Pattern Indicates
This formation shows that the bullish trend is losing momentum and a bearish reversal may be approaching.
Left Shoulder → First sign of weakness
Head → Buyers’ final push to make a new high
Right Shoulder → Failure to create a higher high
Neckline Break → Sellers taking control
Pullback → Best entry for professional traders
🔹 3. How to Properly Identify the Pattern (Professional Criteria)
✔️ 1) A Prior Uptrend
Without a preceding trend, the reversal pattern is invalid.
✔️ 2) Three Distinct Peaks
Left Shoulder < Head
Right Shoulder < Head
Shoulders ideally near the same height
✔️ 3) Volume Behavior
Typical volume flow:
Left Shoulder → high volume
Head → moderate volume
Right Shoulder → declining volume
Neckline Break → strong volume (confirmation)
✔️ 4) Neckline Angle
Descending → stronger signal
Ascending → higher chance of false breakouts
Horizontal → neutral strength
✔️ 5) Valid Neckline Break
A strong candle closing beyond the neckline with solid volume is required.
Wicks or weak candles are not considered a true breakout.
✔️ 6) Pullback (Retest)
About 60% of the time, price retests the neckline.
This is the most professional and safest entry.
🔹 4. How to Trade the Pattern
📉 Sell Signal
Formation of the right shoulder
Neckline break
Enter after a candle closes below the neckline
or
Safer entry: enter after the pullback (retest)
🛑 Stop Loss Placement
Above the right shoulder
or
Above the last minor swing high
🎯 Take-Profit Target
Measure the height of the pattern (Distance from Head to Neckline)
Project downward from the breakout point
🔹 5. Inverse Head and Shoulders Pattern
This is the bullish version of the pattern and forms at market bottoms.
Three troughs instead of peaks
Breakout above the neckline triggers a buy
Same target projection applies
This formation often starts strong uptrends.
🔹 6. Pro Tips Used by Professional Traders
⭐️ The right shoulder is more important than the left
⭐️ A taller head indicates a stronger reversal
⭐️ Volume should decrease on the right shoulder
⭐️ Higher timeframes = higher reliability
⭐️ Best entry is after the pullback
🔹 7. Common Mistakes Traders Make
❌ Entering before the neckline is broken
❌ Confusing random peaks with a structured pattern
❌ Ignoring volume behavior
❌ Setting stop-loss levels too tight
❌ Trading the pattern in a sideways market
🔹 8. Final Summary
The Head and Shoulders pattern is one of the most trustworthy reversal signals.
A professional trader should always:
✔️ Confirm the prior trend
✔️ Identify the three-peak structure
✔️ Check volume behavior
✔️ Wait for a valid neckline break
✔️ Prefer pullback entries
✔️ Set proper SL/TP
✔️ Use higher timeframes for accuracy
With consistent practice on TradingView historical charts, you can master this pattern and use it as a profitable tool in your trading strategy.
$Gold Technical Analysis October 2025 📊 #GOLDUSD Update
🔑 Key Zones
PRZ: $4,371 (Gold stopped nicely at $4,381!)
Local Support Zone: $4,180–$4,050
Holding this range can send Gold soaring again toward:
➡️ $4,500 → $4,750 → $5,200
If these supports are lost, → next downside zones are:
➡️ $3,950 → $3,850 → $3,750
📅 Timeframe & View
Short-term:
Gold trading between $4,180–$4,050 — key range before the next big leg.
Long-term:
ATH projection levels:
💎 $5,300 → $5,700 → $7,300 → $7,700
These correspond with critical years for the global cycle:
2025 (Oct–Nov) performance
2027
2031
2033
Every pullback in this decade-long uptrend remains a buy opportunity.
⚖️ Gold or BTC?
For the short term, my focus shifts to BTC.
But once that phase completes, I’ll move back to Gold for the long wave.
💰 Long-Term Holders
For those holding gold long-term (1 year+):
Any pullback below $3750 remains a strong buy zone for adding.
✅ Quick Recap
📍 PRZ hit: $4,371–$4,381
🛡 Support: $4,180–$4,050
🚀 Upside Targets: $4,500–$4,750–$5,200
⚠️ Downside Risk: $3,950–$3,850–$3,750
🧭 Cycle Years: 2025, 2027, 2031, 2033
💰 Focus: Short-term BTC → Long-term Gold
🧭 Personal Trading Note
I only trade Gold in the real market, and use the demo setup here purely for tracking and study.
⚓ Renzo Tip
“When the tide turns, the wise trader doesn’t fight it — he rides one wave, then waits for the next.”
🤲 Prayer
May Allah bless us with patience in the long waves, wisdom in every entry,
and reward us with clarity in both gold and time.
