Gold: Shorts from 4250 Profit — Beware of Shakeouts TodayOn Monday, gold moved higher within a range. It first surged to 4255 but met resistance and pulled back to find support, then consolidated around 4220 before moving upward again. Later, it was once more pressured downward near 4265. Yesterday, I publicly suggested buying below 4220 and watching the resistance near 4250—selling if the structure turned unfavorable. Today, gold pulled back below 4200. After taking profits perfectly during the drop, we executed a new long entry and captured a small gain.
From a technical perspective, based on the triangle breakout projection, the short-term key support zone defining bullish or bearish strength is 4170–4180. Within this zone, the strategy remains to follow the trend and buy. On a larger scale, gold is trading within the 4380–3890 range, which serves as the trend divider: a breakout above 4380 would restart the bullish trend, while a breakdown below 3890 would confirm a bearish trend.
So far, gold has completed its first test of the 4200 area. The short-term pattern continues to reflect a cycle of pushing higher, pulling back, retesting, and repeated consolidation. This level is likely to see more fluctuations. The key focus is whether the market can reclaim 4236–4245 during the next upward move.
Today’s trading plan:
Sell lightly near 4245 on a rebound; if the price breaks strongly, watch the resistance near 4265.
Buy near 4200 on pullbacks; if support breaks, watch the 4179 zone.
Trade ideas

Will gold follow silver?Silver broke out of an ascending triangle. It's possible that gold is forming its own triangle.

Gold prices surged and then retreated, with the market focusing Gold prices surged and then retreated, with the market focusing on Fed rate cut expectations and ISM data.
Market Recap: In late Asian trading on Monday (December 1st), spot gold prices suddenly declined, currently trading around $4220 per ounce, down more than $36 from the earlier intraday high of $4256.51 per ounce. Earlier in the session, gold prices briefly broke through $4250 per ounce, reaching their highest level in six weeks. At the start of the month, gold buyers continued to dominate amid rising market expectations of a Fed rate cut.
Market Focus: Fed Rate Cut Expectations and Economic Data
According to the CME FedWatch tool, the market currently expects an 87% probability of a 25 basis point rate cut by the Fed at its December monetary policy meeting. At 23:00 Beijing time on Monday, the US will release its November ISM Manufacturing PMI, which is expected to decline slightly to 48.6 from 48.7 in October. A further contraction in manufacturing could further solidify the Fed's plan for a December rate cut, thus suppressing the dollar and boosting gold. This week will see the release of several important data points, including ADP employment data, ISM Services PMI, jobless claims, and the core PCE price index. These will provide crucial guidance for market movements ahead of next week's Federal Reserve interest rate meeting.
Technical Analysis: Retreat from Highs, Focus on Key Support
Intraday Price Analysis: Gold prices rose rapidly from around $4205 in the morning, reaching a high of $4256, but retreated sharply in the afternoon, hitting a low of $4215. Currently, the strength of the support level at $4200 needs to be monitored. If it holds, the upward trend is likely to continue.
Key Levels
Resistance: $4255-$4260 (Intraday high area; a break above this level would open up further upside potential)
Support:
First Support: $4215 (Initial hourly support)
Key Support: $4173-$4180 (Daily chart strength/weakness dividing line; a break below this level could lead to consolidation)
Trading Strategy
Overall, gold maintains a strong daily chart pattern, but short-term risks of a pullback from these highs should be considered. The recommended strategy is to primarily buy on dips, with selling on rallies as a secondary approach. The key focus should be whether gold can hold above $4215 and stabilize in the afternoon.
Trading Strategy Reference
Short Position Strategy
Entry Area: Initiate short positions in batches around $4255-$4260.
Stop Loss: $8
Target Range: $4230-$4215, break below to $4200.
Long Position Strategy
Entry Area: Initiate long positions in batches around $4200-$4205.
Stop Loss: $8
Target Range: $4230-$4240, break above to $4260.
Risk Warning: Increased market volatility necessitates strict control of position size and stop-loss orders to avoid holding losing positions. Specific entry points should be adjusted flexibly based on real-time market movements.
Outlook
Gold has experienced a technical pullback after reaching a six-week high, but it remains supported by expectations of a Fed rate cut. The focus today is on the US ISM data; weak data could catalyze a new round of buying. Investors should closely monitor the battle between bulls and bears around the $4200 level and trade accordingly.

XAUUSD Bullish Continuation With Structure Support – Intraday ViGold continues to respect its rising structure after building higher lows. The recent pullback was absorbed inside the marked support region, and price is now pushing back toward the upper range.
The structure suggests strength as long as price holds above the lower support band.
Key Technical Areas:
Support / Hold Zone: 4,186 – 4,220 region
Reaction Area: 4,235 – 4,245
Resistance / Upper Range: 4,280 – 4,295
Technical Outlook:
As long as price remains above the support zone, bullish continuation remains possible toward the upper range. A clear hold above recent highs may open further upside potential, while a breakdown below support would invalidate the structure.
This is a technical analysis idea for educational and charting purposes only.
If you want, I can also give you:
✅ A shorter version
✅ A caption for social media
✅ A more professional/advanced version
✅ A matching hashtag set

XAUUSD Bullish Explosion! Target4285 🔥 Smart Money Concept Explanation
Market is currently maintaining bullish order flow with consistent HH–HL structure, showing strong demand from institutional footprints.
Price has tapped into an Internal Demand Mitigation (IDM) area and is reacting bullishly after engineering liquidity below intraday lows.
The previous Break of Structure (BOS) confirms the continuation of bullish displacement.
Now price is expected to reach the upper Buy-Side Liquidity (BSL) zones.
---
🎯 Targets (TP divided into 3 parts)
1️⃣ TP1 → 4260
• First buy-side liquidity pocket
• Ideal partial close point
2️⃣ TP2 → 4272
• Situated at the next imbalance fill zone
• Captures mid-range liquidity
3️⃣ TP3 → 4285 (Final Target)
• Major external buy-side liquidity
• Completion of overall bullish expansion
---
📌 Market Psychology / Why This Buy is Strong
Liquidity swept below 4245 area
Price tapped into imbalance + demand confluence
Institutional mitigation confirming bullish continuation
Strong bullish displacement candles
Clear buy-side liquidity sitting above 4260 → 4285
---
⚠ Risk Management
Always maintain SL at 4240, just below liquidity sweep zone.
Use partial profit-taking on each TP to protect capital.
---
#XAUUSD #Gold #Forex #SmartMoneyConcept #SMC #BuySetup #LiquidityZones #OrderFlow #BOS #IDM #TechnicalAnalysis #Trading #ForexSignals #IntradayTrading #Scalping #SwingTrading #MarketStructure #PriceAction


Opportunity Showed Up on GOLDAfter an arguably top-down analysis, finally Gold revealed its hands and gave us and entry opportunity. A good question, will it hit Take Profit? Let's wait and see.

XAU/USD Bullish Continuation Setup Toward 4,223 After Liquidity 1. Market Structure
The chart highlights a COCH (Change of Character) followed by a BOS (Break of Structure), signaling a shift from bearish to bullish structure.
Several smaller coch points confirm internal bullish structure building.
2. Liquidity & POI Zones
There is a clear liquidity sweep near the PDL (Previous Day Low), where price dipped into a demand zone to collect orders.
An Extreme POI (Point of Interest) sits below current price — this acted as the strong reaction zone for the bullish move.
PDH (Previous Day High) is marked as an early short-term target/liquidity area.
3. Expected Move
The projection (zig-zag line) indicates bullish continuation after a pullback into the POI zone.
The target is marked around 4,223.629, matching the red horizontal resistance line.
The EMA (9) serves as dynamic support, showing price respecting the bullish trend.
4. Probability Outlook
As long as price stays above the trendline and POI, the bias remains bullish.
A break below the POI would invalidate the setup and open the lower liquidity region again.


XAUUSD: Will It Continue to Decline? We have been receiving long profit signals for a consecutive week, and I believe all of you have already gotten them. The market has once again validated my view by breaking through the 4200 level, allowing us to reap substantial profits.
Next week, gold is expected to enter a correction phase and may decline to test the support level around 4160-4180. If you still have short orders in your account, this will be your final chance to close them.
I will send out accurate trading signals as soon as the market opens next week—don’t miss out.

The 3 Trades That Got Me $100k Funded AccountWhen I trade XAUUSD, I only look for buying opportunities since the overall trend is bullish and there's a large list of fundamental support factors.
All of my trades always start off with a 1:1 risk to reward and then I trail based on the daily structure. Once a daily candle loses below the last, I exit the trade. Once the trade is in profit by 300 points on the smaller timeframes I move my stop loss to breakeven.
The first trade I want for a breakout above resistance. I was going to enter right on the breakout but I thought there was a chance of a fakeout so I waited until we had a small red doji candle. Stop loss was placed below that doji. I then held the trade until the daily candle closed below the last.
The second trade, I waited for a retest of the 10 SMA. The second trade felt risky but I only risk 1% per trade. Once price action started closing higher on the daily timeframe, I simply held it until we had that large bearish engulfing candle at the top.
The third trade was a no brainer, price closed above the 10SMA. My stop was below the daily candle's low and I targeted the 4200 psychological handle.

Gold Thoughts, Ideas and Trading Plan WC 01/12Daily:
The past week the Gold rise about 3.75%, started from a rejection at EMA 24 on Monday and close with a wide spread "bold" candle just about the previous high. Now, what shall we expect to happen from here? I can't rely on Tick Volume as is all distorted because of the Holiday's, so be purely judging PA, we either get a rejection here of some form or a continuation. Waiting for confirmation is critical now, although if we zoom out on the weekly TF, we have this wide spread up candle which signal pure bullish momentum and so we might follow that as a bias. Waiting for confirmation at this point is critical. And the cues will be hiding in the faster TF's.
4H
Now, watching at this TF, we can see that the price broke the bullish channel initiated the 18th of November. Which also signals stronger bullish momentum. The Moving Average also start getting a bit of distance between the different lengths, another positive sign of continuation. Last barrier left is to close above 4244.94. In that case we can expect a push all the way to the ATH, otherwise if it fails to cross this level again, then we shall see the gold dropping from here and the first target is the last demand zone at about 3920.
1H
Zooming closer at 1H it's visible how strong was the up move on Friday dominating the last 8 hours of the trading week. Of course after something like this we shall see some form of pullback/correction, but one must be careful not to jump to fast to conclusions, if a reversal is to happen from this point I would expect to see multiple rejection before actually the price changes direction. On the other hand in case of a breakout there might not be a re-test but a straight move up, very typical for what Gold has been doing in the past up moves, so I would be ready to jump (even on higher risk) at the first breakout signal.
The Plan
Long Breakout 4244.94 Target 4379
Short Rejection/Pullback if the price rose to 4379 small target not further than the last Low.
Short Rejection at the current resistance level Target 1 4109.55
Disclaimer: This are notes of what I do for my self every week, but usually I just save them as Private notes so I can keep track on my weekly plan. I decided to start publicly sharing them in the hope that they can be somehow helpful to anyone, and maybe learn something from you in the comments.
About me: I trade Support and Resistance both breakouts and rejections, usually my entries are after Hammers and Shooting stars on above average volume. I use VPA (Volume Prize Analysis) for all my analysis and entries. I do not post my Tick Volume indicator as I use different platform for it.
My Win%:
All time 45.05%
2025 45.51%
Q3 51.39%
Good Luck in your trading.
Thank you

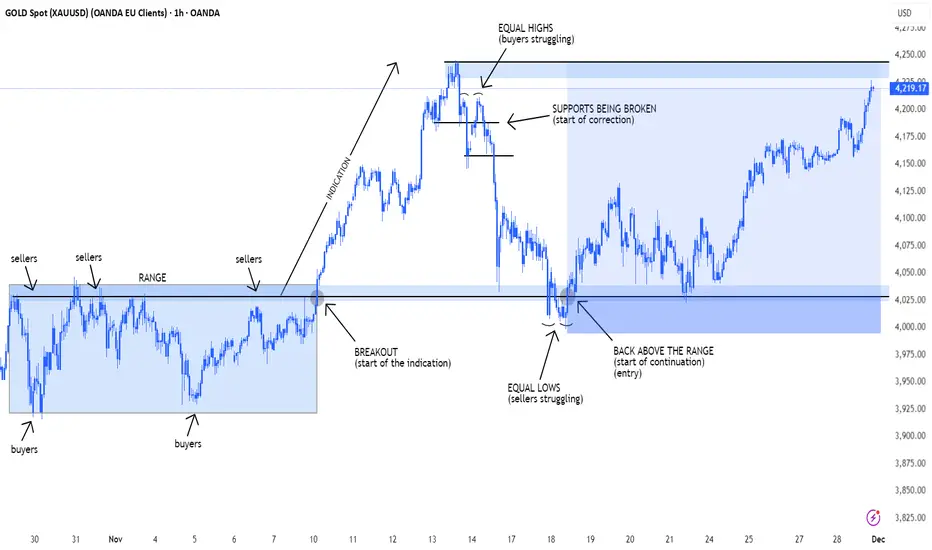
XAUUSD ICC LONG setupJust a simple breakdown of the recent price action on Gold.
1) INDICATION Price created a range where sellers struggled to keep price down, buyers pushed upwards and created a new high.
2) CORRECTION Price corrected, breaking supports, creating LL's and LH's.
3) CONTINUATION Price broke back above the level, on New York session, on Tuesday buyers stepped in again, our entry.
GoldTrading Strategy | November 28-29✅ 4-Hour Chart (H4) Trend Analysis
1️⃣ Overall Structure: Bulls in Control, Price Breaks Key Resistance
Price has broken above and stabilized above the key resistance at 4156 (yellow line), forming consecutive bullish candles with strong volume, indicating clear bullish strength.
The latest bullish candle has a strong body and closed near its high, showing that upward momentum is still continuing.
2️⃣ Moving Averages: Bullish Alignment
MA5, MA10, and MA20 are in a classic bullish formation, and price is consistently advancing along MA5 and MA10.
MA20 is turning upward, which is a key signal of trend reversal.
➡️ This indicates that the medium-term trend has strengthened, with bulls dominating the market.
3️⃣ Bollinger Bands: Upper Band Opening, Trend Strengthening
Price is riding along the upper Bollinger Band — a typical sign of a strong bullish trend.
The upper band is expanding upward, indicating rising volatility and expanding upside potential.
✅ 1-Hour Chart (H1) Trend Analysis
1️⃣ Trend Structure: Strong Rally, Short-Term Pullback Expected
H1 recently surged to 4226.89 and then pulled back slightly, showing a normal correction after a strong rally.
Price remains above MA5 and MA10, indicating a strong pullback rather than a trend reversal.
2️⃣ Moving Averages: Short-Term Still Bullish
MA5 and MA10 remain in a bullish formation.
MA20 is starting to provide support, making it the key level for short-term pullbacks.
➡️ Short-term bias remains bullish, but a technical correction may occur at any time.
3️⃣ Bollinger Bands: Upper Band Pressure
The H1 upper Bollinger Band is around 4222, and price saw reduced volume after touching it, suggesting short-term profit-taking.
🔴 Resistance Levels: 4226 / 4230
🟢 Support Levels: 4195 / 4182
✅ Trading Strategy Reference
1️⃣ Buy on Pullback (Main Strategy)
Buy in the 4182–4195 range
🎯 Targets: 4218 / 4230
⛔ Stop Loss: 4170
Reason:
H4 has clearly broken above 4156, confirming a medium-term bullish trend. A pullback is a buying opportunity.
2️⃣ Short at High Levels (Secondary Strategy, Light Positions)
Short near 4226–4230 if price shows rejection
🎯 Targets: 4205 / 4195
⛔ Stop Loss: Above 4238
Reason:
H1 faces pressure at the upper Bollinger Band, showing short-term exhaustion and potential for a pullback.

Gold Trade Set Up Nov 28 2025Price created a new HH on the 1h in Asia session then reversed in London to test 1h demand and bounced off it. Overall i am still bullish. internally price swept low range liquidity so i will want to see 5m-15m engulfing candle to continue higher to BSL

XAUUSD Outlook🟦 Market Structure (H4 & D1)
Price continues to respect the ascending structure after a clean CHoCH → BoS → Breakout Retest on H4, indicating that bullish momentum remains intact.
On D1, the market appears to be completing an ABC corrective formation, with wave (3) established and wave (5) potentially extending towards 4,320 – 4,380.
🟦 Liquidity & Key Zones
H4 is approaching a liquidity pocket at 4,155–4,165, which is likely to trigger a short-term pullback before any continuation higher.
On D1, price is moving into a mild imbalance / residual supply region, yet there is no firm rejection so far – suggesting that the broader bullish trend remains favoured.
🟦 Expected Scenario
The higher-probability scenario: a brief retracement into the liquidity zone, followed by absorption and the formation of a higher low → continuation towards 4,245, and potentially 4,380 as wave (5) develops.
Only a decisive break beneath 4,110 would weaken the current bullish structure and invalidate this outlook.

XAUUSD -SETUP Price has broken out of the descending structure with strong bullish momentum. I’ll be watching for a corrective pullback into the two dotted support zones marked on the chart.
If price retests these areas and confirms support, I’ll look for a buy opportunity targeting the higher liquidity levels.
Bias remains bullish as long as structure and support hold.

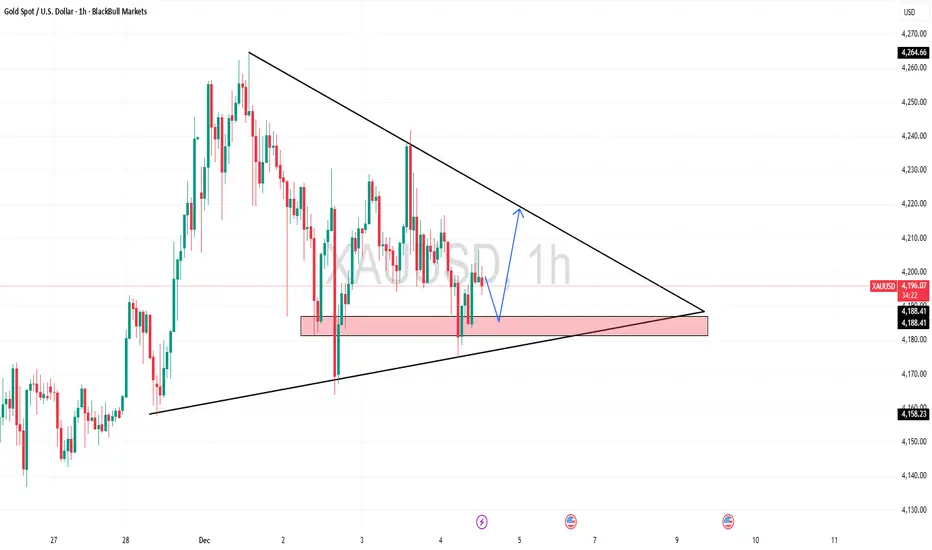
Gold uptrend wedge Hello guys, it looks like gold has formed a wedge on the 4hr chart. Let’s see where this trend goes.

XAUUSD – Gold scenario awaiting trend confirmation at the 4...XAUUSD – Gold scenario awaiting trend confirmation at the 4,160–4,170 zone
Currently, gold has not shown a clear enough medium-term trend. The price is fluctuating around an important resistance zone, so instead of predicting the market, I wait for price reactions at key zones before making a decision.
Today's main axis is the 4,160–4,170 zone – where the market will choose to continue the upward trend or start a deeper correction.
🎯 Scenario 1 – SELL AT RESISTANCE 4,162–4,165 (PREFERRED IF NO CLEAR BREAKOUT)
Sell: 4,162 – 4,165
SL: 4,173
TP: 4,140 – 4,122 – 4,110 – 4,100
The 4,162–4,165 zone on H1 is resistance coinciding with fibo + supply zone near the old peak, also close to the short-term uptrend line.
If the price hits this zone and shows signs of weakening (upper shadow, reversal candle, unsupported volume), I prefer to sell short down to the 4,140 zone, deeper possibly to the liquidity cluster around 4,110–4,100 as shown on the chart.
The risk for this scenario is limited to 1–2% of the account, absolutely no holding the order if the price closes above 4,173.
⭐️ Scenario 2 – BUY WHEN PRICE BREAKS THE PEAK, CONFIRMING CONTINUATION OF THE UPWARD TREND
Buy: 4,171 – 4,173 (after clearly breaking the old peak)
SL: 4,163
TP: 4,188 – 4,200 – 4,215
In case the price decisively breaks the 4,170 zone and holds above it, this is a signal confirming the buyers continue to control. At that time, I switch bias to buy according to the breakout, targeting the higher resistance zone around 4,200–4,215, further expansion possible if the upward momentum is maintained.
Note: only Buy when the breakout is real – large body candle, closing above the 4,170 zone, not a stop sweep then sharply pulling back down.
1. Basic context
The DXY index is slipping below the 99.50 mark, currently around 99.45, indicating continued downward pressure as the market increases expectations for the Fed to cut interest rates in December.
General monetary easing expectations support gold, as the opportunity cost of holding gold decreases.
However, initial US jobless claims have fallen to the lowest level since April, indicating the labor market is still quite strong. This may cause investors to struggle between expectations of rate cuts and the actual strength of the US economy, creating "jerky" fluctuations around news release times.
In summary, the fundamentals are slightly leaning towards supporting gold, but not enough to completely ignore technical adjustments.
2. Technical analysis & price structure
On the H1 frame, after the recent strong increase, gold is creating an accumulation zone just below the 4,160–4,170 resistance.
The 4,162–4,165 zone is a confluence area: horizontal resistance + old supply zone + price zone where strong selling pressure previously appeared.
The 4,140 zone is the "confirmation of adjustment decrease" threshold – if breached and the price closes below here, the market is likely to want to return to the large liquidity cluster around 4,110–4,100, where many Buy stop losses are waiting.
Therefore, the current structure allows for two-way trading, but each scenario requires clear confirmation from price behavior at the 4,160–4,170 zone before entering an order.
3. Market sentiment & action plan
Both buyers and sellers are looking at the same price zone – 4,160–4,170. This makes this area likely to become a thick liquidity zone, where stops from both sides can be "swept" before the market chooses the real direction.
If the price drops sharply from this zone, it is likely a sell-off phase of late Buy orders near the peak.
Conversely, if buyers are strong enough to keep the price above 4,170, many Sell orders will be trapped, creating momentum for a short squeeze to higher resistance zones.
My plan:
Do not enter orders in the middle of the zone, only wait:
Sell at 4,162–4,165 if clear reversal signals appear.
Buy at 4,171–4,173 after the price breaks the peak and holds above this zone.
Always set a hard SL, do not widen the stop when the order goes against.
If the price strongly breaks both scenario zones without giving clear signals, I accept to stay out, wait for a new structure, do not try to "guess the direction".
I always read feedback to optimize sharing in future posts.

Gold price tries to return to 4194⭐️GOLDEN INFORMATION:
Gold (XAU/USD) edges lower in Thursday’s Asian session, slipping from Wednesday’s near two-week high, though losses remain limited. Expectations of lower US rates and optimism over a potential Russia-Ukraine peace deal are supporting broader risk sentiment, diverting some flows away from safe-haven gold amid light Thanksgiving-thinned trading
⭐️Personal comments NOVA:
maintain uptrend above 4100, continue to accumulate and try to return to 4194. Market is optimistic about December interest rate
⭐️SET UP GOLD PRICE:
🔥SELL GOLD zone: 4193 - 4195 SL 4200
TP1: $4180
TP2: $4170
TP3: $4150
🔥BUY GOLD zone: 4063 - 4061 SL 4056
TP1: $4078
TP2: $4090
TP3: $4108
⭐️Technical analysis:
Based on technical indicators EMA 34, EMA89 and support resistance areas to set up a reasonable BUY order.
⭐️NOTE:
Note: Nova wishes traders to manage their capital well
- take the number of lots that match your capital
- Takeprofit equal to 4-6% of capital account
- Stoplose equal to 2-3% of capital account

Unemployment claims trade ideaOnly looking for buys on gold because the feds will start cutting rates soon. I'm looking for buys above my pink line only if we get stronger U.S unemployment claims. I like this it follows the bigger picture of the feds cutting rates soon and because of the geopolitical tensions in South America

GOLD Buying Trade idea From the Support LevelHello Traders
In This Chart GOLD HOURLY Forex Forecast By FOREX PLANET
today Gold analysis 👆
🟢This Chart includes_ (GOLD market update)
🟢What is The Next Opportunity on GOLD Market
🟢how to Enter to the Valid Entry With Assurance Profit
This CHART is For Trader's that Want to Improve Their Technical Analysis Skills and Their Trading By Understanding How To Analyze The Market Using Multiple Timeframes and Understanding The Bigger Picture on the Charts
Gold Price Setup: Buyers Defending Key Support Zone!Technical Analysis (Gold – 30M Chart)
Price has recently respected the 4,175 support zone, showing multiple bullish rejections, suggesting buyers are defending this level. Gold is now trading just below the 50-EMA, and a sustained break above it would strengthen bullish momentum.
If price holds above the support and continues to build higher lows, the next immediate resistance lies at the 1st target zone near 4,216. A breakout above this level could open the path toward the 4,240 target zone, where stronger selling pressure may appear.
Overall, bias is short-term bullish as long as 4,175 support holds, with upside potential toward 4,216 and then 4,240.
