Gold 3,600 – New Peak or a Reversal?Hello everyone, after a strong rally, Gold has now approached the solid resistance zone at 3,600. Price action shows signs of weakening buying momentum: each push is getting shorter, upper wicks are longer, and price has been repeatedly rejected around the 3,600 mark. This indicates that buyers are gradually losing strength, opening up the possibility of forming a Lower High and making way for a short-term technical correction.
On the short-term structure, the ascending trendline has been slightly broken, while price is “hanging” just below resistance without a clear breakout. If the market fails to hold above 3,600, the probability of a corrective decline will increase.
Key levels to watch: the first support lies at 3,546 (TP1). If this level breaks, gold may continue down to 3,528 (TP2), where liquidity is concentrated.
👉 What do you think? Will gold continue to rise, or is a reversal coming?
GOLD.F trade ideas

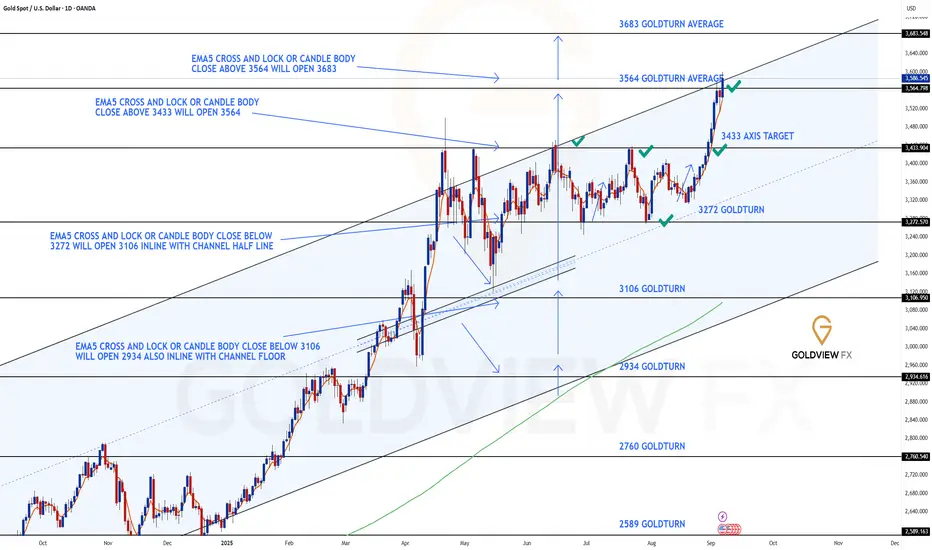
GOLD DAILY CHART ROUTE MAPDaily Chart Update
Range Break, Gap Confirmation & Next Target Achieved
As anticipated in our previous update, price finally pushed through for a test of 3433, confirming the strength of the upside momentum we discussed. This test produced a candle body close gap open for 3564, which has now been successfully achieved just as projected.
The close above 3564 further unlocks 3683 as the next long-term upside target. An EMA5 lock will serve as added confirmation for continuation toward this zone. Meanwhile, both 3564 and 3433 now transition into key support levels for this chart idea.
Current Outlook
🔹 3564 Target Reached
Our gap target has now been completed with a decisive candle body close above. This confirms bullish continuation and shifts focus to the next zone.
🔹 Next Objective – 3683
The successful 3564 break opens a fresh long-term target at 3683. EMA5 lock confirmation will strengthen the case for this move.
Updated Key Levels
📉 Support – 3272 (pivotal floor)
📉 Short Term Supports – 3433 & 3564
📈 Resistance / Next Upside Objective – 3683
Thanks as always for your continued support,
Mr Gold
GoldViewFX
Gold Shines Amid USD Pressure?Gold is maintaining its bullish momentum as the market finds little additional support for the USD from the latest data. Average hourly earnings rose 0.3%, exactly in line with forecasts, creating no surprises.
Nonfarm Payrolls came in at 75k, slightly higher than the previous 73k but still matching expectations, suggesting the U.S. labor market is not particularly strong. More importantly, the unemployment rate climbed from 4.2% to 4.3%, a negative signal for the USD as it increases the likelihood of a more dovish Fed, thereby supporting gold prices.
On the H1 chart, gold is trading around $3,550, with key support at $3,500 (aligned with the EMA34 and EMA89). The nearest resistance stands at $3,590, which is also the next upside target if the current trend holds. Overall, as long as gold remains above $3,500, the scenario of testing $3,590 in the coming sessions remains the primary outlook.

DeGRAM | GOLD above the channel📊 Technical Analysis
● XAU/USD is climbing within an ascending channel, holding above 3,600 support after reclaiming the mid-range trendline.
● Price momentum is targeting the 3,620 resistance; a breakout could extend gains toward 3,640, keeping the short-term structure bullish.
💡 Fundamental Analysis
● Gold is buoyed by softer US inflation expectations and a slight pullback in Treasury yields, while investor demand for safe havens remains firm amid geopolitical concerns.
✨ Summary
Bullish above 3,600; targets 3,620 → 3,640. Invalidation on a close below 3,580.
-------------------
Share your opinion in the comments and support the idea with a like. Thanks for your support!

Gold All Time High and want to Hitting Resistance PointsGold prices are trading near all-time highs as investors continue to rush into safe-haven assets. While the uptrend remains strong, the risk of profit-taking is increasing, which could trigger short-term pullbacks. Nonetheless, the metal is likely to remain close to record levels, supported by underlying demand.
The rally reflects market expectations of a more dovish U.S. Federal Reserve, a weaker U.S. dollar, and robust central bank purchases year-to-date. These factors provide a solid fundamental backdrop for gold despite elevated prices.
Technical Outlook
Immediate key level: 3558 –
If price breaks above 3558, the next resistance is seen near 3620.
Support levels to watch remain at recent breakout areas, which may act as buffers if profit-taking emerges.
You may find more details in the chart,
Trade wisely best of Luck,
Ps; Support with like and comments for better analysis.

Gold Roadmap | Short termGold ( OANDA:XAUUSD ) created a new All-Time High(ATH) almost every day this week.
How long do you think this upward trend in Gold will continue?
Reasons for Gold's upward trend this week:
Announcement of the US economic indexes.
Geopolitical issues that occurred in the world(China meeting, possible tension between Venezuela and the US, etc.)
Gold is currently moving between the Potential Reversal Zone(PRZ) and the Support zone($3,580-$3,572) .
In terms of Elliott Wave theory , Gold appears to be completing microwave 5 of the main wave 3 .
I expect Gold to start rising again from the Fibonacci levels and touch the Potential Reversal Zone(PRZ) .
Note: If Gold breaks the Support zone($3,580-$3,572) and Support lines, we can expect further declines.
Gold Analyze (XAUUSD), 15-minute time frame.
Be sure to follow the updated ideas.
Do not forget to put a Stop loss for your positions (For every position you want to open).
Please follow your strategy; this is just my idea, and I will gladly see your ideas in this post.
Please do not forget the ✅ ' like ' ✅ button 🙏😊 & Share it with your friends; thanks, and Trade safe.

Lingrid | GOLD Employment Data Play - Long OpportunityOANDA:XAUUSD is climbing inside an upward channel, bouncing steadily from support and pushing through recent resistance with bullish momentum. The structure shows higher highs and higher lows, confirming the trend continuation bias. A clean hold above 3,500 keeps the path open for another push higher. Momentum favors retesting the resistance zone, where a breakout could unlock more upside potential.
📉 Key Levels
Buy trigger: Break above 3,505
Buy zone: 3,500–3,520 support retest
Target: 3,600–3,615 zone
Invalidation: Break below 3,460 support
💡 Risks
Stronger-than-expected NFP data today could fuel USD strength and pressure gold lower.
Failure to hold the 3,505 support may shift momentum to the downside.
Geopolitical or macro shifts driving risk-on sentiment could reduce safe-haven demand for gold.
If this idea resonates with you or you have your own opinion, traders, hit the comments. I’m excited to read your thoughts!

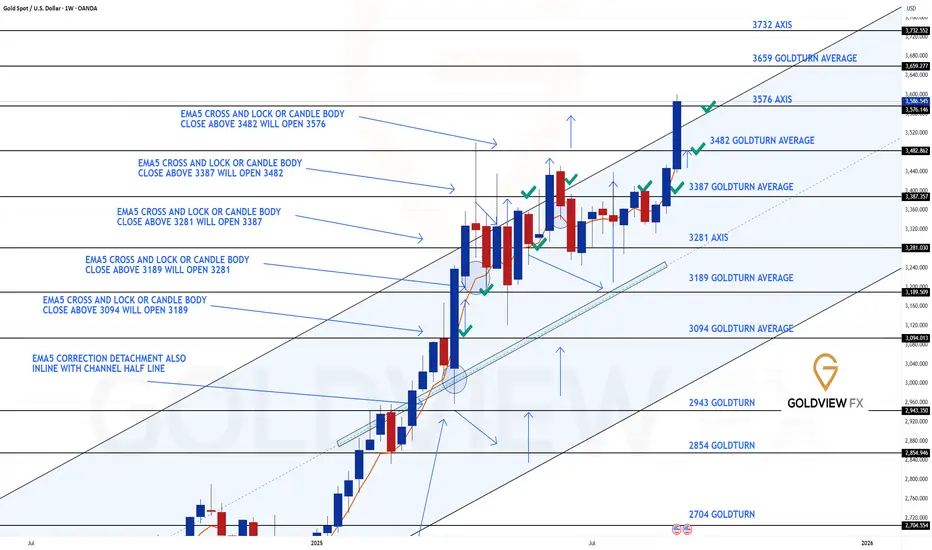
GOLD WEEKLY CHART MID/LONG TERM ROUTE MAPWeekly Chart Update
As anticipated, we got the 3482 gap target hit just as projected. Momentum carried further into the final channel top target at 3576, completing the upper channel move.
Current Outlook
🔹 Gap Targets Achieved
Both 3482 and 3576 have now been met. Price action delivered cleanly into these objectives, validating the prior bullish structure.
🔹 Candle Body Close Above 3576
The weekly body close above the channel top at 3576 has now opened the door to the larger 3659 long-term gap target. EMA5 would provide further confirmation if momentum sustains.
🔹 Channel Top Now Key Test
We need to see 3576 - 3482 (channel top) hold as support to confirm the new range zone play. If it holds, the 3659 - 3732 range becomes the next bullish zone. Failure to provide support above 3482 - 3576 will mean the breakout is short-lived, with risk of a swift correction back down.
🔹 Range Support Levels
3576 and 3482 now act as layered support levels to keep the bullish case intact within this range.
Updated Levels to Watch
📉 Support – 3482 & 3576
Key supports for this new range. Holding above 3576 strengthens the case for continuation toward 3659. A failure back below 3576 puts 3482 into play as the next defensive level.
📈 Resistance – 3659
The newly opened long-term gap target. This becomes the next upside objective if structure holds above 3576.
Plan
With 3482 and 3576 achieved, focus shifts to the 3659 gap. The bullish continuation depends on 3576 holding as support. If buyers defend it, the range extends upward into new territory. If not, expect a sharp corrective move back into the prior range.
Thanks as always for your support,
Mr Gold
GoldViewFX
GOLD WEEKLY CHART ROUTE MAP UPDATEHey Everyone,
After completing our 1h, 4h and daily chart ideas this week, please now see update on our weekly chart idea, which we also smashed into pips!!!
As anticipated -
This time, bulls followed through in full force:
✅ We got our Target Hit at 3482 after confirming the gap from the body close above 3387.
✅ To finish the week on a high, we also completed our long-range axis target at 3576, which has been highlighted on the chart since the beginning of our tracking on this chart idea.
🔹 3482 Gap Target Achieved
The upside gap has now been fully confirmed and met.
🔹 Axis Target 3576 Completed
The higher-timeframe target we’ve tracked since the start has been fulfilled, marking a strong close to the week.
With both the 3482 gap and 3576 axis target achieved, the bullish roadmap we’ve tracked has now played out to completion. Near-term, we’ll watch how price reacts around 3576. A strong close above could open fresh upside extensions, while failure here may trigger a healthy pullback toward 3387 for retest.
We will now come back Sunday with a full multi timeframe analysis to prepare for next week’s setups, including updated views on the higher timeframes, EMA5 alignments, and structure expectations going forward.
Thanks again for all your likes, comments, and follows.
Wishing you all a fantastic weekend!!
Mr Gold
GoldViewFX

Gold is ready to make new record XAUUSD is holding above support and pushing higher, targeting the new high zone around 3530 if momentum sustains.

Gold: Eyeing a Break Above 3,600Hello everyone, gold is approaching a critical juncture where both fundamentals and technicals appear aligned in favour of further upside.
Weak US labour data combined with growing expectations of a Fed rate cut in September have weighed on yields and the dollar, creating a supportive backdrop for gold. The next key catalysts lie in US inflation prints (CPI/PPI). As long as easing expectations dominate, the metal enjoys a clear tailwind.
From a technical perspective, the bullish structure remains intact: price is holding firmly above the Ichimoku cloud with solid demand layers at 3,565–3,555 and 3,545–3,535. The 3,595–3,600 zone is the immediate psychological barrier, yet selling pressure looks insufficient to derail the trend.
My view: gold is likely to push through 3,600 soon, extending towards 3,615–3,630, with potential to reach 3,650 if momentum holds.
Do you think gold will clear 3,600 decisively this week? Share your thoughts below.

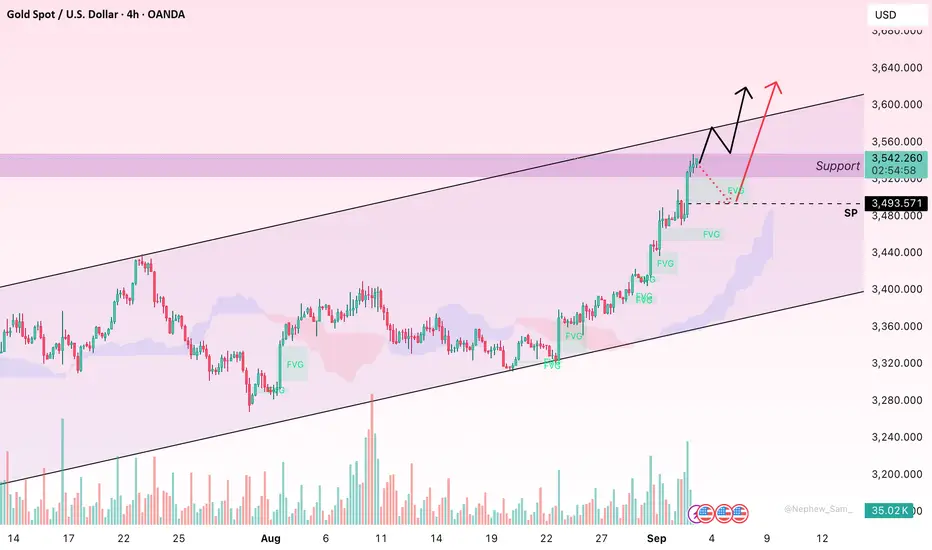
Gold Breaks New Highs, Momentum Still Favouring BullsHello friends, the past week has been quite rewarding for gold as it surged through major resistance levels and printed fresh highs. On the H4 chart, the trend looks very clear: price action is holding firmly above the Ichimoku cloud, with Tenkan sitting comfortably above Kijun, and the cloud slope widening further. Multiple Fair Value Gaps (FVGs) remain unfilled below, showing that buying momentum is powerful and liquidity is being left behind — a signature of a strong rally, not just a short-term move.
In terms of price action, the immediate resistance lies between $3,535–3,560. A clean H4 close above this area may unlock the next natural expansion towards $3,580–3,600. On the downside, layered supports are found at $3,520–3,505, then $3,485–3,470, and deeper at $3,440–3,420, coinciding with the upper edge of the cloud, often tested during medium-term uptrends.
Fundamentally, the environment still favours buyers: safe-haven demand is rising, the Fed is expected to ease policy sooner, and the USD is weakening, all adding fuel to the bullish case. Unless gold closes back into the cloud and loses the $3,440–3,420 zone, the probability of trend continuation remains high.
Do you think gold can stretch further from here? Share your thoughts below!
XAUUSD: Consolidating the bullish momentumHi everyone, it’s Ken!
At this moment, gold is shining with strong appeal. The market is moving within a steep channel, and price action continues to respect its structure, forming higher highs without showing weakness.
Not long ago, gold broke a key resistance level and might come back to retest it. Interestingly, this area also aligns with the “golden zone” from the last breakout. If buyers defend it well, the bullish outlook remains valid, with the next target aiming toward 3,660 – the channel’s peak.
As long as price stays above the support and the rising trendline, the uptrend remains intact. However, if it slips below, chances of a deeper pullback will rise.
Stay patient, wait for confirmation before entering, and always protect your capital with proper risk management.
Wishing you success!

Best Trend-Following Price Model For Gold XAUUSD Trading
In this article, I will show you a powerful chart setup for profitable trend following trading Gold. I will break down how it works with examples.
Here is how this price model looks:
It is based on 5 important conditions that should be strictly met.
1 - Gold should trade in a global bullish trend.
The price should consistently update Higher Highs HH and Higher Lows HL.
2 - Higher Lows should respect a rising trend line, acting as a support.
It should be respected by at least 3 consequent bullish movements from that.
3 - After a formation of a high above a trend line, the price should start a correctional movement in a minor trend in a bullish flag pattern.
It can be a horizontal, parallel or expanding channel.
4 - Correcting, Gold should test a major rising trend line, being within a flag.
5 - A bullish movement should initiate after a trend line test and the price should break and close above a resistance line of a flag.
When all these 5 conditions are met, we can expect a bullish movement on Gold at least to a level of a current high from where a correction started.
A broken resistance line of a flag and a major rising trend line will compose a safe zone to buy Gold from.
The best time frame for this model will be a daily.
Let's study a real example of such a price model on Gold chart on a daily.
Examine a price chart of Gold on a daily time frame above.
All 5 conditions are met, and we can anticipate a rise to the underlined red resistance.
Our buy zone will be based on a broken resistance of the flag and a major rising trend line.
You can see that our goal was successfully reached.
Here is the proof -
This price model will help you to predict strong bullish waves , trading Gold. A simple combination of a trend analysis and a price action are the 2 basic components that you need to study to identify that properly.
❤️Please, support my work with like, thank you!❤️
I am part of Trade Nation's Influencer program and receive a monthly fee for using their TradingView charts in my analysis.

GOLD - false breakout of 3500 and correction to 3400 Ahead lies strong resistance and a psychologically important price level: 3500. The closer the price gets to this zone, the more the market will manipulate before large players take profits, which may begin after a false breakout...
In addition, the 3435-3410 zone is also of interest to MM, since after the breakout of global consolidation resistance and the formation of a rally, there has been no correction yet.
Scenario: The breakout of resistance may be deep, and within the upward movement, the market may test 3510-3525 before the spark fades. A return below 3500 will confirm the false breakout, which will trigger profit-taking and a reversal in traders' actions. There may be a correction to the specified levels.

Hellena | GOLD (4H): SHORT to support area of 3558.Colleagues, gold is in an active upward impulse of big wave “1” and if until now I was only talking about long positions, now it is time to think about the correction in wave “2”.
Wave “1” (red) consists of five waves and, to all appearances, wave “5” (blue) has either completed or is about to complete.
This means that I expect a corrective movement to the 3558 support area. I believe that this is the minimum retracement level, and the price may reach lower values, but we will work for the result, which we will achieve soon.
Manage your capital correctly and competently! Only enter trades based on reliable patterns!

Gold – Breaking Out or Faking Out to Start September?Gold has been trading in a 3250-3450 range since the middle of May, but events last week saw prices test and close right at the top of that range on Friday. The drivers impacting this push higher in Gold, which could remain in play for traders in the first week of September, were numerous. These included President Trump’s on-going challenge of Federal Reserve independence with the attempted firing of Governor Cook, Russia demanding more to achieve progress towards a ceasefire to the war in Ukraine, as well as stubborn US inflation (PCE Index last Friday) and resilient economic data at a time when the Federal Reserve are expected to cut interest rates at their next meeting on September 17th.
Early trading on Monday has now seen price strength extend, leading to a range breakout (more on this in technical update below) as traders react to news released late on Friday that a US appeals court ruled President Trump's reciprocal tariffs illegal. While the ruling, released after the markets closed, left the tariffs in place ahead of a final showdown at the US Supreme Court, the uncertainty this potentially provides regarding President Trump’s approach to foreign policy has seen Gold prices touch a 4 month high of 3490 (at time of writing 0800 BST).
Looking forward, this week is stacked full of risk events that could lead to an increase in Gold price volatility, including important US economic data, with the ISM Manufacturing (Tuesday) and Services (Thursday) PMI survey readings and then the all-important Non-farm payrolls release on Friday. All of which could impact the expectations of traders for a Fed rate cut later in the month.
It could be a busy start to September!
Technical Update: Range Breakout?
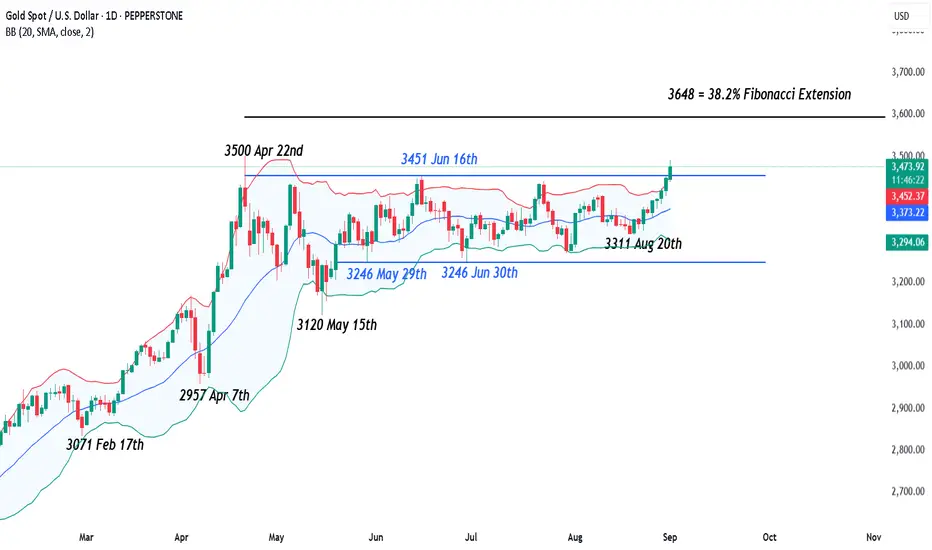
Since mid-May 2025, Gold had adopted a more balanced tone, forming a sideways trading range in price activity. This range was defined by the June 16th high at 3451 and the 3246 lows recorded on May 29th and June 30th.
However, as the chart above shows, the latest price strength, which has extended so far this morning, is seeing breaks above the 3451 June 16th high, reflecting possibilities of a breakout to the upside in Gold prices.
The key question now is whether this breakout from the range is confirmed on a closing basis leading to possibilities of a further phase of price strength, or weakness develops over the balance of Monday’s session, to see a prices settle back under the 3451 level. .
While it is impossible to predict if an upside breakout from a sideways range will be confirmed or not, a close above the resistance is required to suggest such possibilities. In the case of Gold, confirmation of this morning’s breakout would require a close above the 3451 resistance level.
It should be remembered, a breakout in either direction from a sideways range, may lead to an acceleration in price movement, due to what’s called the supply and demand vacuum.
Supply and demand vacuums form when traders become impatient waiting for their orders to trigger above a resistance or below a support of the on-going range. This impatience can lead them to adjust their orders, lowering sell orders to just below resistance or raising buy orders to just above support.
When traders shift orders into the range, raising bids above support or lowering offers below resistance, it can reinforce the strength of those levels and prolong the range. However, this also creates price zones just above and below the range with few active orders left. If a breakout occurs, the lack of immediate liquidity can lead to a sharp price acceleration until the next cluster of buy orders (on the downside) or sell orders (on the upside) are reached.
A reason for this morning’s initial acceleration higher in the price of Gold after the break above 3451, may be due to a supply vacuum above the resistance level. However, tonight’s closing level could also be an important focus for traders.
While not a guarantee of further strength, a close above the 3451 resistance may be seen by traders as a positive move, potentially paving the way for further gains in Gold.
A close above the 3451 resistance could signal a move toward the April 22nd all-time high at 3500. If breached, the next resistance may then be 3648, marked by the 38.2% Fibonacci extension.
For downside risks to re-emerge, which could suggest this morning’s move higher may be a false break of the 3451 resistance, traders could now be focusing on 3420, which is equal to the 38.2% Fibonacci retracement of latest price strength.
A close below this 3420 support, if seen, could trigger further weakness, potentially to retest 3380, the deeper 61.8% retracement, even then the August 20th low at 3311.
Pepperstone doesn’t represent that the material provided here is accurate, current or complete, and therefore shouldn’t be relied upon as such. The information, whether from a third party or not, isn’t to be considered as a recommendation; or an offer to buy or sell; or the solicitation of an offer to buy or sell any security, financial product or instrument; or to participate in any particular trading strategy. It does not take into account readers’ financial situation or investment objectives. We advise any readers of this content to seek their own advice. Without the approval of Pepperstone, reproduction or redistribution of this information isn’t permitted.
It's time for gold to fallMy dear friends,
Today we will analyse GOLD together☺️
The price is near a wide key level
and the pair is approaching a significant decision level of 3,635.58Therefore, a strong bearish reaction here could determine the next move down.We will watch for a confirmation candle, and then target the next key level of 3,617.96.Recommend Stop-loss is beyond the current level.
Those who have not yet been liquidated and those who are about to be liquidated should hold on because gold is going to fall.

A Healthy Market Breathes. Gold Hasn’t Exhaled Yet.I remain bullish on Gold overall — that’s not in question.
On 24 August, I even shared a complete cross-market outlook arguing that acceleration to the upside could be the next big move. And indeed, we got it.
But here’s the paradox of markets: sometimes, the stronger the rally, the more fragile it becomes.
________________________________________
Why I Warned About a Steep Correction
• Yesterday, I flagged the risk of a sharp pullback. My stop loss was triggered, yes, but my conviction hasn’t changed. If anything, the higher Gold pushes, the more probable and violent the correction could be.
• The daily chart says it all: since the local bottom around 3300, Gold has moved almost vertically higher.
• From 26 August onward, with the sole exception of the 4 September red candle, every single day closed green — and not just small gains, but +1% or more.
This type of move is powerful, but also unsustainable.
________________________________________
Market Psychology at Work
Markets move in cycles of fear and greed, tension and release. A one-sided move — especially a vertical one — compresses tension like a coiled spring. Traders get trapped:
• Late buyers rush in from FOMO, convinced “it will never stop going up.”
• Sellers get squeezed, forced to cover, adding fuel to the fire.
• But eventually, when there’s no one left to buy at higher prices, even a small wave of selling can cascade into a steep correction.
This is why not even Bitcoin, in its glory days, could sustain vertical rises for long. The pattern was always the same: euphoric rise → brutal drop . Gold is no different.
________________________________________
Where We Stand Now
• At the time of writing, Gold trades at 3647, after touching 3660 and marking a new ATH.
• Is this the local top? Hard to say with certainty. But in my book, until we see a strong correction, there is no valid buy trade here.
________________________________________
My Trading Plan
Today, I will look to sell again. Not because I doubt the long-term bullish trend, but because the short-term imbalance is glaring.
A healthy market breathes, and Gold hasn’t exhaled yet.
🚀 Long term: bullish.
⚠️ Short term: vulnerable.
🎯 Until a correction resets the board, my play is on the short side.

Gold (XAUUSD) Testing Major Resistance – Pullback Ahead?"Gold (XAUUSD) has rallied strongly after breaking out of the wedge pattern, confirming multiple BOS (Break of Structure) signals. Price is now testing a key resistance area near 3600, aligned with the upper boundary of the upward channel.
📌 Key Observations:
Strong bullish momentum after wedge breakout.
Resistance zone at 3580–3600 may trigger short-term rejection.
Possible pullback towards 3520 support zone before next move.
Short-term traders should watch for rejection signals at resistance for a possible pullback entry. Long-term bias remains bullish while price holds above the upward channel support.
📊 Levels to Watch:
Resistance: 3580–3600
This analysis is for educational purposes only and does not constitute financial advice. Always apply proper risk management.

XAU/USD (Gold vs US Dollar).XAU/USD (Gold vs US Dollar) on the 1-hour timeframe.
Based on the annotations in My Chart :
Current price: $3,613.28
Support area (green zone): around $3,589 – $3,600
Trendline is intact (uptrend).
Cloud (Ichimoku) is below price = bullish structure.
The chart shows a target point at ~$3,640 (marked with the blue arrow).
📌 Target Zone:
Your marked projection suggests $3,640 as the next resistance/target level.
⚠ Keep in mind:
If price breaks below the green support zone (~$3,589), it could test lower supports around $3,570 – $3,560.
If bullish momentum continues, the next extension beyond $3,640 could be toward $3,660 – $3,670.
👉 target = $3,640.

Gold Outlook: Consolidation Before the Next Rally?👋 Hello traders, what’s your view on OANDA:XAUUSD ?
Gold continues to move within a medium-term ascending channel , and the current Rising Wedge pattern shows that buyers are still in control. Recently, price has repeatedly bounced off the lower support trendline, confirming that strong demand is maintaining the uptrend.
At the moment, gold is testing the $3,600 level – both a technical and psychological barrier. I expect some short-term consolidation within this wedge before another push higher.
👉 As long as price holds above key support zones and remains inside the channel, the bullish scenario remains intact. A successful breakout above $3,600 could open the way towards $3,620 – $3,640 , then $3,700 , and if momentum accelerates, even $3,900 in the medium term is on the table.
📌 The primary trend is still bullish . Buyers just need one more catalyst to ignite the next strong wave.
What do you think? Can gold break past $3,600 and move higher? Share your thoughts in the comments!

GOLD ROUTE MAP UPDATEHey Everyone,
After completing Bullish Targets 3458 and 3477 yesterday, we got the EMA5 cross and lock above 3477, which opened 3497. That level was hit perfectly today. With no lock above, we confirmed the rejection, and now price is showing support and bounce at 3477.
We are now seeing play between 3497 and 3477 and will need ema5 cross and lock to confirm the next move.
We will keep the above in mind when taking buys from dips. Our updated levels and weighted levels will allow us to track the movement down and then catch bounces up.
We will continue to buy dips using our support levels taking 20 to 40 pips. As stated before each of our level structures give 20 to 40 pip bounces, which is enough for a nice entry and exit. If you back test the levels we shared every week for the past 24 months, you can see how effectively they were used to trade with or against short/mid term swings and trends.
The swing range give bigger bounces then our weighted levels that's the difference between weighted levels and swing ranges.
BULLISH TARGET
3458 - DONE
EMA5 CROSS AND LOCK ABOVE 3458 WILL OPEN THE FOLLOWING BULLISH TARGETS
3477 - DONE
EMA5 CROSS AND LOCK ABOVE 3477 WILL OPEN THE FOLLOWING BULLISH TARGET
3497 - DONE
EMA5 CROSS AND LOCK ABOVE 3497 WILL OPEN THE FOLLOWING BULLISH TARGET
3513
BEARISH TARGETS
3439
EMA5 CROSS AND LOCK BELOW 3439 WILL OPEN THE FOLLOWING BEARISH TARGET
3417
EMA5 CROSS AND LOCK BELOW 3417 WILL OPEN THE FOLLOWING BEARISH TARGET
3395
EMA5 CROSS AND LOCK BELOW 3395 WILL OPEN THE SWING RANGE
3369
3352
EMA5 CROSS AND LOCK BELOW 3395 WILL OPEN THE SECONDARY SWING RANGE
3336
3315
As always, we will keep you all updated with regular updates throughout the week and how we manage the active ideas and setups. Thank you all for your likes, comments and follows, we really appreciate it!
Mr Gold
GoldViewFX
