GOLD 4H – Descending Channel Outlook | Key Reaction Zones AheadHello Traders
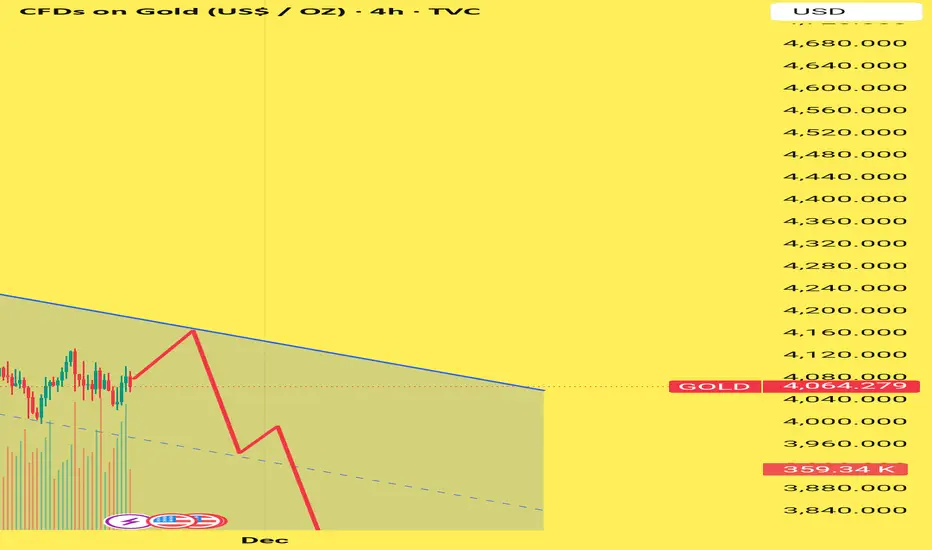
Gold on the 4H timeframe continues to respect a clear descending channel, with price moving steadily between the upper resistance trendline and the lower support boundary.
At the moment, price is trading near the mid-range of the channel, showing limited bullish momentum but still respecting the broader downtrend structure.
Key Highlights:
🔹 Upper Channel Resistance:
Price is approaching a major trendline where sellers have consistently reacted throughout October and November. A rejection from this zone keeps the bearish structure intact.
🔹 Mid-Channel Reaction:
The dashed median line continues to act as a dynamic pivot. Current price movement suggests temporary consolidation before a larger directional move.
🔹 Bearish Scenario (Most aligned with structure):
If price rejects the upper trendline again, a move toward the lower channel support remains possible. This level has historically provided strong reactions.
🔹 Lower Channel Support:
A drop toward this zone would complete the next leg inside the channel, maintaining the overall descending pattern.
Market Structure Insight:
The overall flow remains bearish as long as Gold trades inside this channel. The chart illustrates potential movement but does not represent any financial advice—simply an analysis of market structure based on visible trend behavior.
Trade ideas
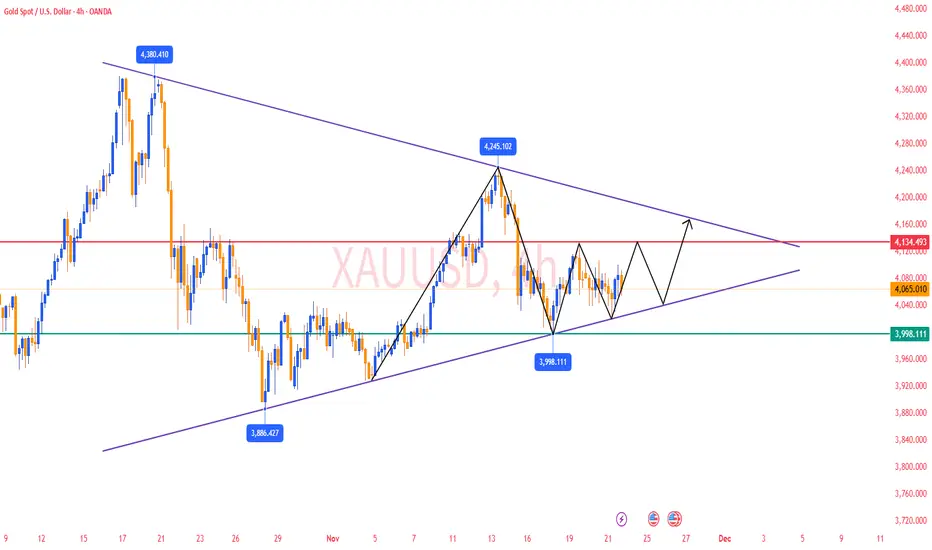
Gold 4H Outlook – Trendline Structure AnalysisGold is testing a key confluence area where the descending red trendline (bearish structure) intersects with the ascending green trendline (short-term support).
Despite the recent push higher, price action still shows rejection wicks near 4,220–4,230, indicating exhaustion and a possible return toward structural support.
As long as gold remains below the red trendline, bearish pressure remains active. A clean rejection here may trigger a short-term pullback toward the 4,160–4,150 region, followed by a deeper retest of the horizontal support around 4,128 — a major liquidity zone that aligns with the trendline intersection.
A confirmed candle close above the red trendline invalidates this scenario and reopens the path toward 4,253.
Structure Summary:
Below red trendline → bearish reaction likely
First target zone → 4,160–4,150
Major support / key test → 4,128
Break & close above red trendline → bullish continuation
This scenario remains valid as long as price respects the red trendline.
— Avo.Trades

Gold Market Observation ZonePrice is approacing an important area on my chart.I am watching this zone for potential market reaction based on past behavior.Thisis only my personal analysisfor educational purposes.

Xauusd from Ment-methodBig move up ahead as the aggressive bull broke the long term trendline. Consider todays is Friday session, lets take a look what happen next week as this week's slow move/accumulation might indicates a stage 2 moves next.

Gold is Bullish, With a Target around 4200The overall price action stayed steady, with the daily chart closing as a doji, indicating strong resistance above. In the short term, it’s not advisable to chase highs blindly. With the U.S. Thanksgiving holiday approaching, market activity is limited, while weaker-than-expected retail sales, persistent inflation pressure, and dovish comments from Federal Reserve officials are all providing potential upside momentum for gold.
For today, keep an eye on Russia–Ukraine-related developments and the Fed’s Beige Book. Also monitor shifts in market expectations for the December FOMC meeting and any updates on potential chair candidates, as the fundamental outlook remains uncertain for now. From a technical perspective, the four-hour downward trendline and the upper Bollinger Band form a confluence resistance. After yesterday’s failed rebound, be cautious of a renewed pullback or a return to weakness. The market is currently oscillating and entering a short-term shakeout phase, so beware of intraday spikes followed by reversals.
For short-term trading, focus on the breakout of the 4179-4186 . A bullish breakout may lead to a test of the 4200 resistance, where light short positions can be considered. On the downside, watch support at 4146–4139 first, followed by 4118–4100.

Bulls remain clearly bullish on gold.#XAUUSD OANDA:XAUUSD TVC:GOLD
Good morning. Gold prices surged yesterday due to external stimuli, and this trend continued today, reaching a high of around 4155. From a daily chart perspective, gold prices remain above the 5-day and 10-day moving averages. Considering the unstable geopolitical situation and the increased probability of an interest rate cut in December, as long as prices do not fall below 4100, the bullish trend will continue. Consider going long on gold if it pulls back to 4125-4115.

buy signal xauusd
📌 Buy Signal: XAUUSD (Gold/USD)
🔍 Why a Buy?
1. Strong Uptrend Momentum
Price has been making **higher highs and higher lows, clearly showing buyers are in control.
2. Bullish Breakout Retest
Price recently **broke above resistance** and is now retesting near the zone around **4,133 – 4,134**, turning it into support.
3. Volume Confirmation
The recent bullish candles are supported by **increasing volume**, showing participation from strong buyer
| Signal | Price Level |
| --------------------- | --------------------------------------- |
| Buy Entry | 4,133.948 – 4,134.341 (Purple zone) |
| Take Profit (TP1) | 4,150.058 (Blue marker) |
| Stop Loss (SL) | 4,127.708 (Orange marker) |
🎯 Risk-to-Reward: ≈ 1 : 2.5
👍 Good trade quality — controlled risk with strong upward target.
⚠️ Risk Disclaimer
Always manage risk — gold volatility is high. Consider reducing position size before major economic
If you'd like, I can also:
🟣 Mark the buy signal visually on the chart
📊 Provide TP2 & TP3 targets
🤖 Help you automate alerts on TradingView
Would you like me to add a **signal label + arrow** directly on the chart and re-upload it?

shortI’m taking a short-term short position on Gold after the market created a clear Change of Character (CHOCH) on the lower timeframe.
This shift shows early weakness and confirms that price may retrace before continuing its overall bullish trend.
🎯 Target:
The main target for this short is the 1-Hour BOS zone, which is the most logical area for a deeper pullback and where buyers may re-enter the market.
📌 Reasoning:
Higher timeframes remain bullish, so this is a short-term countertrend trade.
Lower timeframe CHOCH confirms momentum shifting temporarily to the downside.
Liquidity above previous highs has been taken, increasing probability of a retracement.
The 1H BOS zone is a strong demand area where price is likely to react.
⚠️ Note:
This is a tactical short, not a long-term reversal. I’ll switch back to longs once price reaches the 1H BOS zone and shows bullish confirmation.

Gold (XAUUSD) – H1 Market OutlookOn the H1 timeframe, Gold is currently showing consolidation around the 4120 zone, reflecting a pause after recent volatility. This area is acting as a short-term decision point where buyers and sellers are balancing out.
From a structural perspective, the current candles are leaning toward bearish momentum, suggesting that sellers are gradually building pressure. If this momentum continues, the price may revisit key intraday levels such as the 4100 zone as the first area of interest. A sustained move below this region could open the way toward deeper liquidity areas around 4080, and potentially extend into the broader demand zones near 4050–4030, where market participants have previously shown reaction.
For risk management in scenario-based analysis, the 4150 region remains an important invalidation zone, as a clear break above this structure may signal a shift in momentum or trend strength.
This outlook is shared purely for educational and analytical purposes, based on observable chart structure and price behavior. It should not be taken as financial advice or a buy/sell signal. Always confirm direction with your own analysis and risk approach.

XAUUSD: Start Short-SellingThe current uptrend of gold is clearly hindered. In the short term, the upper resistance lies in the 4080-4100 range. Before a valid breakthrough is formed in this range, gold is expected to enter a downward correction phase. The trading advice is to mainly follow the trend and go short, and wait for the end of the decline before going long again.
Gold Trading Strategy for Today:
XAUUSD Sell @ 4070-4080
TP: 4050-4030
With 15 years of focus on gold trading, I hope my trading experience can provide you with effective help. Accurate signals will be sent every day.

Upward ChannelExpecting to complete wave 5. Watching closely at the very top if will break out or Sell opportunity will be the next move.

XAUUSD – 4H Chart AnalysisTesting the Upper Boundary of the Descending Channel
XAUUSD continues to move within a medium-term descending channel , and price is now testing the upper boundary of this structure — a level that has repeatedly acted as resistance in recent weeks.
In the short term, the market is forming a narrow rising wedge , a pattern that often appears as a weakening corrective move within broader downtrends. Previous occurrences of this pattern on this chart have also led to pullbacks after touching the channel’s upper boundary.
As long as the channel resistance holds , the first area of interest on the downside is the 3880–3920 support zone, which represents a key structural floor in the current movement.
A break below this zone could open the path toward the midline of the channel and potentially lower levels.
The bullish scenario becomes valid only if price can achieve a clean breakout above the channel , supported by strong momentum and confirmed closes.

XAUUSD – Range Mapping & Possible Breakout Structure XAUUSD – Range Mapping for Possible Breakout Structure LONG
(Short, clear share-ready version)
Gold has been ranging cleanly between the 4212 / 3869 zones, and this structure continues to give very readable swing opportunities. The chart I’ve shared outlines two main scenarios I’m tracking:
1️⃣ Short-Term Liquidity Grab (Most Likely Path)
Price may push slightly higher into the upper liquidity pocket before rejecting and breaking down toward the deeper demand zone near 3855.
This remains the most consistent behavior gold has shown over the past several months — liquidity sweep → expansion → reversal.
2️⃣ Major Bullish Reversal From the Lower Zone
If we get a strong rejection and higher-low confirmation around 3855, gold could set up for a powerful multi-day bullish move back toward 4212, and possibly higher depending on the December momentum.
Why This Setup ?
Gold is reacting extremely cleanly to levels this week, and this range behavior is giving some of the best risk-controlled entries we’ve seen in a while. Tuesday–Wednesday tend to be the most decisive days for momentum, while Thursday and Friday often generate the deeper retraces that set up next-week opportunities.
Not financial advice — just a trader sharing what I see. Stay patient, wait for the confirmation, and protect capital, practice your entries. 👊

BUY GOLD XAUUSD*I am in no way a financial advisor and you should always do your own due diligence before placing any trade. Do not trade what you are not comfortable with losing. No trade is guaranteed.
Hold buys until the high
SL BELOW STRUCTURE OF PULL BACK , TP SET TO THE HIGH.

XAU about to go downXAUUSD is currently developing a valid high-quality harmonic confluence.
This potential reversal zone is further reinforced by multiple structural elements:
Overhead supply zone
A prior bearish order block
Liquidity resting above B, adding inducement
All confluences point to a high-probability bearish reaction if price reaches the D-completion zone.

Gold Analysis and Trading Strategies | Monday✅ Technical Outlook (4-Hour Structure)
● After reaching the historical high of 4381, gold entered a corrective phase, forming a segmented structure of “decline → bottoming → rebound.”
Each segment has lasted for roughly one week.
Currently, after touching 4245, gold has entered the second corrective wave, and from a cycle perspective, this adjustment is not fully completed yet.
● Over the past two days, gold has repeatedly found support around the 4000 psychological level, showing signs of rebound. This indicates that buyers are actively defending this area and that short-term bullish interest remains.
● Short-term moving averages (MA5, MA10, MA20) are currently clustered around the 4080–4100 region, forming strong pressure and signaling that the short-term trend remains bearish.
However, the long-term moving averages are slowly turning upward, suggesting that downside support remains valid and that deeper declines may be limited.
● The Bollinger Bands continue to narrow, indicating a range-bound and repetitive price structure.
The lower band is gradually aligning with previous lows, which together limit the downside space for further price declines.
✅ Daily Chart Structure
● Gold remains in a consolidation phase, with the overall Bollinger Bands displaying a gradual narrowing pattern, suggesting that a one-directional move is unlikely in the near term.
● The lower band is steadily rising and aligning with prior lows → limiting further downside risk.
● The upper band remains near 4100–4130, serving as the main short-term resistance zone for rebounds.
🔴 Resistance Levels: 4100–4130
🟢 Support Levels: 4005–4000
🎯 Trading Strategy Reference
🔰 Strategy 1 (Sell on Rebound)
● Short around 4100–4105 in batches
Targets: 4050–4020
Breakdown target: 4000
🔰 Strategy 2 (Buy on Pullback)
● Buy around 4000–4005 in batches
Targets: 4020–4030
Breakout target: 4050
📌 Outlook for Next Week
Overall, gold remains in a structure of weak consolidation — supported but with limited rebound strength.
The price is expected to continue oscillating within the 4000–4100 USD range next week.
● If Federal Reserve officials sound more “hawkish”:
Rate-cut expectations decline → USD strengthens → Gold may retest the 4000 support.
● If Fed officials turn more “dovish”:
Rate-cut expectations rise → Gold may retest the 4100 resistance zone.
● If geopolitical tensions escalate:
Safe-haven demand may push gold to break above the upper boundary of the range.
Next Monday’s short-term focus remains the 4000–4100 range.
Wait for a breakout, then follow the direction accordingly.
Watch for support and entry point for long positions: 4020.Negative news has been priced in; be wary of consumer data.
In the short term, from now until the next three months, gold is an overcrowded trade. Any information next week will be a risk for gold; only renewed hopes for an interest rate cut can boost prices. The meeting is scheduled for December 9-10, during which one or two additional data points may be released. Nevertheless, if expectations for a rate cut do not increase, gold prices are likely to remain stagnant.
The market expects investment demand to remain stagnant until the Fed clearly outlines its path. We need to be cautious whether a longer pause could catalyze a larger outflow of funds from the precious metals market.
After two rounds of pullbacks and sharp rises on Friday, gold prices consolidated slightly around 4065 at the close. Currently, there's no clear distinction between upward and downward momentum, and the market is likely to remain range-bound. A clear direction is unlikely in the first half of next week, and we'll have to wait for data releases before making new trades. One key level to watch next week is the area around 4030, which is the potential entry point for our entry strategy on the second day of next week.
On the hourly chart, gold is currently holding above 4020. If a pullback doesn't break this level next week, we can wait for a pullback to enter long positions. Similarly, if there's an initial rise, we'll still look at the resistance at 4100. Without a clear trend, we can focus on range trading for now. Market conditions are volatile, so please follow our real-time trading strategies.
Short-term trading strategy:
Buy around 4025-4030, stop loss below 4020, take profit at the 4080-4100 resistance level.

XAUUSD – LANA TRACKS MEDIUM-TERM WAVE 5 TOWARDS ATH REGION 4360 XAUUSD – LANA TRACKS MEDIUM-TERM WAVE 5 TOWARDS ATH REGION 4360
1. Fundamental Analysis
In the geopolitical context, President Putin continues to reiterate the conditions for a ceasefire between Russia and Ukraine. The possibility of a peace agreement remains open, but the tough statements indicate that the conflict risk cannot end soon. This keeps gold as a medium-term safe-haven asset.
On the other hand, in the US, Mr. Trump continues to emphasize the view that the stock market will continue to reach new highs and even mentions the possibility of abolishing most income taxes, replacing them with revenue from tariffs. These statements foster a "risk appetite" sentiment on stocks and the USD, creating a certain tug-of-war with gold in the short term.
In summary, Lana sees gold in the next 1–2 weeks still leaning towards a medium-term uptrend, but it is easy to see fluctuations as the market continuously re-evaluates geopolitical risks and policy expectations from the US.
2. Technical Analysis
The D1 frame is showing the Elliott wave 5 structure in the medium-term uptrend phase. Wave (4) has completed at an important support area, accompanied by a market structure shift (MSS) signal reversing upwards, paving the way for wave (5).
Using Fibonacci extension, the theoretical target for wave (5) can reach the 2.618 region around 4360, which is also a strong psychological resistance and near the ATH area – a region very prone to large profit-taking by buyers.
Along the way, the 4246 mark is an important resistance area:
If the price decisively breaks and closes the D1 candle above 4246, the uptrend will be more strongly confirmed, indicating that buyers are willing to push the price to new highs.
The downtrend line has been breached, then the price returned to test and bounced up, showing that buying power is regaining the advantage. The price retracing around the trendline & the 4133–4139 area will be an opportunity for Lana to find a buying point in line with wave 5 with a better R:R ratio.
3. Price Areas to Watch
Important resistance / medium-term profit-taking area:
4240 – 4246: intermediate resistance, needs to be broken to strengthen the uptrend.
4360: Fibonacci 2.618 region & potential ATH area of wave 5.
Support / potential buying area:
4133 – 4139: price area near the trendline, where Lana prioritizes watching for buying if a correction appears.
4124: technical stop-loss mark, below this area the short-term wave structure may weaken.
4. Trading Scenario
Buy 4133 – 4139
SL: 4124
TP: 4240 – 4280 – 4350
👉 Follow Lana on TradingView to read the earliest gold analyses. 💛

Gold Eyes $4,000Gold has been in a strong uptrend since its breakout from the accumulation range in December 2023, a move I anticipated and shared with traders (check the link below for my chart call). The recent 50 basis point rate cut by the Federal Reserve has injected fresh momentum into gold’s rally, setting the stage for a potential surge towards $2,700 to $3,000 USD in the coming months as part of a new market buy program.
However, the long-term picture remains even more bullish, with Fibonacci extension projections suggesting that gold could eventually test $4,000 USD. That said, we must bear in mind that gold’s history suggests periods of reaccumulation between major breakouts, which could last for a few years depending on market sentiment and the overall economic outlook.
Fed’s Rate Cut and the Market Buy Program
The Federal Reserve’s recent 50 basis point rate cut has created the perfect environment for further gains in gold. With interest rates dropping, the opportunity cost of holding non-yielding assets like gold decreases. At the same time, a weaker U.S. dollar, resulting from the rate cut, makes gold more attractive to foreign buyers, further boosting demand.
This shift in monetary policy is likely to lead to a market buy program, where investors increase their gold holdings as a hedge against inflation, currency devaluation, and economic uncertainty. With these factors in play, gold looks set to climb higher in the near term.
Target Range: $2,700 to $3,000 USD for Reaccumulation
In the short to medium term, I’m projecting gold to reach $2,700 to $3,000 USD, where we may see a reaccumulation phase. Here’s why:
Historical Patterns of Accumulation and Reaccumulation: Gold has a history of moving through accumulation and reaccumulation phases before breaking out to new highs. For example, the original accumulation phase for gold lasted about six years, and following that, there was a 3.6-year reaccumulation phase before the next major move upward. Once gold reaches $2,700 to $3,000 USD, I expect a similar reaccumulation phase that could last for a few years before the next breakout.
Fibonacci Extension Projections: Based on Fibonacci extensions, there is a strong case for gold reaching $4,000 USD in the longer term. These extensions are often used to identify potential future price targets in trending markets, and the current trend in gold is setting up for a move towards this key level. However, as mentioned, we could see a reaccumulation around the $3,000 USD mark before gold pushes higher.
Why Gold Consolidates Before Major Breakouts
Gold’s past price movements have demonstrated that the metal typically undergoes periods of consolidation (reaccumulation) before making its next big move. These phases allow the market to absorb supply, shake out weak hands, and build a stronger foundation for the next leg up.
At $3,000 USD, gold could enter another one of these phases, consolidating for a few years before breaking out towards $4,000 USD. The length of this consolidation will depend on various factors, including global economic conditions, inflation trends, and how central banks adjust their monetary policies.
Outlook: $4,000 USD in the Long Term
While the immediate focus is on gold’s move to $2,700 to $3,000 USD, the longer-term projection points toward $4,000 USD. This price target is based on Fibonacci extension levels, which have been reliable indicators in trending markets like gold. Achieving this level will depend on how the macroeconomic landscape unfolds over the next few years.
Factors such as continued dollar weakness, inflation concerns, and geopolitical risks will play key roles in driving demand for gold. However, given the history of accumulation and reaccumulation phases, it’s reasonable to expect a period of consolidation at $3,000 USD before gold embarks on its next major upward move.
Factors to Watch Moving Forward
Market Sentiment: Investor sentiment towards risk assets and safe-haven investments like gold will heavily influence the price trajectory. Increased uncertainty or global economic instability will likely accelerate demand for gold.
Fed’s Future Policies: Any further rate cuts or signs of dovish monetary policies could fuel more demand for gold, pushing prices higher.
Inflation Trends: Persistent inflationary pressures would enhance gold’s appeal as a hedge, further driving up demand and shortening the reaccumulation phase at $3,000 USD.
Conclusion
Gold’s breakout in December 2023 marked the beginning of a powerful uptrend, and the Fed’s recent rate cut has only added fuel to the fire. I’m projecting that gold will hit $2,700 to $3,000 USD in the near term, where we may see a reaccumulation phase lasting a few years. However, based on Fibonacci extension projections, gold could eventually reach $4,000 USD in the longer term.
Keep a close eye on market sentiment and macroeconomic developments, as these will be critical in determining how quickly gold moves through its next phases.
— Lord MEDZ
Disclaimer:
This article is for informational purposes only and should not be construed as financial advice. The opinions expressed are solely those of the author, Lord MEDZ, and do not guarantee any specific outcome. Investing in gold or any financial instrument involves risks, and readers should consult with a financial advisor before making any investment decisions.


XAUUSD BULLISHGold rally towards the Fair value gap, could determine how december rolls, sentimental support around $4000, providing a boost.
If the price rejects at the FVG price could turn bearish to end the year.
However, if there is a break out, we could see gold being bullish to open 2026.

Gold Reload Zone… Bulls Waiting Patiently!📈Gold remains overall bullish, respecting both its rising structure and the major support zones beneath current price. After breaking above the light-blue resistance area, XAUUSD is now pushing higher, but a pullback remains very likely before the next impulse.
⚔️On the upcoming retest of the blue structure zone and the rising trendline, we will be looking for trend-following longs. This area has acted as support multiple times and now aligns with the bullish context, making it a high-probability buy zone.
🏹As long as Gold remains above the red demand area and respects the rising structure, the next wave upward toward the 4,385 resistance remains the most likely scenario. Only a clean break below the red zone would weaken the bullish outlook.
For now, patience is key… wait for the retest, then look for longs from structure. 🤔
⚠️ Disclaimer: This is not financial advice. Always do your own research and manage risk properly.
📚 Stick to your trading plan regarding entries, risk, and management.
Good luck! 🍀
All Strategies Are Good; If Managed Properly!
~Richard Nasr

Gold H1 – Is This Just a Range or a Break Incoming?🟡 XAUUSD – Intraday Smart Money Plan | by Ryan_TitanTrader (21/11)
📈 Market Context
Gold continues to trade inside a compressed intraday range as markets react to the latest discussion on whether the Federal Reserve is likely to cut interest rates anytime soon.
According to new reports, policymakers remain cautious, and early rate-cut expectations are fading as inflation progress slows.
This shift pushes USD stronger, increases Treasury yields, and temporarily weakens gold’s bullish momentum.
Key takeaways from the news:
• Fed officials note that inflation is “still not where it needs to be,” reducing the probability of early rate cuts.
• Markets have scaled back expectations for a Q1 cut, keeping USD supported.
• Higher yields → tighter financial conditions → gold struggles to break premium levels.
• Institutions are likely engineering liquidity grabs on both sides before committing to a new directional move.
Price is currently sitting near the 4030–4045 zone, right above discount liquidity, waiting for a catalyst to break out of the short-term compression.
🔎 Technical Analysis (1H / SMC Structure)
• Market Structure:
Gold has completed a clear CHoCH + short-term bearish sequence and is now compressing into the discount zone around 4030.
• Premium Sell Zone (4H Supply):
4128–4130 aligns with unmitigated supply + buy-side liquidity resting above internal highs.
• Discount Buy Zone:
4030–4028 sits inside the last clean demand zone where a previous sweep occurred.
• Liquidity Map:
→ Buy-side liquidity: above 4128–4135
→ Sell-side liquidity: below 4028–4020
Institutions are likely to sweep one side before delivering direction.
🔴 Sell Setup (Premium Reaction Zone)
• Entry: 4128 – 4130
• Stop-Loss: 4140
• Take-Profit:
→ 4080 (minor imbalance fill)
→ 4045 (range EQ)
→ 4030–4028 (discount demand retest)
📌 Execution rule: Wait for liquidity sweep into the zone + bearish CHoCH on M5–M15 before entering.
🟢 Buy Setup (Discount Reaction Zone)
• Entry: 4030 – 4028
• Stop-Loss: 4020
• Take-Profit:
→ 4060 (short-term reaction level)
→ 4095 (inefficiency fill)
→ 4120 (premium retest)
📌 Valid only if price sweeps the 4030–4028 pocket and shows bullish displacement from discount.
⚠️ Risk Management Notes
• USD strength may spike unexpectedly as rate-cut bets fade — reduce position size during volatility.
• Avoid trading inside the 4045–4085 chop zone unless a clean structure break forms.
• Manage trades aggressively once liquidity levels are taken.
• Expect engineered manipulation during low-volume Asian hours.
📝 Summary
Gold is compressing inside a narrow intraday range as markets reassess the likelihood of Fed rate cuts.
SMC structure suggests a two-sided liquidity sweep before a decisive move:
• Sell Zone: 4128–4130 (premium supply)
• Buy Zone: 4030–4028 (discount demand)
Expect classic accumulation → sweep → displacement patterns until macro conditions create a new trend.
📍 Follow @Ryan_TitanTrader for more Smart Money updates.
