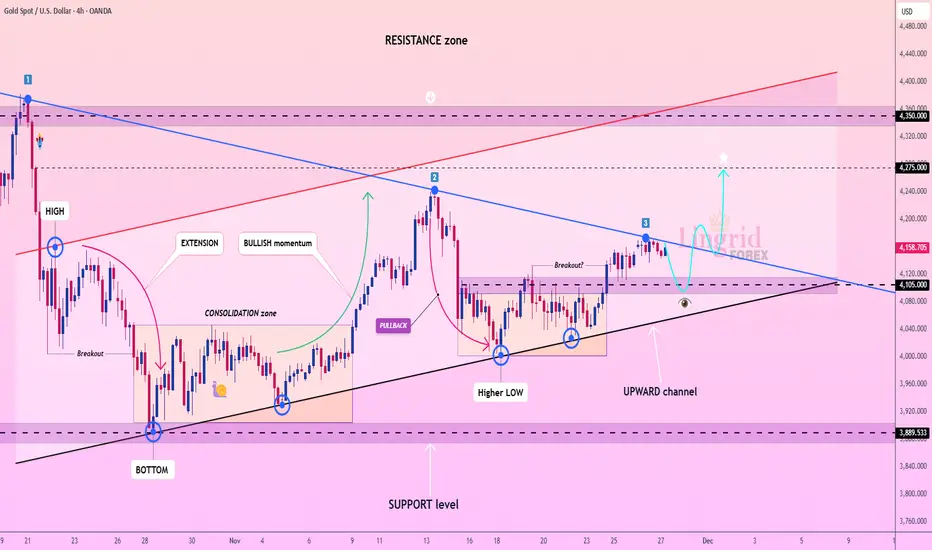
XAUUSD – Bullish Breakout & Upside Expansion Setup📊 XAUUSD – Bullish Breakout & Upside Expansion Setup
🔍 Market Overview
Gold is showing a strong bullish recovery on the 1D timeframe, following an extended consolidation phase above the 4,070–4,125 support zone. Price has recently accelerated higher from the rising trendline and is now testing the
Gold (XAU)
No trades
No trades
Details
Gold price is widely followed in financial markets around the world. Gold was the basis of economic capitalism for hundreds of years until the repeal of the Gold standard, which led to the expansion of a fiat currency system in which paper money doesn't have an implied backing with any physical form of monetization. AU is the code for Gold on the Periodic table of elements, and the price above is Gold quoted in US Dollars, which is the common yardstick for measuring the value of Gold across the world.
Market Structure: Bearish | Trend: Downtrend Control | BiasXAUUSD 1D | Smart Money Structure + Liquidity Zones
Professional Candle-by-Candle Educational Description (With Reasons)
---
1. Initial Bullish Expansion Candles
The market started with strong bullish candles creating higher highs and higher lows. Buyers showed clear control and price moved upw
Gold Rounding Bottom Breakout Signals Further Upside To 4,450$Hello traders! Here’s my technical outlook based on the current XAUUSD (4H) chart structure. XAUUSD previously traded inside a broad range before breaking below the 4,450 Support Level and moving lower. After forming a rounding bottom, price broke above the descending trendline, signaling a bullish
Gold 30Min Engaged ( Bullish Reversal Detected )HANZO MARKET LIQUIDITY REPORT
Gold
Timeframe: 30min (Volume Basis)
Scale: Higher Timeframe Context / Deep Volume analysis
━━━━━━━━━━━━━━━━━━━━━━
Market Observation
This analysis is focusing on structural behavior, liquidity zones, Volume analysis
and key areas of interest within the current range.
XAUUSD | CHoCH, BOS & Liquidity Mapping AnalysisXAUUSD 4H | Smart Money Structure + Liquidity & Demand Zones
Professional Candle By Candle Educational Description (With Reasons)
1. Initial Bearish Movement Candles
Starting candles showed strong selling pressure from higher levels. Large bearish bodies and continuous downside movement indicated
XAU/USD: THE 4,460 MACRO TARGET EXPANSION! 🪙🚀
Pulling back toward ascending support at 4,344.255! Are you panic-selling this healthy higher-low retest, or locked in for the multi-wave rally to the 4,460 target ceiling? 🤔
Gold is maintaining a strong bullish trend on this 1-hour OANDA chart. Spot gold is trading around 4,344.255, pulling bac
Mastering High-Probability SMC Reversals: Inducement & OBRetail trading models often fail because they ignore underlying market liquidity. In this detailed lesson, we break down the step-by-step anatomy of a High-Timeframe (HTF) bearish reversal setup where Inducement (IDM) acts as our primary high-probability confirmation.
Core Strategy Overview
Strateg
Gold 30Min Engaged ( Bearish Reversal Detected )HANZO MARKET LIQUIDITY REPORT
Gold
Timeframe: 30min (Volume Basis)
Scale: Higher Timeframe Context / Deep Volume analysis
━━━━━━━━━━━━━━━━━━━━━━
Market Observation
This analysis is focusing on structural behavior, liquidity zones, Volume analysis
and key areas of interest within the current range.
Gold Analysis: Smart Money Accumulation After Liquidity HuntGold is currently showing signs of a potential bullish recovery after a prolonged bearish move. Price formed a strong liquidity sweep near the weak low area, followed by a Change of Character (CHoCH), indicating a possible shift from bearish momentum toward bullish structure.
Demand Zone & Bullish S
BULLISH MOMENTUM CONTINUES — CAN BUYERS PUSH TOWARD 4430?Gold continues to break higher strongly, supported by positive news flow for the metal. The H2 structure remains clearly bullish with a sequence of Higher Highs and Higher Lows, keeping buyers firmly in control.
Price is currently consolidating near the 4370–4380 resistance zone after the strong ra
See all ideas
Displays a symbol's price movements over previous years to identify recurring trends.