GOLD Still Very Bearish , 2 Short Setups Valid To Get 500 Pips !Here is My 30 Mins Gold Chart , and here is my opinion , we are Below 3972.00 With 4H Candle And this never happened for a long time ! and we have a 4H Candle closure below it And Perfect Breakout and this give us a very good confirmation , so we have a good confirmation now to can sell after the price go back to retest the broken area 3972.00 and this will be my best place to sell to can use small stop loss , and i have another place if he price will not go up more to retest 3972.00 m we have a very good res level 3940.00 , if we have a good bearish price action when the price touch it we can sell from it and targeting 100 to 200 pips , and if the price didn`t give us a good bearish price action from it i will wait the price at 3972.00 to can sell and targeting 200 to 500 pips , if we have a daily closure above this area this mean this idea will not be valid anymore .
Reasons To Enter :
1- Perfect Breakout .
2- Clear Bearish Price Action .
3- Bigger T.F Giving Good Bearish P.A .
4- Bearish Control .
5- Perfect 4H Mins Closure .
Trade ideas

Gold finally has a supply range! Time for bullish correction?I talked about everything but the obvious inverse head and shoulders/Quasimodo forming the right shoulder now. If everything goes right can we expect an arm to extend upwards here during the stochastic buy cycle?
Let me know what you think and be sure to share and care for others if you found this helpful.
Also talked about the "REAPER WARNING" as we have a reaper inversion range actively terrorizing price 🧩

Gold's massive market sweep!Yesterday's gold market was volatile. After confirming a high of 4375 in the Asian session, it began to decline. The decline continued throughout the Asian, European, and US sessions, breaking below 4200 and 4100, briefly dipping above 4080 before stabilizing slightly and rebounding in late trading. The daily chart finally closed with a large bearish candlestick pattern around 4130. For intraday trading, focus on the following points:
Price Analysis
Resistance: 4150, followed by 4190, then 4220, and then 4250.
Support: Around 4120, followed by 4100, then 4080, and then the 4010/4000 area.
Trend and From a timing perspective:
The prevailing pattern is a broad sweep and clean-up, characterized by rapid speed, large amplitude, and numerous turning points. This means that the current market trend is not a single directional issue. Within smaller timeframes, long and short positions can interact with each other, but it's crucial to focus on the timing of these shifts. Hitting the right nodes will yield gains for both long and short positions, while hitting the wrong nodes will also result in losses for both short positions. In other words, timing is crucial in the short term.
Based on the market's specific performance: A small double top formed above 4385, entering a broad sweep and clean-up phase. The first move at 4380... After testing 4180 and consolidating the resistance at 4380 for the second time, it broke below 4180 yesterday with a high of 4375, pushing the market down to 4080. In other words, judging by the daily chart structure, the first characteristic of this large-scale sweep cycle is the alternating yin-yang pattern on the daily chart. That is, after yesterday's significant yin-yang decline, if this cycle holds true today, consider a potential bullish trend today.
A bottoming-out followed by a pullback to a bullish close (of course, this is just a hypothesis and requires further market verification).
Looking at the current market performance, yesterday's high of 4375 retreated, testing 4240 in the European session, before consolidating again. The new low at 4130 is expected to be around 4090 and 4180 respectively. The market is currently trading at 4130 with a target of 4000 levels but with a resistance of 4000 levels at the moment and a move above 4130 as the support level. The sweeping correction requires consideration of the stabilization of the decline while short-term bears are gradually weakening and the trend is shifting upwards. Specifically, after breaking the high in the afternoon, a second buy attempt is made after a pullback. Here, a long position at 4116 is suggested, with continued upward movement before the European session, followed by a reduction at 4140 and a full profit at 4160. The current trend seems to confirm the previous view. The daily chart shows a sweeping cycle (with alternating negative and positive signals, the probability of a continuous rise and positive trend after today's bottoming out and rebound is relatively high).
With the bottoming out and stabilization and upward expansion confirmed, the next consideration during the European and American trading sessions is the continuity and strength. Here, the rhythm is also divided by spatial distribution:
From the perspective of support below:
1. The support zone for a breakout from the morning high and a pullback to consolidate is located in the 4100/4110 area (this is the dividing line for maintaining a bullish trend in the future). Holding above this level could result in a sweeping rally (above 4100) or a strong rally (around 4120). Conversely, if it falls below 4100, the Asian session will see an uptick. If it finds pressure in the European session and falls back below the dividing line, a wide range sweep between the highs and lows is expected.
Upper resistance zone:
4190/4200 area (the 0.5 dividing line is also the previous top-bottom conversion line). The spatial dividing line at 0.618 in the 4240/50 area is also the top-bottom conversion line before yesterday's European session decline, and is also the current middle track position on the four-hour chart.
In summary: A large-scale sweep and clean-up, with large and rapid shifts to long positions, does not have an absolute direction in the short term; it is more important to focus on the timing of the long-short transition to identify opportunities. The intraday deep squat and stabilization (slowing decline) suggest a low-to-long strategy at 4185. While holding lower in the afternoon, breaking the morning high and stabilizing, the short-term trend shifts to bullish (continue to hold long positions above 4116 and stretch again). The rhythm of the upcoming European and American sessions will be determined by gains and losses in spatial distribution. Hold above 4100, or conduct a sweep upward move above 4100, or a strong rally above 4120 (a break below 4100 would shift the short-term momentum, transitioning to a wide range-bound sweep based on the Asian session low of 4004 and the European session high). Focus on 4190/4200 and 4240/50 on the upside.
Operational:
1. Repeated dips above 4185 in the Asian session led to a push above 4130; subsequently, a dip above 4116 led to a profit above 4160.
2. Hold the 4100 level in the European and American sessions (a bullish sweep above this level still presents a potential upside opportunity, with support at 4105/4110. Defend against 4095). Below this level, the US market structure shifts and the US trading range re-orients.

Gold Outlook after the Dip. What to expect NOW?The price correction has ended, and the price is now in a strong support zone according to Fibonacci levels. From this point onward, the price is expected to rise and retest its previous high.

Gold weekly chart with both buy and sell entriesLast week both buy and sell levels hit for over 1000 pips each.
This will probably be my last chart for awhile as i dont think theres much intrest in this
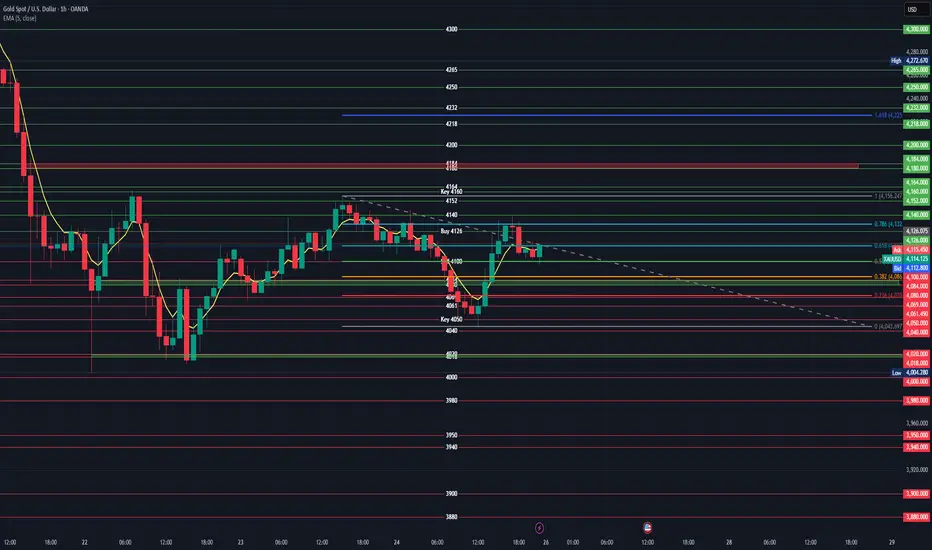
### XAUUSD 4-Hour Chart Analysis
#### **Key Levels Identified**
The chart shows critical **support/resistance zones** based on Fibonacci retracements, historical price action, and labeled key levels. Below is a breakdown of actionable buy/sell levels:
---
### **1. Buy Levels (Long Entry)**
These levels represent potential support where price may reverse upward:
- **Primary Buy Zone**: `4,126` (labeled "Buy 4126" on the chart)
- **Why?** This level aligns with the **0.236 Fibonacci retracement** of the recent swing high (4,164) to swing low (4,004). Historically, price has bounced here.
- **Entry Trigger**: Wait for bullish reversal signals (e.g., bullish engulfing candle, RSI divergence, or price closing above the 5-period EMA).
- **Stop Loss**: `4,095` (below the "Sell 4100" resistance level).
- **Take Profit**: Target `4,160` (Key 4160 resistance), then `4,180` and `4,184`.
- **Secondary Buy Zone**: `4,110–4,115` (near the 0.618 Fibonacci retracement at `4,113.253`)
- **Why?** The price is consolidating here after a dip. A hold above `4,100` (Sell 4100 level) suggests bullish momentum.
- **Stop Loss**: `4,095` (as above).
- **Take Profit**: Same as primary zone (`4,160` and beyond).
---
### **2. Sell Levels (Short Entry)**
These levels represent potential resistance where price may reverse downward:
- **Primary Sell Zone**: `4,132` (0.786 Fibonacci retracement of the swing high/low)
- **Why?** This level is a strong resistance zone where the price often reverses after a rally.
- **Entry Trigger**: Wait for bearish reversal signals (e.g., bearish pin bar, RSI divergence, or price rejecting the level).
- **Stop Loss**: `4,135` (above the resistance level).
- **Take Profit**: Target `4,099` (0.5 Fib), then `4,086` (0.382 Fib), and `4,050` (Key 4050 support).
- **Secondary Sell Zone**: `4,160` (labeled "Key 4160")
- **Why?** This is the **major swing high** (4,164) and a key psychological resistance level. A rejection here confirms a bearish trend.
- **Entry Trigger**: Price must break above `4,160` and then fail to hold (e.g., a bearish candlestick pattern at the level).
- **Stop Loss**: `4,165` (above the resistance level).
- **Take Profit**: Same as primary sell zone (`4,099` and below).
---
### **Critical Context**
- **Current Price**: `4,111.797` (EMA 5 close). This is **above support (`4,100`)** and **below resistance (`4,132`)**.
- **Trend**: Short-term downward momentum after the 4,164 high, but price is recovering from a low. Wait for confirmation of reversal.
- **Fibonacci Retracement**:
- `0.786` (4,132) and `0.618` (4,113) act as key resistance/support.
- `0.5` (4,099) and `0.382` (4,086) are stronger support levels.
- **Risk Management**:
- Always use a stop loss to limit downside risk.
- Target levels should align with the broader trend (e.g., if the trend is bearish, prioritize sell setups).
---
### **Summary of Actionable Levels**
| **Trade Type** | **Entry Level** | **Stop Loss** | **Take Profit** | **Confirmation Signal** |
|----------------|-----------------|---------------|-----------------|-------------------------|
| **Buy** | 4,126 (primary)4,110–4,115 (secondary) | 4,095 | 4,160 → 4,180 → 4,184 | Bullish reversal candle, RSI divergence |
| **Sell** | 4,132 (primary)4,160 (secondary) | 4,135 → 4,165 | 4,099 → 4,086 → 4,050 | Bearish reversal candle, RSI divergence |
> **Note**: Always validate entries with additional indicators (e.g., RSI, volume) and avoid trading during low-volume periods. The 4-hour timeframe favors medium-term trades (1–3 days), so patience is key.
#XAUUSD: Massive Drop Is In Making! Bears In ControlDear all,
We are seeing significantly increased bearish volume since yesterday now we think price is likely to remain bearish for couple of days or week so price could make major correction. Please wait for price to settle down.
Good Luck
Team Setupsfx_

Gold suffers biggest crash since 2013: What’s next for metal?Gold just experienced its worst single-day crash since 2013, plunging over 8% from record highs after forming a double top.
What’s behind this dramatic move, and what’s next for gold?
After a strong rally driven by fiscal and trade uncertainty and delayed US economic data, gold suddenly tumbled to the $4,000s. This sharp drop comes amid technical overextension and ahead of a crucial US CPI report due Friday, with the government shutdown still adding to market uncertainty.
Overextended : Gold was heavily overbought on multiple timeframes (4-hour, daily, weekly, monthly), with a double top and weakening RSI signalling a correction was due.
Profit-taking ahead of CPI : Many traders secured profits before Friday’s CPI report, with consensus expecting inflation to tick up, potentially impacting Fed rate expectations and the US dollar.
Trade developments : De-escalation between the US and China, with Trump and Xi set to meet at APEC, reduced some risk premium that had supported gold.
Support and scenarios : Strong support levels remain, with a possible further downside to the 38.2% Fibonacci retracement (~$3,945), but a deeper drop to $3,735 is seen as unlikely unless catalysts turn more bearish.
Volatility is back in the gold market! Will this correction turn into a longer consolidation, or is it just a pause before new highs?
Watch the key levels and upcoming CPI data, and remember—trade smart, respect your risk, and cash out when needed!
This content is not directed to residents of the EU or UK. Any opinions, news, research, analyses, prices or other information contained on this website is provided as general market commentary and does not constitute investment advice. ThinkMarkets will not accept liability for any loss or damage including, without limitation, to any loss of profit which may arise directly or indirectly from use of or reliance on such information.

How Smart Money Moves Gold (XAUUSD)🟡 Gold never moves randomly — it moves with intention.
Every spike, every fake breakout, every sharp reversal… it’s all part of a bigger plan by smart money (institutions) to trap emotional traders and collect liquidity.
Let’s break it down 👇
⚡ 1️⃣ Liquidity Grab (The Trap Phase)
Before any real move, gold sweeps stop-losses above highs or below lows.
Retail traders think it’s a breakout — but it’s actually a liquidity hunt.
Smart money fills large positions here while emotions run high.
⚡ 2️⃣ Market Structure Shift (The Clue)
After collecting liquidity, watch for a BOS (Break of Structure) or CHoCH (Change of Character) — these reveal when the real move is starting.
⚡ 3️⃣ Smart Money Entry (The Real Move)
Once the trap is set, gold often makes a strong impulsive push.
This is where institutions enter — and where smart traders follow with confirmation, not emotion.
⚡ 4️⃣ Emotional Traders Lose, Logical Traders Win
The market doesn’t hate you — it simply feeds on emotional reactions.
Be patient, wait for liquidity sweep ➜ structure shift ➜ confirmation entry.
🧭 Pro Tip:
👉 Stop chasing candles.
👉 Study liquidity and market structure.
👉 Let the chart show who’s trapped — and then trade against them.
💬 Remember:
“The market rewards patience, not panic.”
💎 Gold (XAUUSD) moves on liquidity — not luck.
#TradeSmart #ThinkLikeInstitutions #XAUUSD

GOLDThe era of cheap gold ends
From 1919 to 2015, the price of gold due to Gold Fixing. The price was set by London Gold Market Fixing Limited. On March 20, 2015 fixing ceased to be installed according to the old methodology and was replaced by electronic auctions LBMA Gold Price.
Initially, the "golden five" consisted of the following companies
1.N M Rothschild & Sons
2.Mocatta & Goldsmid
3.Pixley & Abell
4.Samuel Montagu & Co
5.Sharps Wilkins
What now?
Thirteen market participants are accredited to participate in LBMA Gold Price trading:
Bank of China
Bank of Communications
China Construction Bank
Goldman Sachs International
HSBC Bank USA NA
ICBC Standard Bank
JPMorgan Chase
Morgan Stanley
Société Générale
Standard Chartered
The Bank of Nova Scotia - ScotiaMocatta
The Toronto Dominion Bank
UBS
These banks all belong to the same families.
Most of the gold has already been bought and there is no point in keeping it at this level.
In a period of instability, investors will seek refuge for their assets. And gold will not be a bad refuge for long term.
WE WILL BE GOLD BEFORE THE PORN, WHILE GOLDEN IDEOLOGISTS WILL EXIST . Rothschild's

Gold : good RR opportunity for shortClassic breakout pullback on H4. The price is currently at my entry area. If the next H4 candle closes as bearish, consider it as a confirmation to go down. trade safe.

GOLD → Correction after aggressive growthFX:XAUUSD is in a correction phase after a month and a half of aggressive growth. The price is forming a trading range and continues to storm support...
The record growth was overheated, and traders are closing long positions. A gradual change in the fundamental background and market sentiment is also provoking an outflow of funds. However, US-China negotiations, the ongoing US shutdown, and the tense geopolitical situation, including the cancellation of Trump's meeting with Putin, create additional risks in the economy, which may support the metal.
The correction in gold looks like a healthy pause. The $4,000 level remains key support. A recovery above $4100 indicates continued buyer interest, but further dynamics depend on news about trade negotiations.
Resistance levels: 4082, 4107, 4163
Support levels: 4059, 4000
A breakdown of the trading range support could trigger further sell-offs. Focus on 4000K, aggressive reaction possible. At the moment, the market is falling as aggressively as it rose. We need to wait for the price to slow down in order to make reasonable technical decisions.
Best regards, R. Linda!

Lingrid | GOLD Weekly Analysis: Pullback From Record HighsThe price perfectly fulfilled my previous weekly idea . OANDA:XAUUSD market continues to navigate through considerable volatility as it pulls back from the recent spike that tested zone below the $4,400 resistance zone. After achieving a new all-time high, the metal is now experiencing natural selling pressure and technical correction, bringing some gravitational force into the equation. Despite this near-term weakness, the underlying trend structure remains constructively bullish, suggesting any substantial decline could present attractive entry opportunities for those seeking value.
The technical landscape reveals gold trading within a well-defined upward channel that has guided the rally since late September. The recent rejection from resistance has brought price action back toward the mid-channel area around $4,200, which aligns with the previous Monday high below and represents a crucial inflection, optimal entry point. The triangle pattern that formed during the consolidation phase earlier in the trend provided the springboard for the explosive breakout, and now the market may repeat this pattern, creating continuation formation.
The key support zone sits at $4,130-$4,135, and holding above this level would keep the bullish structure intact for another potential test of $4,400 and beyond toward the $4,500 projection zone. However, failure to hold could trigger deeper correction toward the lower channel boundary near $4,000 or even the stronger support at $3,730-$3,780, which would actually offer more compelling risk-reward for strategic accumulation. The coming week will clarify whether this represents healthy digestion or something more corrective in nature.
If this idea resonates with you or you have your own opinion, traders, hit the comments. I’m excited to read your thoughts!

The Ultimate GOLD & SILVER Outlook || 5 Trade Setups + FOMC UpdaWelcome to Trade with Decrypters!
📊 DETAILED & COMPLETE ANALYSIS (5 TRADE SETUPS) — Gold & Silver Outlook
1️⃣ Central Bank Buying
* Q1–Q2 2025 net: 410t (+15% YoY)
* August: +19t
* BRICS hold 6,000t (21% of global reserves)
* Top buyers: 🇵🇱 Poland +90t | 🇨🇳 China +35t
* Motive: USD hedge + BRICS 2026 currency prep
📈 Outlook: Sustained demand supports 10–15% long-term gold upside
2️⃣ ETF Inflows & Sentiment
* Q3 inflows: $26B | AUM $445B (+25% YoY)
* Holdings: 3,200t
* Asia: +37t | US: Neutral
* Gold RSI: 68 (Support: $3,800 | Resistance: $4,000)
* Silver RSI: 72 (Support: $32)
🎯 Projection: Gold → $4,000/oz (Q4, +1%) | Silver → $35/oz (+9%)
3️⃣ Macro & Geopolitical Events
* Fed cuts: 75bps → 3.75%
* USD: -8% | CPI: +3.2%
* Tariffs add +0.5% global inflation (→ 4.2%)
* BRICS trade pacts counterbalance USD weakness
* Gold already +57% YTD on 20% risk premium
📊 Outlook: Trade wars + Fed easing = 5–7% metals gain H1 2026
4️⃣ Silver Deficit
* 2025 deficit: 118M oz
* Supply: 1.02 Boz | Demand: 1.20 Boz
* Industrial share: 59% (EVs China +25%, Solar +30%)
* Recycling: 20%
📈 Projection: 150M oz deficit (2026) → Silver +15%
5️⃣ Futures & Options Flow
* CME Gold OI: 550k (+10% MoM)
* Silver OI: 180k (+8%)
* GVZ: 18%
* Call/Put ratio: 2:1 | Net long: 65k gold calls
📊 Outlook: OI rise + call bias = 20–25% vol breakout Q1 2026
🔮 Fundamentals & Forecast
* Gold: 450t CB buying + de-dollarization →
🎯 $4,200/oz (end-2025, +12%) | 🎯 $5,000 (2026)
* Silver: 118M oz deficit + 59% industrial →
🎯 $38/oz (end-2025, +18%) | 🎯 $60 (2026)
⚡ Drivers: Fed easing, 4.2% inflation, US deficit, BRICS shift → strategic metals outperformance
🏦 FOMC Update (Oct 29, 2025)
* Decision: 2:00 PM ET
* 98%+ chance of 25bps cut → 3.75–4.00%
* Powell press conference: 2:30 PM ET
* Dot plot & QT update expected
* Markets volatile → cut likely supportive for Gold, Silver, Stocks & Crypto
Disclaimer: This analysis is for educational purposes only. Not financial advice.

Xauusd Bullish SetupThis Gold (XAU/USD) analysis presents a bullish setup on the 30-minute chart. The price is expected to rebound from the support zone around 4097, where a buy limit trade is placed. The stop loss is positioned at 4046 to manage downside risk. The analysis targets an upward move towards 4165 (first take profit), 4227 (second take profit), and a final target at 4318, indicating strong potential for a recovery and continuation of the uptrend.

GOLD HIGH PROBABILITY SETUP SOON!!! 🚨 XAUUSD HIGH PROBABILITY BUY SETUP 🚨
* Here We Can See Clearly The Next Potential Moves For GOLD Coming Hours/Days.
* Keep Your Eyes Close On Your Trading Positions.
* Happy PIP Hunting Traders.
FXKILLA.

Gold Rebounds Strong – Next Stop 4230!Gold (XAUUSD) showed a sharp decline in last two days, marking a strong correction phase after making new highs. However, today’s price action indicates that buyers are stepping back in around the 4000 psychological Major support Area.
Currently, gold is trading near 4113, and now there are high possibilities that gold will go for long till the Target level 4160 and Target level 4230..
KEY POINTS
Current price 4113
Target level 4160
Target level 4230
Major support 4130/4100

Gold on Support levels / #6,100.80 Medium-term TargetTechnical analysis: This week's huge red Daily candlestick pattern is an indication of increased tension and war / conflict escalation negativity as geopolitical tensions arise which invalidated Buyers intent and comforted Short-term Gold’s Sellers early on. Gold was once again on High demand as Investors used the metal as an traditional safe-haven asset where capital strongly flew into Gold, pushing the Price-action way above the #13-Month High’s however due Profit taking of most Buyers (Long-term Investors) Gold dipped on Friday's session traditional Profit taking and was testing #4,000.80 benchmark and as (by my personal opinion) DX skyrocketed and engaged Short-term Buy-off rally where Selling pressure from DX de-escalated Gold towards June #1 High’s again (currently even Lower) and currently it is the question where market will be headed next. Gold was on hard Resistance levels and current consolidation levels (historical regression analysis) points that when Trading for Long on those levels, strong downside direction comes in form of #100 to 200 point + decline. Besides this, nothing else Supports the downwards argument (except current High Impact factor) since all Charts turned critically Bearish on Short-term. #4,000.80 mark is now new / old Support and by my calculation chances for breaking it again without new news are Technically really impossible (too far fetched and without catalyst to take the Price-action towards those / current High’s).
My position: However, in each market situation, Trader has to adapt. Therefore, do not take strong bets on the market, Buy and Sell current Intra-day timeframe with aggressive Scalps (#3 to #5-points) and close your order, calling it for the week. Expect new instructions with my Monday-session commentary. Also my #6,100.80 benchmark is posing as my new Medium-term Target.

Gold ready for retest ath 4380Gold (XAU/USD) showing bullish reaction from the support trendline. The circled candle indicates buyer strength, suggesting a possible recovery toward 4279–4380 resistance levels.
Support Trend Line:
Shows long-term bullish structure — price respecting the ascending trendline.
Support Zone (4181 – 4253):
Key demand area where buyers are stepping in to defend the trend.
4279 Level:
Immediate resistance; a breakout above could confirm short-term bullish momentum.
4313 Level:
Next resistance target after 4279; possible area for partial profit-taking.
4380 Level (ATH Retest):
Major resistance zone — potential final target if bullish move continues.
Indicates buyer reaction at the trendline, signaling possible reversal toward 4279.

Gold Extends Its Decline Below the $4,000 LevelGold Extends Its Decline Below the $4,000 Level
As the chart shows, the XAU/USD quote has fallen below $3,945 today — its lowest level since 6 October. The downward momentum is being driven by traders’ caution ahead of two key events:
→ the U.S. Federal Reserve’s upcoming interest rate decision;
→ the meeting between U.S. and Chinese leaders, which could help ease tensions between the world’s two largest economies.
Technical Analysis of the XAU/USD Chart
The ascending channel (shown in blue) illustrates gold’s remarkable rally from the 20 August low (point A):
→ throughout September, the median line acted as strong support;
→ the peak at point B coincided with the upper boundary of the channel;
→ the QH line — dividing the upper half into quarters — alternated between resistance and support.
The black lines mark the consolidation zone observed between 21 and 27 October:
→ its lower boundary aligns with the median;
→ the shape resembles a Symmetrical Triangle pattern, which has since been broken to the downside.
The chart highlights the confidence of sellers — bears managed to push prices through the key support area defined by:
→ the psychological $4,000 level;
→ the 0.382 Fibonacci retracement (indicated by the orange arrow).
The next potential target for the ongoing decline lies near the QL line, which coincides with the round-number level of $3,900. However, this may only serve as a temporary barrier before bears attempt to drive the price lower — towards the bottom boundary of the primary channel.
This article represents the opinion of the Companies operating under the FXOpen brand only. It is not to be construed as an offer, solicitation, or recommendation with respect to products and services provided by the Companies operating under the FXOpen brand, nor is it to be considered financial advice.

GOLD 30MIN NEWYORK PERSPECTIVE BACKUP CHART.LONDON /NEWYORK GOLD MARKET SESSION SHOWING ME SOME STRONG BULLISH DISPOSITION but the bullish confirmation hinges on break and close 4030 line chart close of my 4hr candle chart my preferred intraday time frame for deep analysis and trade directional bias in real time
if they break 4030, i will watch 15 min chart of the 4070-4055 zone for possible sell reaction price action, like I did in the yesterday sniper buy at 3885-3890 for reference which was posted for free.
the 4HR structure is my litmus test and guide in bullish continuation or bearish take profit.
if 4030 on timing 12;00 drops then i will hope that 4003-4006 demand keeps the bullish impetus so we can ride into 4150 wave ..
the FOMC RATE AND MEETING WILL BE VOLATILE .
GOLD IS 100% BULLISH AND IN THE HANDS OF CENTRAL BANKS.
GOODLUCK
#GOLD #XAUUSD #DOLLAR #DXY #US10Y

GOLD Under Pressure! SELL!
My dear subscribers,
My technical analysis for GOLD is below:
The price is coiling around a solid key level - 4023.4
Bias - Bearish
Technical Indicators: Pivot Points High anticipates a potential price reversal.
Super trend shows a clear sell, giving a perfect indicators' convergence.
Goal - 3987.3
My Stop Loss - 4041.7
About Used Indicators:
By the very nature of the supertrend indicator, it offers firm support and resistance levels for traders to enter and exit trades. Additionally, it also provides signals for setting stop losses
Disclosure: I am part of Trade Nation's Influencer program and receive a monthly fee for using their TradingView charts in my analysis.
———————————
WISH YOU ALL LUCK

Gold Has Entered the Fifth Wave — A Drop Below 3800 Is PossibleGold continued its Wave-4 rebound today, but following a news catalyst, Wave-5 downward momentum began, and the market structure has become clearer. In such conditions, what traders need most is patience.
From the daily chart perspective, there still appears to be room for further downside. Based on my expectation, this decline may break below 3800. Of course, the market is always changing, and our outlook is based on probabilities — no one can guarantee the market will move exactly as expected. However, recent price action has been largely in line with our forecast, and I believe many of you have already secured profits from this move — that’s what matters.
Additionally, I will be traveling tomorrow and won’t be able to monitor the market in real time. So during your trades, please stay alert and prioritize risk control. Protect your capital first — profits will come naturally afterward. The market never lacks opportunities, so don’t sacrifice long-term stability for short-term gains.
Stay calm, stay disciplined, and trade safely!

GOLD HIGH PROBABILITY SETUPS SOON!!!🚨 XAUUSD HIGH PROBABILITY BUY SETUP 🚨
* Here We Can See Clearly The Next Potential Moves For GOLD Coming Hours/Days.
* Keep Your Eyes Close On Your Trading Positions.
* Happy PIP Hunting Traders.
FXKILLA.
