Gold Likely to Rise FurtherPEPPERSTONE:XAUUSD is demonstrating a well-structured movement within an ascending channel, where each price bounce is well-controlled, and every retracement follows a consistent pattern. The strength of the buyers is becoming increasingly evident, with technical dynamics becoming more organized and fluid.
After breaking through a key resistance level, the price is now retesting this level. If this level holds as solid support, the market is likely to continue its bullish momentum towards 4,500, which serves as the natural target aligned with the upper boundary of the ascending channel.
As long as the price remains above this support level, the upward trend will continue. However, if the price fails to hold and drops below this level, the trend structure will be at risk, and the likelihood of a technical correction towards the lower boundary of the channel will increase.
In this well-organized market condition, consistency and discipline in analysis are crucial. Carefully identify key points, wait for strong confirmation, and allow the trend to move in the predetermined direction.
Trade ideas

Gold Testing 4,210 Support as Bulls Eye Another Leg HigherHey Traders, in today’s session we’re keeping a close watch on XAUUSD for a potential buying opportunity around the 4,210 zone. Gold continues to trade within a broader uptrend, and the current pullback appears to be a healthy correction toward a key support and resistance confluence at 4,210.
Market structure:
Momentum remains bullish, with price forming higher highs and higher lows. The ongoing correction could provide a trend-continuation entry if buyers step in near support.
Key level:
4,210 — a decisive zone where previous reactions have sparked renewed buying interest.
Outlook:
A sustained bid from this area could pave the way for another push toward 4,300 and beyond, keeping Gold aligned with its dominant bullish trajectory.
Trade safe,
Joe.

Gold price accumulation - sideways range⭐️GOLDEN INFORMATION:
Gold (XAU/USD) starts the week slightly lower but holds above Friday’s low during the Asian session. Easing US-China trade tensions lift risk appetite and weigh on the safe-haven metal, as reflected in stronger global equities. Still, dovish Fed expectations and a softer US Dollar help limit further losses.
⭐️Personal comments NOVA:
The US and ASEAN weekend tariff policy has a negative impact on gold prices, mainly accumulating buying power waiting for interest rate cuts.
⭐️SET UP GOLD PRICE:
🔥SELL GOLD zone: 4236 - 4238 SL 4243
TP1: $4220
TP2: $4200
TP3: $4185
🔥BUY GOLD zone: 3987 - 3985 SL 3980
TP1: $3998
TP2: $4010
TP3: $4030
⭐️Technical analysis:
Based on technical indicators EMA 34, EMA89 and support resistance areas to set up a reasonable SELL order.
⭐️NOTE:
Note: Nova wishes traders to manage their capital well
- take the number of lots that match your capital
- Takeprofit equal to 4-6% of capital account
- Stoplose equal to 2-3% of capital account

XAUUSD- Is the Correction Really Over?Yesterday, after revisiting the 4,000 support zone as expected and explained in my previous analysis, Gold bounced strongly and tested the area above 4,100.
That rally delivered around 800 pips profit on my long trade, and now the market is showing a mild pullback, consolidating around 4,085.
The key question now:
Is the overall correction over, or is there still more to unfold?
From a technical perspective, as long as 4,000 remains intact, Gold retains its bullish potential toward the 4,200 resistance zone.
However, I prefer to stay patient at the moment — being flat at the time of writing — and will wait for a potential dip toward 4,050 or slightly below.
If the price shows a positive reaction in that area, I’ll consider re-entering long positions.
Upside targets:
• First: 4,150
• Second: 4,200
Keeping a positive risk-reward balance remains the main priority.

Gold ready for retest ath 4380Gold (XAU/USD) showing bullish reaction from the support trendline. The circled candle indicates buyer strength, suggesting a possible recovery toward 4279–4380 resistance levels.
Support Trend Line:
Shows long-term bullish structure — price respecting the ascending trendline.
Support Zone (4181 – 4253):
Key demand area where buyers are stepping in to defend the trend.
4279 Level:
Immediate resistance; a breakout above could confirm short-term bullish momentum.
4313 Level:
Next resistance target after 4279; possible area for partial profit-taking.
4380 Level (ATH Retest):
Major resistance zone — potential final target if bullish move continues.
Indicates buyer reaction at the trendline, signaling possible reversal toward 4279.

XAU/USD (GOLD) Inverse Head & Shoulder Pattern Bullish Analysis📈 #XAUUSD (Gold) Technical Update 💰✨
Bullish momentum building on the 1H timeframe with an Inverse Head & Shoulders breakout above the 4115 neckline! 🚀
🎯Breakout Level: 4115
💪Pattern: Inverse H&S — bullish continuation
Technical Targets:
TP1, 4156
TP2, 4202
TP3, 4375
As long as price holds above 4115, bias remains bullish 🟢
Keep an eye on volume confirmation and potential retest zones before the next leg up! 🔍
#Gold #XAUUSD #Forex #TechnicalAnalysis #PriceAction #Trading

GOLD 1H CHART ROUTE MAP UPDATE & TRADING PLAN FOR THE WEEKHey Everyone,
Please see our updated 1h chart levels and targets for the coming week.
We are seeing price play between two weighted levels with a gap above at 4275 and a gap below at 4229. We will need to see ema5 cross and lock on either weighted level to determine the next range.
We will see levels tested side by side until one of the weighted levels break and lock to confirm direction for the next range.
We will keep the above in mind when taking buys from dips. Our updated levels and weighted levels will allow us to track the movement down and then catch bounces up.
We will continue to buy dips using our support levels taking 20 to 40 pips. As stated before each of our level structures give 20 to 40 pip bounces, which is enough for a nice entry and exit. If you back test the levels we shared every week for the past 24 months, you can see how effectively they were used to trade with or against short/mid term swings and trends.
The swing range give bigger bounces then our weighted levels that's the difference between weighted levels and swing ranges.
BULLISH TARGET
275
EMA5 CROSS AND LOCK ABOVE 4275 WILL OPEN THE FOLLOWING BULLISH TARGETS
4320
EMA5 CROSS AND LOCK ABOVE 4320 WILL OPEN THE FOLLOWING BULLISH TARGET
4360
BEARISH TARGETS
4229
EMA5 CROSS AND LOCK BELOW 4229 WILL OPEN THE FOLLOWING BEARISH TARGET
4194
EMA5 CROSS AND LOCK BELOW 4194 WILL OPEN THE FOLLOWING BEARISH TARGET
4151
EMA5 CROSS AND LOCK BELOW 4151 WILL OPEN THE SWING RANGE
4122
4075
EMA5 CROSS AND LOCK BELOW 4075 WILL OPEN THE SECONDAARY SWING RANGE
4022
3955
As always, we will keep you all updated with regular updates throughout the week and how we manage the active ideas and setups. Thank you all for your likes, comments and follows, we really appreciate it!
Mr Gold
GoldViewFX

GOLD at Cut n reverse region? What's next??#GOLD... market perfectly place a low in region.
That is our most important region and our key region for next move.
Keep close and if market holds then buying expected otherwise not at all.
I repeat it again that is full n final region..
NOTE: we will go for cut n reverse below region on confirmation.
Good luck
Trade wisley

Hellena | GOLD (4H): LONG to 61.8% Fibo of 4265.Dear colleagues, in the new forecast the idea remains the same - the upward momentum (12345) is not yet complete.
At the moment I see the end of the formation of the corrective wave “4” at the level of 4000, as stated earlier, and the beginning of the upward movement in wave “5”.
I do not want to set distant targets, because their achievement may take time, so let's start small - the nearest target is the resistance area at 4265 - the area beyond the 61.8% level of wave “4”. I think that this is the nearest target that we should expect.
Fundamental context
Earlier this week, gold experienced a sharp pull-back after its recent record highs. Nothing to panic about — it’s simply a technical correction: investors are taking profits after a rapid and extended rally. Key drivers like central bank buying and lower rate expectations remain intact, so the broader bullish story is still alive. In fact, this brief dip may offer a better entry point before the next leg up.
Manage your capital correctly and competently! Only enter trades based on reliable patterns!

THE KOG REPORT - UpdateEnd of day update from us here at KOG:
Simple one this evening. Yesterday we wanted to see which way it broke, the red boxes activated, the short hit target, we then got the TAP AND BOUNCE, red box activated with the hot spot and Excalibur, and BOOM! RIP And FLIP.
Now, support below at the 3930 level with resistance 3955 could be the play but the close here is important! The pull back here is huge, all the way up to the level of 4050 which needs to break to change the structure, otherwise, more downside is on the horizon.
From Camelot this morning:
Red boxes:
Break above 3909 for 3920✅ and 3933✅ in extension of the move
Break below 3890 for 3865, 3955 and 3848 in extension of the move
As always, trade safe.
KOG

Hellena | GOLD (4H): SHORT to support area of 4040.Gold is actively rising and I believe that before the impulse ends we should see the correction that many are expecting.
As of today, I see the completion of the higher order wave “3” and the approaching start of the correction in wave “4”. It makes no sense to put any distant plans in the correction and I think that the support area of 4040 looks quite attractive.
Fundamental context
Gold continues its rally and recently broke new highs, fueled by expectations of U.S. rate cuts, global uncertainty, and safe-haven demand. Central banks are still actively increasing their gold reserves — this structural demand adds support even if price pullbacks occur.
Supply growth is modest — mining output is constrained, and recycling of gold is not enough, which limits the downward pressure on prices.
Given this backdrop, the chance of a correction rises as momentum stretches — but the underlying fundamentals remain favorable for further upside once the correction completes.
Manage your capital correctly and competently! Only enter trades based on reliable patterns!

GOLD ANALYSIS (1 W)To understand the psychology in Gold,
I use only two tools:
Fibonacci retracement,
Trend-based Fibonacci extension.
We will use these two tools to measure the weekly cycles.
Since November 2022, Gold has been forming a pattern that can only be explained by Fibonacci principles.
Using Fibonacci retracement for each swing high and low, you'll realize that each retracement equals around 50%.
In only one example, we see that a higher low reaches the 61.8% level, which is also acceptable.
After these retracements, the next leg of the impulsive move always reaches around the 1.618 Fibonacci extension.
According to these two basic technical factors, Gold should first reach around $3,800, and then aim for the $6,600 level during the next impulsive leg in the coming years.
I’m not even going to list all the reasons why Gold tends to go up over time.
Most people reading this analysis are already aware of the fundamentals behind Gold’s long-term bullish nature.
Thanks for reading.

GOLDThe era of cheap gold ends
From 1919 to 2015, the price of gold due to Gold Fixing. The price was set by London Gold Market Fixing Limited. On March 20, 2015 fixing ceased to be installed according to the old methodology and was replaced by electronic auctions LBMA Gold Price.
Initially, the "golden five" consisted of the following companies
1.N M Rothschild & Sons
2.Mocatta & Goldsmid
3.Pixley & Abell
4.Samuel Montagu & Co
5.Sharps Wilkins
What now?
Thirteen market participants are accredited to participate in LBMA Gold Price trading:
Bank of China
Bank of Communications
China Construction Bank
Goldman Sachs International
HSBC Bank USA NA
ICBC Standard Bank
JPMorgan Chase
Morgan Stanley
Société Générale
Standard Chartered
The Bank of Nova Scotia - ScotiaMocatta
The Toronto Dominion Bank
UBS
These banks all belong to the same families.
Most of the gold has already been bought and there is no point in keeping it at this level.
In a period of instability, investors will seek refuge for their assets. And gold will not be a bad refuge for long term.
WE WILL BE GOLD BEFORE THE PORN, WHILE GOLDEN IDEOLOGISTS WILL EXIST . Rothschild's

Gold/Copper Signaling Recession & Market Super bubble!We're continuing to see extreme signals from Gold, and that should raise concerns.
Earlier, I highlighted the Gold/Oil ratio — now, I want to draw your attention to the Gold/Copper ratio:
🔗
Historically, such extreme readings in the Gold/Copper ratio have consistently preceded recessions. The only exception? A period of economic stagnation and sideways markets — not exactly a bullish outcome. See the chart from 2014 to 2016
🔗 www.tradingview.com
Quick recap:
Gold = Fear + Inflation hedge
Copper = Economic strength + Inflation signal
Oil = Similar to Copper; reflects growth and inflation expectations
These divergences aren't random — they’re warning signs of a recession & market Super Bubble that's about to POP!
These are not random fluctuations of prices. You can choose to view them as such. I get it. But from a macroeconomic perspective, this is bad JUJU!
Capitalism without failure is like religion without hell! Remember that!
Click boost, like, and subscribe! Let's get to 5,000 followers! ))

Gold Breakdown Alert! Bears Aiming $3980 NextGold is currently showing a descending triangle / bearish channel pattern on the 15-minute chart. After testing the upper trendline resistance around 4113–4115, price has started to reject, indicating potential downward pressure.
The trendlines show clear lower highs and lower lows, confirming a short-term bearish structure. Volume is also decreasing on upward moves, suggesting weakening buying momentum.
📉 Trade Setup (Scalping / Intraday)
Signal: 🔻 SELL XAU/USD below 4105
Entry Zone: 4105 – 4110
Target 1: 4050
Target 2: 3980
Stop Loss: 4135
Risk/Reward Ratio: ~1:2
⚙️ Technical Indicators
Trendline Resistance: 4115
Support Zone: 4050 / 3980
Momentum: Bearish bias
Structure: Lower highs forming under descending resistance
💬 Analyst View
Gold may continue its short-term correction phase if it fails to hold above the 4110 resistance zone. A breakout below 4100 could trigger a fresh wave of selling pressure targeting the 4050 area initially.
If bulls reclaim 4135, this analysis becomes invalid and could shift bias to neutral.

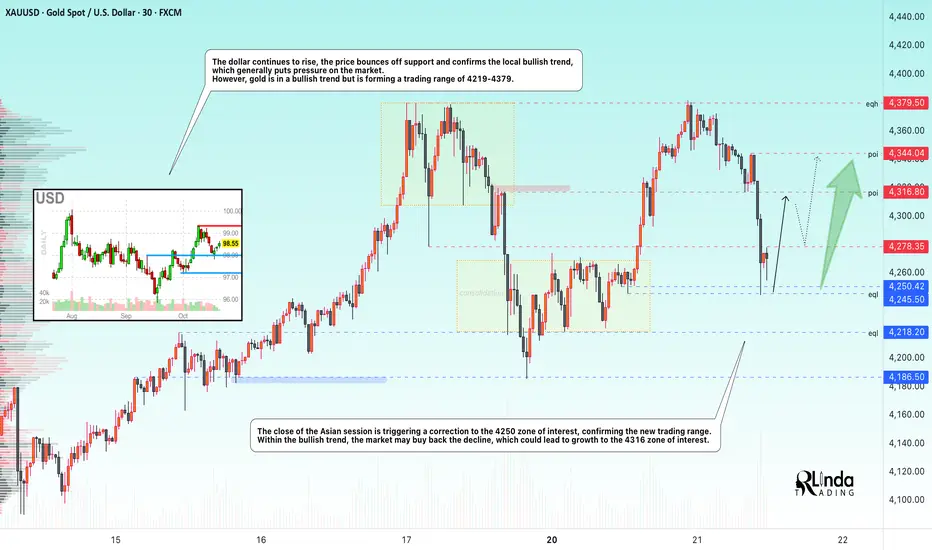
GOLD → The correction forms a trading range. Growth?FX:XAUUSD is adjusting to $4250 after retesting the all-time high of 4380. Short-term pressure is linked to hopes for an easing of the trade war between the US and China, but the bullish trend remains intact.
Key factors: Bentsen's meeting with the Chinese Vice Premier this week has revived optimism for a deal. The reduction in trade risks is temporarily supporting the USD. Hassett's statements about the imminent resumption of government work have reinforced risk-on sentiment.
Support for gold: The threat of tariffs rising to 155% from November 1 reminds us of the risks. Two rate cuts before the end of the year remain in focus. Friday's inflation data release and US corporate earnings reports are keeping demand for hedging alive.
Accordingly, the correction in gold is a temporary pause. The uptrend will remain unchanged as long as macro uncertainty persists.
Support levels: 4250, 4218
Resistance levels: 4278, 4316
Within the bullish trend, the price is forming a trading range. A retest of support could end in a recovery, with the fundamental background favoring the bulls. A retest of 4245 could trigger growth, as could a breakout of 4278 (closing above resistance).
Best regards, R. Linda!
Gold prices begin to recover, big fluctuations⭐️GOLDEN INFORMATION:
Gold (XAU/USD) drops below $4,100 in Wednesday’s Asian session, extending its sharpest selloff in over a decade as traders lock in profits after a nine-week record-breaking rally. Easing US-China trade tensions ahead of the November 1 tariff deadline further dampen safe-haven demand.
⭐️Personal comments NOVA:
Currently, the gold price fluctuates greatly and moves quickly. There are signs of recovery and retreat to the resistance zone around 4235.
⭐️SET UP GOLD PRICE:
🔥SELL GOLD zone: 4235 - 4237 SL 4242
TP1: $4222
TP2: $4200
TP3: $4170
⭐️Technical analysis:
Based on technical indicators EMA 34, EMA89 and support resistance areas to set up a reasonable SELL order.
⭐️NOTE:
Note: Nova wishes traders to manage their capital well
- take the number of lots that match your capital
- Takeprofit equal to 4-6% of capital account
- Stoplose equal to 2-3% of capital account

XAUUSD | Correction of the Corrective ImpulseThe Market Flow | Oct 26, 2025
Technical Overview
Monthly/Weekly:
• Both remain in structural expansion phases following a strong higher-timeframe impulse.
• Bias continues long above prior pivots, maintaining bullish structure despite current mid-term correction.
Daily:
• Broke the previous valley (daily pivot) and reached the daily breakout zone at 4040.20 .
• This defines the ongoing corrective impulse against the dominant bullish trend.
• Price is attempting to correct that impulse, forming a counter-correction structure beneath resistance.
H4/H1:
• Local wave structure is consolidating after a multi-leg retracement.
• The corrective move remains contained between the H4 pivot 4060.68 and EXP 4129.14 .
• The green EXP level at 4129.14 represents a clean, untested M15 breakdown —the active long trigger .
• Targets align with H1 Fibonacci 138.2–161.8% and the correction 61.8% retracement zone near 4204–4246 .
• Momentum fading below the EXP would imply continuation within the corrective leg.
Trade Structure & Levels
• Bias: Long above 4060.68
• Trigger = Break and sustained hold above 4129.14 (M15 EXP)
• Primary Invalidation = 4060.68 (H4 pivot)
• Secondary Invalidation = 4054.68 (H1 pivot)
• Path → 4129 → 4204 → 4239 → 4246
• Phase: Counter-corrective advance within a higher-timeframe expansion
Risk & Event Context
• Low probability structure as it represents a correction of the corrective impulse.
• Watch intraday reactions at the M15 expansion level—failure to confirm beyond it keeps bias neutral.
• Volatility expected around USD macro data.
Conclusion
XAUUSD is attempting a minor counter-correction within a broader corrective phase. The M15 expansion level at 4129.14 is the structural trigger for continuation toward 4204–4246, but the move remains fragile as long as price trades below the daily breakout pivot.
Disclaimer
This analysis is for informational purposes only and does not constitute investment advice, an offer, or a recommendation. Market conditions and price behavior may change without notice. Past performance is not indicative of future results. Always conduct your own research or consult a licensed financial advisor before making investment decisions.

XAUUSD: Correction Within Uptrend – Demand Zone in FocusHello, traders! The gold market (XAUUSD) continues to demonstrate strong bullish momentum within a clearly defined uptrend structure that has been developing for several weeks. The movement is characterized by a sequence of higher highs and higher lows, supported by a well-respected ascending trend line. Throughout this upward phase, we’ve observed multiple breakouts from short-term consolidation zones and corrections — each confirming the dominance of buyers. These breakouts, marked on the chart, acted as continuation signals that pushed price toward new local highs.
Currently, after reaching the 4,360.00 area, gold entered a corrective phase, forming a short-term retracement. This pullback brought the price back to the previously broken trend line and into the Demand Zone 2 (4,200–4,250) — an area that has repeatedly served as strong support for the market.
My scenario for the development, if sellers manage to push the price below the 4,200.00 level, the structure will temporarily weaken, and we may see a deeper correction toward the next Demand Zone 2 (4,100–3,950). This zone would then act as a potential re-accumulation area before buyers could regain control. At the same time, Demand Zone 1, located higher, continues to confirm the overall bullish context — showing that gold maintains its medium-term uptrend despite the current short-term correction. Manage your risk!

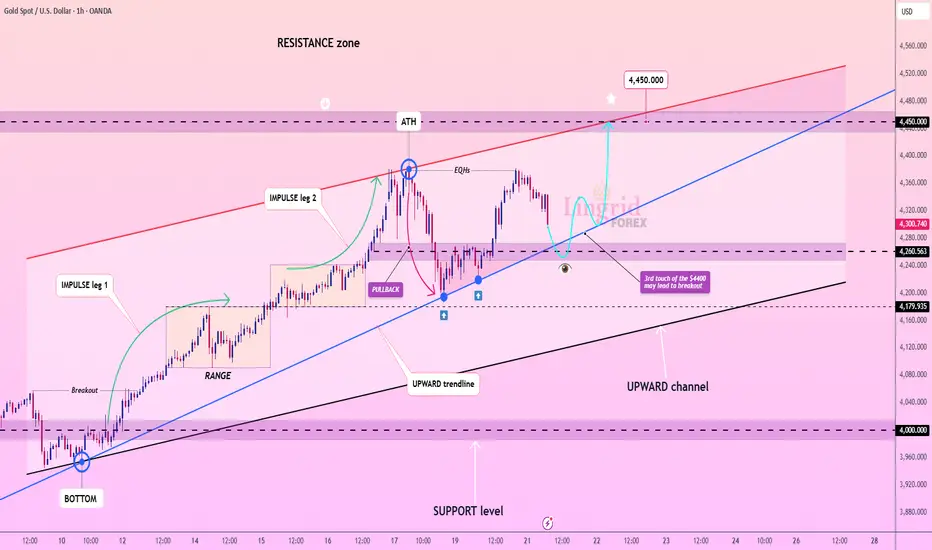
Lingrid | GOLD Trend Continuation Pattern FormingOANDA:XAUUSD is maintaining its bullish structure within an upward channel, where the price continues to create impulsive legs followed by controlled pullbacks. The third touch of the $4,380 resistance area suggests an increasing probability of a breakout continuation toward $4,450. As long as the $4,250–$4,270 support region holds, buyers remain in control of the broader trend. Momentum remains constructive, supported by higher lows and consistent rebounds from the trendline base.
⚠️ Risks:
Failure to hold $4,240 could invalidate the bullish setup.
Strong CPI data may cap gold’s upside.
A sudden drop in inflation expectations could weaken safe-haven demand.
If this idea resonates with you or you have your own opinion, traders, hit the comments. I’m excited to read your thoughts!
( HANZO Gold Protocol ) Bullish Reversal DetectedStatus: Active Reversal Protocol
Symbol: Gold
Session: London–New York Overlap (Smart Exit Window)
➕Bias: Bullish Reversal
Goal: Controlled with minimal drawdown
Tactical Edge: Reversal Protocol through liquidity engineering
Confidence Level: ★★★★★ (Smart Money Aligned)
☄️4270 Bullish Reversal Zone — Full Breakdown
1️⃣ Fixed Range HVN Alignment
The 4270 level aligns perfectly with the High Volume Node from the previous accumulation phase — a sign of institutional absorption where orders were heavily exchanged before breakout.
2️⃣ Volume Gap Above, Density Below
Below 4270 we have heavy volume clusters, while above it the profile becomes thin — confirming that 4270 is the last defended zone before liquidity imbalance.
3️⃣ Liquidity Trap Confirmation
The sharp push below 4300 earlier collected stop-loss liquidity, making 4270 the smart money re-entry zone after clearing out retail buyers.
4️⃣ Fibonacci Alignment (0.382–0.5 Zone)
4270 sits inside the 38.2% retracement of the impulsive move, which is a premium re-entry level used by institutional models.
5️⃣ Structural Confluence (Old Resistance → Support)
Previous breakout base and trend compression aligned with 4270 mark it as a flip zone — the structural confirmation of a reversal block.
6️⃣ Delta HQ Reversal Indicator
At the base of the move (near 4270) the Delta HQ showed negative absorption turning neutral, meaning sell volume failed to push price lower — a key reversal trigger.
7️⃣ Session Logic
The level coincides with the post-10:30 session retest window (smart money re-entry timing), fitting your 10:30–10:30 volume cycle.
8️⃣ Trap Zone Above (Liquidity Vacuum)
The upper “Trap Zone” confirms that price already engineered liquidity above, freeing up path for bullish continuation from 4270 upward.
9️⃣ Internal Trendline Compression Break
The descending pattern leading into 4270 forms a bullish breakout wedge — clear compression followed by volume breakout.
🔟 Institutional Behavior Evidence
Sharp imbalance candle after 4270 test shows controlled accumulation — classic smart money re-entry behavior before next expansion.
🎯 Summary (Hanzo Logic)
4270 = Delta Reversal + HVN Defense + Liquidity Reset + Fib Precision
A high-confidence engineered re-entry zone built by smart money to refill positions before bullish continuation.
GOLD Has buyers area at 4000 demand zone buy possible from that🚀 GOLD BULLISH OUTLOOK (1H Timeframe) 🏆
📉 Price showing strong demand zone support around 4000 — buyers stepping in with momentum!
💰 Buying Opportunity: 4000 zone
🎯 Technical Targets:
1️⃣ 4074
2️⃣ 4156
📊 Structure remains bullish as long as price holds above 4000 zone. Watch for confirmation candles before entry ✅
#Gold #XAUUSD #PriceAction #TechnicalAnalysis #TradingSetup #BullishMomentum

XAU/USD Intraday Plan | Support & Resistance to WatchGold is trading around 4121, consolidating after a modest recovery from the 4075 support zone. Price is currently caught between the MA50 and MA200, showing signs of indecision as buyers and sellers battle for short-term control.
While the broader uptrend remains structurally intact, short-term momentum is still bearish to neutral, with gold struggling to close above the 4151 resistance. A decisive break above 4151 could pave the way for a corrective rally toward 4192 and 4227, where the MA200 may act as dynamic resistance.
On the downside, if gold fails to hold above 4117, another retest of 4075 is likely. A clean break below this level could extend weakness into 4020, with 3984–3953 marking the deeper support base where dip-buyers are expected to become active again.
📌 Key levels to watch:
Resistance:
4151
4192
4227
4279
Support:
4117
4075
4044
4020
3984
🔎 Fundamental focus:
Even though gold is under short-term pressure, the overall trend is still healthy. Uncertainty in the global economy continues to support gold, and many traders see price drops toward key support levels as good buying opportunities.
