XAUUSD: Double-Top Breakdown Targets $3,928 Amid USD StrengthXAUUSD 4H Bearish
**Quick Analysis**
- 3rd test & reject at $4,000 (psych + 1.618 Fib)
- Double-top neckline broken @ $3,985 → $3,928 target
- RSI 72 divergence + bearish engulfing under 200EMA
**Fundamentals**
- FOMC signals 2 cuts in 2026 → DXY 108.50
- Ceasefire + Trump tariffs crush safe-haven bid
- COT: specs max long → squeeze incoming
**Trade**
SELL LIMIT $3,995–$4,005
SL $4,018 | TP $3,928 (1:4 RR)
Risk 1% | BE +25 pips
Trade ideas

Gold struggles below $4KI think it is fair to say that the $4K level is super important in as far as gold’s short-term direction is concerned. A potential breakdown below $3930 would signal gold has decided to stay below this $4K level. The $3930 level is where gold found support from earlier this week, so a break below it would now be quite significant from a technical standpoint. On the upside, $4045 is where gold needs to climb above to trigger technical selling above it. This was the high from last Friday. While gold decides which direction to break, I don’t have too strong a view on the metal currently. Granted, the fresh weakening of the US dollar amid signs of weakness in labour market as reported by Challenger yesterday, and the drop in consumer confidence as reported by the UoM today, both point to potential gains for gold. However, the metal has been trending in the same direction as equity markets. Therein lies the problem. With stocks struggling, gold has been unable to find any fresh haven demand to give it a lift above $4K.
By Fawad Razaqzada, market analyst with FOREX.com

XAUUSD- Bullish setupGold is showing early signs of a bullish reversal after finding support around the lower green band and reclaiming the short-term trend zone. Price has broken above the descending structure with increasing momentum, suggesting potential continuation to the upside.
Bullish Confluences:
Bounce from lower volatility band support (oversold zone).
Break above local trend resistance and EMA ribbon.
Higher lows forming, showing renewed buying pressure.
🎯 Fibonacci Targets:
TP1: 38.2% – $4,049
TP2: 61.8% – $4,075
TP3: 100% – $4,117
As long as price holds above the recent breakout zone (~$3,995–$4,000), bulls remain in control. A clean move through the golden zone could confirm continuation toward higher targets.

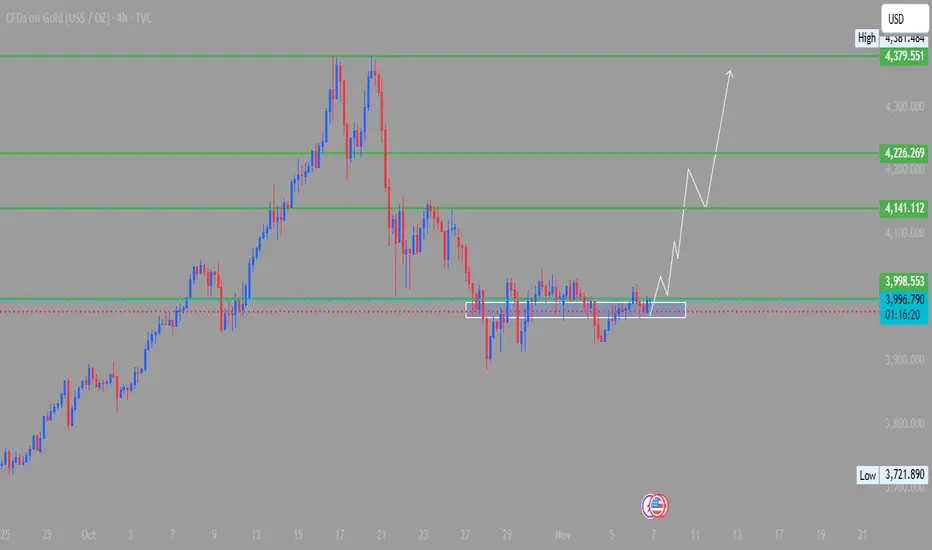
XAUUSD (Gold) — 4H Range Base Building for Breakout Gold (XAUUSD) continues to accumulate above the $3,970–$3,980 demand base, forming a tight range after several rejections from this zone. This consolidation signals potential energy buildup for a bullish breakout toward higher key levels.
Technical Breakdown:
Support Zone: $3,970–$3,980 (Accumulation Range)
Immediate Resistance: $3,998–$4,000 (Range High)
Upside Targets:
$4,141 — Previous structural resistance
$4,226 — Fib extension level
$4,379 — Major high / target zone
Market Structure Insight:
Price has successfully tested and respected the range support multiple times, suggesting a strong accumulation phase within a bullish macro backdrop. As long as Gold holds above $3,970, buyers are expected to regain control and drive toward the $4,200 handle.
Trade Plan:
Bullish bias remains intact above $3,970.
A confirmed 4H close above $4,000 signals momentum shift to the upside.
Target sequence: $4,141 → $4,226 → $4,379
A break below $3,950 would temporarily neutralize the setup.
Bias:
🟢 Bullish continuation while holding above $3,970, targeting breakout extension toward $4,200–$4,380 range.
XAUUSD LongBuy @ 3980
TP 4036
I'm not a story teller, neither i trade on news.
The only story what u should be reading is the chart itself

Gold/Oil Signaling Market Is In A Super Bubble Gold = Fear
Oil = how strong the economy is.
Except for COVID we have never seen such an extreme reading. Yet people are buying up stocks like we will never again be able to produce another stock again as long as we live!
Tulips!
Here are just a few of the factors to consider that make this indicator important.
Why This Indicator Matters: Key Factors at a Glance
Gold’s Surge Signals a Shift
Gold has soared nearly 60% year-to-date, adding a staggering $10 trillion in market capitalization. This rally effectively erases all the stock market gains made since May 2021, including those driven by AI enthusiasm and speculative tech runs.
USD Can Only Be Measured Against Gold
As the world’s reserve currency, the U.S. dollar’s real value is best gauged in terms of gold. This is a critical point—because when gold rises this dramatically, it reflects monetary inflation. A large part of the stock market rally has been driven by an expanding money supply, not true value creation.
Curiously, this inflation hasn’t shown up in oil prices, which have collapsed, despite geopolitical risks. More on that below.
The Dollar’s Worst Year in Decades
2025 marks one of the most significant declines for the U.S. dollar in recent history. Its role as the world reserve currency (WRC) has diminished—from 85% in the 1970s to just 50% today. Trade wars and tariffs are only accelerating this trend.
Monetary Inflation Drives Stock Prices
Stock markets are being lifted by monetary inflation, not organic growth. Stocks can be created endlessly—unlike gold. That makes gold a true inflation benchmark. The stock market’s rise is, in large part, a mirage, reflecting debased currency, not real productivity.
Oil Isn’t Behaving as Expected—Why?
Typically, when the dollar weakens, oil prices rise—because more dollars are needed to buy the same barrel of oil. But right now, oil prices are soft. Why?
Global demand is weak, outpaced by supply. Even the Russia-Ukraine war hasn’t changed that dynamic. In fact, Russia is now importing gasoline, as Ukrainian forces continue to target and disable refining capacity.
Here’s why this matters: when oil wells are opened, they can't just be turned off. If the refiners are destroyed and the oil has nowhere to go—it’s wasted. That’s a strategic win for Ukraine.
The Disconnect Between Stock Prices and Profits
While inflation has pushed stock prices higher, it hasn’t translated into equivalent profit growth.
Example: If a stock goes from $10 to $20 due to inflation, you'd expect earnings to go from $1 to $2 to maintain the same P/E ratio. Instead, the earnings yield is just 3.2%—a historical low. That’s a major red flag.
As pilots would say: WTF, over?
Here’s the likely explanation:
The money hasn’t reached consumers—it's concentrated in the hands of wealthy savers and leveraged investors, who are buying more stocks to sell to the next buyer willing to lever up even more. It’s a classic feedback loop—and a superbubble reminiscent of the tulip mania era.
The Smart Money Knows What's Coming
As this imbalance grows more obvious, central banks and institutional investors are quietly increasing their gold holdings—well above the pace of supply growth.
So when Gold/Oil (two important commodities) completely disconnect like this, and Gold explodes up like this, you'd better take notice!
Lastly, it takes 100 ounces to buy a new home. Last time this occurred was in 1978 ish, 2011, and now!
Debt to GDP in 76 was 33%, 2011 was 99% and today 126% It is not the same animal as the past.
GTFO & STFO! No matter where the prices for stocks go!
CAUTION!!!

Gold Intraday Trading Plan 11/6/2025Although gold dropped to 3930 on Tuesday, yesterday it didn't continue the momentum but rose to 3980. I am switching my view to my weekly prediction. Gold should continue to rise this week. Currently, bull's strength is not strong enough. It will face resistance of 4000. I will buy from 3960. If 4000 is broken, I will have more confidence on hitting 4028 target or even 4050.

SELL XAUUSD (GOLD) - Great trade opportunityGOLD (XAUUSD) has been in a downtrend lately and has been showing many signs of more bearish movements ahead. Gold is currently in a clear downtrend channel shown on the chart, it has also broken a powerful support level and recently broken the yellow trendline which acted as the last support level near the current price. Gold is likely to hit the next support zone which is shown as the take profit level on the chart. Time to sell!

Gold price analysis November 3🟡 XAUUSD – Recovery Signal Forming
Gold prices are showing signs of returning to an uptrend after a short-term correction. The 4026 area is now acting as an important key level – a stable price above this area would be a confirmation signal that buying pressure is returning to the market.
With recent economic data still supporting the gold uptrend, the current priority strategy is to wait for BUYs following the trend. The sellers can only regain control if the price breaks through the support trendline around 3970, then the downtrend can be re-established.
📈 Sample trading plan:
Buy early around: 4000
Buy intensified when the price breaks above: 4026
Expected target: 4150
Risk: The uptrend is negated when the price closes below the 3970 trendline

Today's gold trading strategy1.The technical breakout feature is highly significant, and the risk of a top divergence is imminent. The so-called "breakout trend" currently actually has fatal flaws: Although the London gold price has reached $3990.24, it has not stabilized above the 10-day moving average (4008 USD), and the 30-minute chart has formed a top divergence structure of "new price high + shortened MACD red bar", which is a typical trend reversal signal. More importantly, the increase in trading volume during the breakout has "water" - the highest daily increase was only 0.41%, while the trading volume has shrunk by 22% compared to the peak of the previous trading day, and although the active buy orders accounted for 61%, they were concentrated in the $3980 - $3985 USD range, and the buy volume above $3990 USD dropped sharply, confirming "insufficient willingness to buy at the high price". Historical data shows that when gold does not break through the key moving average, a top divergence occurs, and the probability of a 24-hour subsequent decline is 81%, with an average decline of over 1.2%.
2.Institutional funds have hidden differences, and the sustainability of ETF's increase in holdings is questionable. The "institutional increase in holdings" logic that is overly dependent on it has obvious flaws: The latest addition to SPDR gold ETF holdings data was on November 4th (increased by 2.58 tons), and there has been no new increase in holdings record since November 5th. Moreover, the main contract position of New York gold futures shows that the long position only increased slightly by 0.3%, while the short position increased by 1.8%, the ratio of long to short positions dropped from 1.2:1 to 1.17:1, and the institutional differences have already emerged. What is more alarming is that the gold sector index has been in a 3-day correction, with a single-day decline of 4.06% on November 4th, and the trading volume has also shrunk simultaneously, indicating that the precious metal funds in the stock market are accelerating their withdrawal, and this "cross-market capital flight" often precedes the decline in the spot market.
Today's gold trading strategy
sell:3985~3995
tp:3975~3965
sl:4005

XAUUSD - Time to buy...XAUUSD was in a short term downtrend for a few weeks but has now shown some clear bullish movements ahead. XAUUSD (Gold) has broken out of a downward trend channel that was acting as strong resistance, The price is very likely to head to the next resistance level which is market as the take profit zone (green line). Time to buy!

XAUUSD/GOLD 1H BUY PROJECTION 03.11.25🟩 Technical Summary:
Structure: Price has broken out of a 1H downtrend line, signaling a potential bullish reversal.
Pattern Confirmation: A Bullish Engulfing candle confirms buying momentum.
Zones Marked:
Resistance R1: Around 4,020 zone
Resistance R2: Around 4,030–4,035 zone
4H Target Price: ~4,075–4,080 zone
Support Zone: Near 3,995–4,000 (Stoploss area).
📈 Projection Logic:
Price breaks 1H downtrend.
Retests near the trendline breakout zone (~4,000–4,010).
Pushes towards R1 and R2.
Final 4H target projected near 4,075–4,080.
🎯 Buy Setup Example:
Buy Entry: 4,005 – 4,010 (after retest)
Stoploss: 3,985 – 3,990
Target: 4,075 – 4,080
Risk–Reward: Roughly 1:3+

Daily live trade with XAUUSD in 15m/30m/1h 20251106Daily live trade with XAUUSD in 15m/30m/1h 20251106

XAUUSD: Buy ideaBuy idea on XAUUSD as you can see on the chart because we have the breakout of the resistance line and also the breakout of the vwap indicator.

XAUUSD: Market Analysis and Strategy for November 5thGold Technical Analysis:
Daily Resistance: 4080, Support: 3890.
4-Hour Resistance: 4035, Support: 3930.
1-Hour Resistance: 4000, Support: 3960.
The bullish outlook over the long term remains intact, but market correction and consolidation are warranted. The daily candlestick chart shows a slowing decline in spot gold, with the price entering a range-bound consolidation. Multiple moving averages above are hindering any short-term rebound. Watch for MACD/KDJ indicator corrections. Resistance levels to watch are around 4000 and 4030 respectively. The short-term downside risk is relatively high.
Based on the 1-hour candlestick chart, spot gold is in a rebound phase with a potential for continuation. The bottom on the 1-hour chart is gradually moving upwards, the trading range is narrowing, and the Bollinger Bands are converging. Support levels to watch are around 3955/3945. Short-term market momentum is weak; a strategy of buying low and selling high is recommended.
Trading Strategy:
SELL: 3993~4000 (near)
BUY: 3945~3940 (near)

XAUUSD M30 TIME FRAME CHART ANALYSIS CONFIRMED TARGET I'm going to SELL now long Short entry 4026
Take profit 4000
Take profit 3980
Target 3964
Stop loss 4044
Are you agree 🔥

November 3, 2025 - XAUUSD Analysis and Potential Opportunity📊 Analysis:
From the chart, bearish momentum hasn’t completely disappeared, and bullish strength hasn’t yet emerged, suggesting that the market may enter a range-bound phase.
I expect the price to consolidate between 3991 and 4010 — within this range, sell near the top and buy near the bottom.
Watch for a clear breakout:
If price breaks above 4010, consider buying pullbacks into support.
If price breaks below 3991, look to sell rallies into resistance.
A quick reminder: the zone between 4010–4045 lacks clear higher-timeframe levels, but there are many minor levels within it.
Conservative traders may prefer to wait until price exits this zone.
Aggressive traders can try light positions near short-term levels — with strict stop losses and small size.
🔍 Key Levels to Watch:
• 4065 – Resistance
• 4050–4058 – Resistance zone
• 4045 – Resistance
• 4020–4030 – Resistance zone
• 4010 – Upper boundary of range / resistance
• 4000 – Psychological level
• 3991 – Lower boundary of range / support
• 3971–3980 – Support zone
• 3960 – Key support
• 3947 – Support
📈 Intraday Strategy:
SELL: If price breaks below 3991 → target 3987, with further downside toward 3984, 3980, 3975
BUY: If price holds above 4010 → target 4015, with further upside toward 4020, 4025, 4030


GOLD BIG FALLPreferably suitable for scalping and accurate as long as you watch carefully the price action with the drawn areas.
With your likes and comments, you give me enough energy to provide the best analysis on an ongoing basis.
And if you needed any analysis that was not on the page, you can ask me with a comment or a personal message.
Enjoy Trading ;)

Gold trapping both Buyers and SellersTechnical analysis: As I announced possible Selling correction on Gold however Short and Medium-term remains Bullish, Price-action has recovered half of the opening losses on the E.U. session opening as DX was taking big Daily candle hit. However the rise is still not proportional as Bond Yields and global futures are still on Lower levels. This leads me to believe that on the Short-term, there is a stronger connection of Gold to DX, rather than Bond Yields, so I will keep an eye for pressure zones on DX. Technically the Daily chart was isolated within broken / former Descending Channel on it’s Lower High’s, as Resistance has to break since last couple occasions it provided rejection twice (#4,027.80). I am expecting strong move to take place throughout next week. Despite the Bullish Fundamental outcome on announcements last week, Gold continues to Trade near the #2-Week High’s. This indicates that last week's aggressive Buy-off on DX was largely a pre-pricing of those Fed Rate numbers. What's obvious, as the current week will come to a close, is that the consolidation since Friday’s session is just above the Daily chart’s Support Zone (#3,964.80 - #3,977.80) which lifts the probabilities for an aggressive Buying sequence ahead, especially as Weekly chart (#1W) remains marginally Bullish.
My position: I have Traded Scalp orders mostly throughout yesterday’s session Buying #4,005.80 on multiple occasions towards #4,015.80 and #3,992.80 aggressively towards #4,000.80 benchmark. I have Bought #3,964.80 as well as I maintain Buying every dips strategy. I have accumulated enough Profits this week and will not Trade today, comfortably taking early weekend break

GOLD BUY TO 4,019....Used the 5min charts on this setup we have a price rejections off the measure zone at my poi after my inducements am looking forward to see price arrive at 4,019 while maintaining my stops at 3,990.....

XAUUSD: Daily OTE & CRT Setup - Targeting the DrawdownTimeframe: Daily (1D) Chart Analysis: Smart Money Concepts (SMC) / ICT
Gold (XAUUSD) is setting up a high-probability move as it consolidates beneath the recent Daily OTE High. The daily candle is painting a potential CRT Manipulation phase before a distribution down to clear liquidity.
The Setup: Targeting the CRT Drawdown
Current Range (CRT): Price is currently held within the range of the last major daily candle, suggesting Accumulation/Distribution is in progress.
OTE High Resistance: The overhead resistance at $3,991.82 (OTE High) is critical. A potential short-term sweep above this level (the Manipulation phase of CRT) could occur to grab liquidity before the main move.
The Liquidity Target: The projected path indicates a clear run to the Daily OTE Major Low at $3,929.78. This level is a major magnet for liquidity and represents an excellent area for the next Accumulation phase and a potential long entry.
🎯 Trade Plan:
Bearish Bias: Favor a move down toward the $3,929.78 zone.
High-Probability Entry: Wait for price to enter the lower OTE zone at $3,929.78 and look for a lower-timeframe Market Structure Shift (MSS) or bullish Displacement for a long entry confirmation.
The path of least resistance is lower to mitigate the recent Daily high and collect the sell-side liquidity.
Greetings,
MrYounity

GOLDPreferably suitable for scalping and accurate as long as you watch carefully the price action with the drawn areas.
With your likes and comments, you give me enough energy to provide the best analysis on an ongoing basis.
And if you needed any analysis that was not on the page, you can ask me with a comment or a personal message.
Enjoy Trading ;)
