Gold Price Forecast (7 Nov 2025): Buyers Waiting Below $4,000📌 Current Price Snapshot
The spot price for Gold is around US $3,991 per troy ounce (as of 7 Nov 2025) according to
In Australian dollars the price is about A$6,144 per troy ounce.
🎯 Key Technical / Market Context
Resistance / Support zones
The metal has tested and broken through the psychological US $4,000/oz level recently but has found resistance there.
World Gold Council
A key breakdown level is around US $3,700/oz. If price drops below that, it opens a risk of deeper pull-back (to ~US $3,500/oz).
On the upside, if momentum returns and breaks convincingly above ~US $4,400/oz it could trigger a fresh leg upward.
Technical indicators
The recent analysis shows gold is trading below its 50-day EMA, meaning short-term momentum is weak and there’s dominant selling pressure.
Economies.com
While oversold indicators have given somewhat of a bounce, the up-trend is not yet strong.
Economies.com
Drivers (fundamentals & macro)
A weaker US dollar and expectations of rate cuts by Federal Reserve have been major tailwinds for gold.
goldpriceforecast.com
Geopolitical uncertainty and central-bank buying are adding structural support.
But caution: If the dollar strengthens, or rate cuts get delayed/inflation surprises happen, gold could be vulnerable.
BullionByPost Europe
🔍 My Trading View & Strategy
Given the current levels and market structure, here’s how I’m positioning, if I were trading gold today:
Short term (next few days to 1–2 weeks):
With the price ~US $3,991 and under pressure below key moving averages, I’m not chasing a long position aggressively. I’d wait for either:
A dip toward support (~US $3,700) with signs of bounce (good risk-to-reward for long).
Or a breakout above ~US $4,200-US $4,400 with strong volume and momentum for long.
Medium term (next 1-3 months):
My base view is still bullish (structural tailwinds remain) but price is in a consolidation/correction phase. So:
Consider buying on dips around US $3,700-3,800 with tight stops.
If price drops below US $3,500, reevaluate: risk of deeper correction.
If price breaks above US $4,400 convincingly, potential target toward US $4,800+ in that window.
Risk management:
Stop-loss placed just below the key support (e.g., beneath US $3,650) to protect downside.
Use smaller size if entering in this somewhat volatile environment.
Keep an eye on macro news (Fed announcements, USD moves, inflation prints).
Trade ideas

XAUUSD 15m Trading Idea / Buy the Dip, Don't be the DipAlright, here’s the play 👇
We’re sitting at the buy zone 3972–3974 — that sweet little pocket where gold likes to fake weakness before punching back up.
SL? Under 3964.5 (we’re not married to the trade, just dating it).
Targets?
TP1 → 3992
TP2 → 3999
TP3 → 4003
TP4 → 4008
Short zone? 4010–4012 — where I’ll be waiting with popcorn and a sell button.
Bias: bullish retracement till the 200 EMA smacks it back down.
Wait for a bullish engulfing or ME whisper before you jump in — no hero entries.
R:R ≈ 1:2.8 — because we like math that loves us back.

LONG ON GOLD XAU/USDGold has swept sell side liquidity and has given us a choc (change or character) to the upside.
There is tons of buyside liquidity to the upside with huge FVG's (Fair value gaps) and equal highs (double top) that need to be mitigated.
I am buying gold looking to catch over 200-300 points.
That's 2000-3000 pips.

GOLD (XAUUSD): Deep Consolidation
This week is very slow for Gold.
The market is stuck within a wide horizontal range on a daily time frame.
With the absence of high impact US fundamentals, I think that probabilities will be high that the market will keep consolidating.
The best strategy to follow for now is to look for trading opportunities from the boundaries of the underlined parallel channel: selling from the resistance and buying from the support after a confirmation.
As the price is closer and closer to the resistance, wait for its test and then look for selling.
That is the plan so far.
❤️Please, support my work with like, thank you!❤️
I am part of Trade Nation's Influencer program and receive a monthly fee for using their TradingView charts in my analysis.

XAU/USD:Capped Below 4,100 as Sellers Eye Breakdown Toward 3,900XAU/USD rebounded from the channel base but remains below the downward trendline and the 4,080–4,100 supply zone. Price is forming lower highs inside a falling channel, with choppy consolidation mid-range.
A sustained move below 4,080 could trigger downside toward 3,900, with 3,827 as an extended target if momentum accelerates. To shift bias, bulls must reclaim and hold 4,100–4,135, which would reopen upside toward 4,200+.
❗️ Risks:
– Break above 4,100–4,135 could squeeze shorts and flip bias bullish.
– Soft U.S. data or risk-off flows may trigger gold strength.
– Event-driven volatility could disrupt intraday structure and positioning.

clear consoidation is happeningGiven the consolidation pattern:
The bias is neutral to slightly bearish until there’s a clear break of either side of the range.
A close below ~$3,870 would signal a deeper correction; a clear breakout above ~$4,100 would hint at resumption of the up-trend.

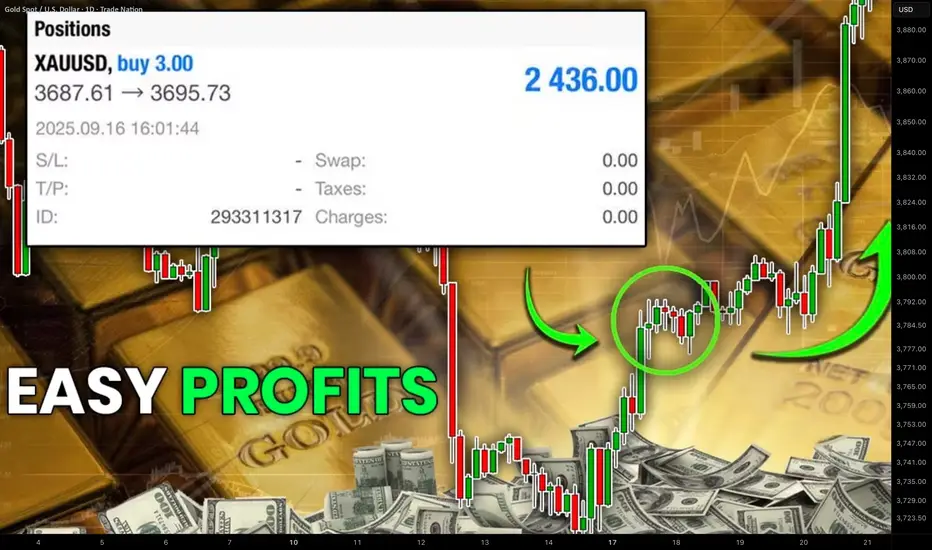
Profitable Gold XAUUSD Indicator Trading Strategy Explained
To profitably trade a massive bullish rally on Gold , you don't need a complicated system.
In this article, I will teach you an easy indicator strategy for trend-following trading XAUUSD.
It is based on 2 default technical indicators that are available on any trading platform: Mt4, Mt5, TradingView, etc.
You will get a complete trading plan:
exact entry signal,
smart stop loss placement,
trade management rules.
The first indicator that you will need to trade this strategy is Moving Average.
We will use a combination of 2 Moving Averages: Exponential Moving Average EMA with 20 length and a Simple Moving Average SMA with 9 length.
Our entry signal will be a crossover of 2 MA's on a 4H time frame.
SMA and EMA should meet first.
SMA should break through EMA to the upside to confirm a bullish signal.
With a high probability, Gold price will rise significantly then.
The main nuance of this strategy is to wait for a confirmed crossover and avoid the traps.
Patiently wait for a touch of 2 moving averages first.
After that, you will need to wait for a close of one more 4H candle to make sure that SMA stays above EMA.
You can see that though 2 Moving Averages met, SMA failed to break through EMA.
That is how a valid buy signal looks: SMA stays above EMA after a close of the next 4H candle.
After you identified a valid crossover, it is your signal to open BUY trade on Gold .
Your entry should be exactly after a close of a 4H candle.
Stop loss will be based on another popular free indicator - Average True Range ATR with default 14 length settings.
Your safe stop loss should be 2 ATR from the entry.
In our example, ATR is 145 pips.
2 ATR will be 190 pips.
That will be our stop loss.
With this trading strategy, we will not use a fixed Take Profit TP and use trailing stop loss instead.
It will help us to catch extended bullish waves on Gold.
Once the market starts rising, updating the highs, trail your stop loss based on EMA and keep it 1 ATR below that.
Make sure that you move your stop loss only when EMA and Gold price are rising . Once Gold price or EMA start moving in sideways or go down, do not lower your stop loss.
Using this strategy consistently, you will be able to catch significant bullish waves.
In Autumn trading season of 2025, this strategy provided, 3100+ pips entry signal.
What I like about this strategy is that being very simple, you can easily backtest that and measure its objective trading performance.
Easy entry, confirmation, and trade management rules make this strategy appropriate for beginners in Gold trading and will help to not miss a current extraordinary trend.
❤️Please, support my work with like, thank you!❤️
I am part of Trade Nation's Influencer program and receive a monthly fee for using their TradingView charts in my analysis.
Gold on relief rallyTechnical analysis: Gold was close to the important #3,962.80 Hourly 4 chart’s Support zone test (Xau-Usd Spot numbers), as Price-action was rejected on #3,957.80 - #3,962.80 configuration, which shows how slow to reveal major move Gold has become (not taking Fundamental Buying pressure into account) and didn’t even engaged full scale decline sequence / even though that DX is seen Trading on relief rally without Bearish candle sequence and on constant High's (DX remains of course my main correlating instrument). If there wasn’t Bullish DX related developments, Gold would be significantly Higher under the circumstances. Gold eventually didn't even honored the Resistance break on DX and to counterbalance the sequence, delivered Short-term Buying impulse, seen early on regarding E.U. session, reversing again despite Tuesday’s late session decline as DX is Trading near Weekly (#1W) Resistance zone - should reveal an Bearish Short-term sentiment Gold should be Trading under., however Gold is soaring as this is total Buying domination and undisputed Bullish trend. Even though my Medium-term outlook remains Bullish based on fractal analysis of candles, Volume and RSI with the period March - April, I am expecting a Short-term Neutral Rectangle Trading towards the Hourly 4 chart’s Resistance zone first (#4,021.80 - #4,027.80) as the Hourly setting were sitting in Overbought waters approaching the levels of December #27. I am looking closely at this week’s U.S. data to monitor DX movements.
My position: Even though Gold should dip, I was confident in my multi-Month Bullish projection and Bought Gold aggressively many times after my #3,942.80 - #3,946.80 pending Buying orders to the upside. Sold #3,980's on late U.S. session (aggressive Scalps) and waited #3,962.80 to Buy again aggressively towards #4,000.80 benchmark. I do expect #4,027.80 Resistance test extension as I will re-Buy Gold from my entry points.

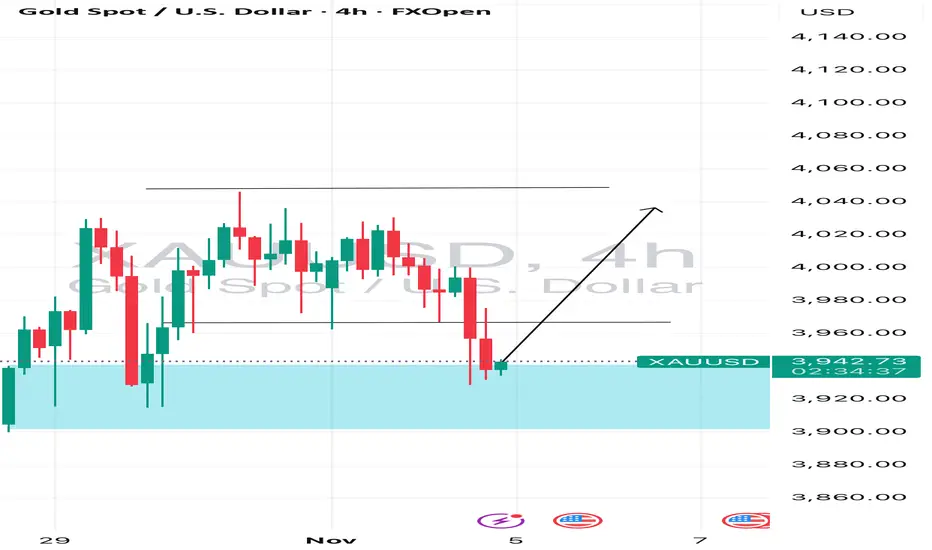
Gold Price Surges Above $4,000Gold Price Surges Above $4,000
As the chart shows, XAU/USD climbed above the $4,000 mark today, a move likely driven by:
→ Weakness in the US dollar index – or a pullback from the resistance level discussed in yesterday’s DXY analysis.
→ Concerns over the ongoing US government shutdown – according to media reports, one consequence has been that American airlines began limiting ticket sales in November.
Technical Analysis of XAU/USD
On 28 October, our analysis of gold price movements showed the following:
→ We constructed an ascending channel (marked in blue), illustrating the metal’s remarkable rally from its August low.
→ We suggested that the developing pullback might target the QL line, reinforced by the round-number support at $3,900.
This support zone successfully held, forming a local bottom at point B, after which the price entered a period of consolidation, resembling a symmetrical triangle pattern.
Notably, gold has today broken upward through this triangle (outlined in black). In the broader context, this breakout represents a strong signal from the bulls, suggesting a possible resumption of the 2025 uptrend.
If buying momentum continues, their strength may be tested by:
→ Resistance at $4,045;
→ Resistance near $4,150, which aligns with the 50% retracement of the A→B decline and has previously acted as a reversal zone for XAU/USD.
This article represents the opinion of the Companies operating under the FXOpen brand only. It is not to be construed as an offer, solicitation, or recommendation with respect to products and services provided by the Companies operating under the FXOpen brand, nor is it to be considered financial advice.

XAU/USD Holds 3,980$ as Bulls Eye Recovery Toward 4,020$🔍 Market Context
Gold steadies near the 3,980$ mark as traders weigh shifting expectations on US interest rates.
The latest ADP employment report showed a modest increase of 42,000 jobs — easing fears of an accelerated slowdown but reinforcing the broader cooling trend in the labor market.
While the Federal Reserve’s rate cuts have supported bullion throughout the year, the prolonged US government shutdown now clouds macro visibility, delaying key economic data.
Despite mixed sentiment, gold remains one of 2025’s strongest-performing assets, up over 50% year-to-date, driven by ETF inflows and central bank demand.
📊 Technical Outlook (H1–H4)
Gold has staged a notable rebound from the 3,947$–3,969$ demand zone, reclaiming short-term structure and approaching the 3,990$–4,000$ liquidity pocket.
This area aligns with the 0.618 Fib retracement and descending trendline resistance — making it the next decision point for intraday traders.
Key Technical Zones:
• 💎 Support: 3,947$ – 3,969$ (Liquidity Base / Re-accumulation)
• 🎯 Resistance: 3,992$ – 4,024$ (Fibo 0.618 + Trendline Confluence)
• ⚙️ Extended Bull Target: 4,028$ – 4,033$ (1.272–1.618 Fibo Expansion)
• ⚠️ Invalidation: Below 3,940$ → shifts bias toward 3,905$ liquidity pool.
🎯 MMFLOW View
Smart money continues to accumulate within the re-accumulation pocket near 3,950$, hinting at latent bullish intent.
If price holds above 3,970$ after today’s consolidation, an extension toward 4,020$–4,033$ remains highly probable.
However, failure to maintain intraday demand could invite another liquidity sweep before a larger push higher.
⚜️ MMFLOW Insight:
“Liquidity reveals intention — structure only confirms it.”

XAUUSD UPDATEhi everyone
For this upward movement, the first resistance is at the 3494 level. A breakout at this level would also coincide with a breakout of the trendline. If both the trendline and resistance are broken, the price is likely to move toward the next resistance at 4984. The target price could reach the 61.8% Fibonacci retracement level.
I’m also interested in entering a long position around the 3862 area. However, if the support at 3884 breaks, I will reconsider the setup
good luck all
**My trading strategy is not intended to be a signal. It's a process of learning about market structure and sharpening my trading my skills also for my trade journal**
Thanks a lot for your support

XAU/USD) Bearish trend analysis Read The captionSMC Trading point update
Technical analysis of XAU/USD (Gold Spot) – Bearish Continuation Setup
Timeframe: 1H (Capital.com)
Concepts: Smart Money Concepts (SMC), Trendline Break, FVG & EMA Confluence
---
Market Structure Overview
The uptrend structure was recently broken, confirming a shift to bearish order flow.
Price has broken the ascending trendline, retested near the FVG / premium retracement zone, and is rejecting from the supply area.
The structure and EMAs both support further downside continuation.
---
Key Technical Elements
Retracement Zone (Short Entry Area):
0.5 – 0.79 Fibonacci levels align with the Fair Value Gap (FVG), showing potential for bearish mitigation.
Price currently trading near 0.62–0.705 level (premium zone).
EMA Confluence:
EMA-50 ≈ 3,992
EMA-200 ≈ 4,024
Both EMAs are above price, acting as dynamic resistance.
Trendline Break:
The ascending trendline has been decisively broken and retested, indicating trend reversal confirmation.
---
Targets
Immediate Target (0-level structure): 3,940 zone
Extended Bearish Target: 3,796 — marked as the final target point on the chart
---
Scenario Plan
1. Expect minor retracement to the FVG zone (3,990–4,010).
2. Watch for bearish confirmation (rejection or lower-timeframe BOS).
3. Target downside continuation to 3,796, completing the swing projection.
Mr SMC Trading point
---
Bias:
> Bearish – Market showing structure shift, EMA confluence, and FVG rejection setup aligning toward deeper downside movement.
---
please support boost 🚀 this analysis

XAUUSD LONG-2 HIGH ACCURACY ( NOV 05, 2025 )If you have doubt on our trades you can test in demo.
OANDA:XAUUSD LONG
TP: 3987.065
SL: 3951.327
Trade Ideas:
Idea is clearly shown on chart + we have some secret psychologies and tools behind this.
Trade Signal:
I provide trade signals here so follow my account and you can check my previous analysis. So don't miss trade opportunity so follow must.

xauusdSame bearishs cenario once 3900 is broken expect a heavier drop. So many ways this can play look for 3300 region but more likely is near to 3k imo :). Lets hope this is a correction and short in time time. The alternative can take months

Excellent Profits on yesterday’s session Selling sequenceAs discussed throughout my yesterday’s commentary: “My position: I have Sold Bought Gold throughout yesterday's session from #3,998.80 especially towards #4,008.80 (aggressive Scalps) and called it for the session. Gold delivered significant Intra-day losses on Asian session and turned timefrimes to Bearish territory. Today is Intra-day Sell session and will continue Selling Gold from my key entry points.”
My position: I have made excellent returns on Selling Gold throughout yesterday’s session taken from #3,995.80 local Top’s. Tide has turned to Sellers reigns and Intra-day sentiment remains turned in Sellers favor. Sequence will stay the same as long as DX is Trading on upside numbers.

Gold 30Min Engaged ( Bearish after break out entry Detected )Status: Active Reversal Protocol
Symbol: Gold
Session: London–New York Overlap (Smart Exit Window)
Bearish After Break 3980
Bearish After Break 3950
Bias: Bullish & bearish Reversal
☄️ Volume Surge Confirmed — Sellers dominate exhausted highs
☄️ Session Aligned — Smart money exit window open
☄️ Cluster Shield Active — Supply imbalance verified
☄️ Delta Shift Negative — Buyers trapped above
☄️ POC Retest Completed — Liquidity absorbed at resistance
☄️ Structure Break Pending — Bearish bias confirmed

xau-usdToday, Ons has reached the trend line again, and there has also been a breakout in RSI. However, for confirmation of the upward movement, it should also show confirmation on the chart 🙂📊So, you shouldn't rush until the trend line is broken.

GOLD How to Trade the XAUUSD Range Breakout StrategyLet's cut straight to the chase on Gold (XAU/USD). Right now, the chart isn't giving us much to work with. We are locked solid in a textbook range-bound environment. 😒
If you compare this choppy, sideways action to the clear trends we've seen previously, the difference is stark. There is simply no directional conviction in the market at the moment; we're witnessing classic accumulation/distribution—or just plain indecision.
My focus is simple: Patience is your edge right now. I'm not interested in getting chopped up inside this consolidation zone. We are waiting for a concise, decisive move—a clean breakout—either above the high or below the low of this current range.. and a retest of the range. ⬆️⬇️
Bullish Scenario: A breakout above, followed by a successful re-test and fail. That's our green light for a long position, signaling momentum has shifted North. 🚀
Bearish Scenario: A breakdown and re-test of the range. That's the cue for a short opportunity, confirming bearish momentum. 📉
The breakout and re-test confirmation will be key. Until then, I'll stand aside and preserve capital. No setup, no trade. 🔥

XAUUSD H4 | Bearish Reaction off Key ResistanceXAUUSD is consolidating, and rising towards the top of the consolidation area.
Our sell entry is an overlap resistance level at 4,055, which aligns with the 61.8% Fibonacci retracement.
The stop loss is placed slightly above the multi-swing high resistance level, at 4,163, while the take profit is a swing low support level at 3,900.
Stratos Markets Limited (tradu.com/uk ):
CFDs are complex instruments and come with a high risk of losing money rapidly due to leverage. 68% of retail investor accounts lose money when trading CFDs with this provider. You should consider whether you understand how CFDs work and whether you can afford to take the high risk of losing your money.
Stratos Europe Ltd (tradu.com/eu ):
CFDs are complex instruments and come with a high risk of losing money rapidly due to leverage. 70% of retail investor accounts lose money when trading CFDs with this provider. You should consider whether you understand how CFDs work and whether you can afford to take the high risk of losing your money.

Gold Rebuilds Structure Above $3940, Eyeing $4030 Liquidity Pool
🔍 Market Context
Gold is attempting to regain bullish momentum as safe-haven demand remains supported by rising geopolitical tensions and uncertainty around the upcoming US ADP employment data.
The market continues to oscillate between risk aversion and rate expectations — with the Fed’s hawkish tone keeping the Dollar capped but steady.
At the same time, capital flow rotation from equities into defensive assets is quietly supporting the metal’s structural recovery, with gold holding above key liquidity levels despite intraday volatility.
📊 Technical Analysis (H1–H4)
After forming a double-bottom structure near $3,938, XAU/USD has reclaimed the 38.2% retracement zone (3,974–3,975) from its previous bearish leg.
This area now acts as a pivot zone, separating short-term bullish continuation from potential retracement.
The chart reveals a classic liquidity cycle shift:
Phase 1: Sweep of downside liquidity below 3,930, marking an internal structural low.
Phase 2: Expansion leg reclaiming short-term FVGs, signaling a potential smart money accumulation phase.
Phase 3: Repricing toward upper liquidity targets aligned with Fibonacci extensions.
Key Technical Zones:
• 💎 Liquidity Base: 3,938 – 3,950 (recent demand re-entry area)
• 🎯 Rejection Zone 1: 3,974 – 3,999 (previous inefficiency block)
• ⚙️ Target Zone: 4,033 – 4,045 (1.272–1.618 Fibo extensions, liquidity pool)
• ⚠️ Invalidation: Break below 3,920 would shift structure back to distribution.
🎯 MMFLOW Scenario
If gold sustains above the 3,950 support cluster, buyers are likely to extend the retracement toward 3,999–4,033 where resting liquidity sits.
A clean rejection from 4,000 could trigger an intraday pullback — but as long as price holds above the 3,938 OB base, the bullish recovery structure remains intact.
The short-term narrative favors controlled accumulation, suggesting that smart money is building positions into liquidity zones before the next impulsive move.
⚜️ MMFLOW Insight:
“Liquidity isn’t random — it’s engineered. Every move leaves a footprint, and gold is tracing its next one above $3,950.”

THE KOG REPORTTHE KOG REPORT
Quick KOG Report this week.
Firstly, we would say it’s the first trading day of the new month so maybe an idea to let the market find it’s feet before jumping in. We’re only going to share the potential path this week and the red box target levels on the breaks. We’ll also stick with some of the red boxes from last week with the new levels to watch out for.
RED BOXES:
Break above 4010 for 4016, 4030, 4044 and 4050 in extension of the move
Break below 4001 for 3995, 3986, 3971 and 3959 in extension of the move
Please do support us by hitting the like button, leaving a comment, and giving us a follow. We’ve been doing this for a long time now providing traders with in-depth free analysis on Gold, so your likes and comments are very much appreciated.
As always, trade safe.
KOG

XAUUSD GOLDGold price on the 4H chart is forming a bullish breakout pattern from a descending wedge, trading near the 3,997 zone. A confirmed breakout above the trendline could trigger upward momentum toward the 4,120–4,160 target area, while holding above the 3,960 support will keep the bullish outlook valid.
"Thank you for your support! If you found this idea valuable or learned something new, please consider liking and leaving a comment. I’d really appreciate hearing your feedback and thoughts."