the gold continues raising toward 4109the gold continues raising toward 4109
tp1=4079
tp2=4089
tp3=4099
tp4=4109
sl=4064
Trade ideas

Gold continues to surge. Is it unstoppable?Last week, a single social media post by President Trump wiped out $2 trillion in US stock market value, with the S&P 500 index falling 2.7% that day, its worst performance since early April. The reality of this incident demonstrates that Trump's authoritarian trade policies continue to influence the fate of the global economy.
In early Asian trading on Monday, gold briefly hit $4,060, a new all-time high. With market concerns easing slightly, it is currently fluctuating around the 4,050 high.
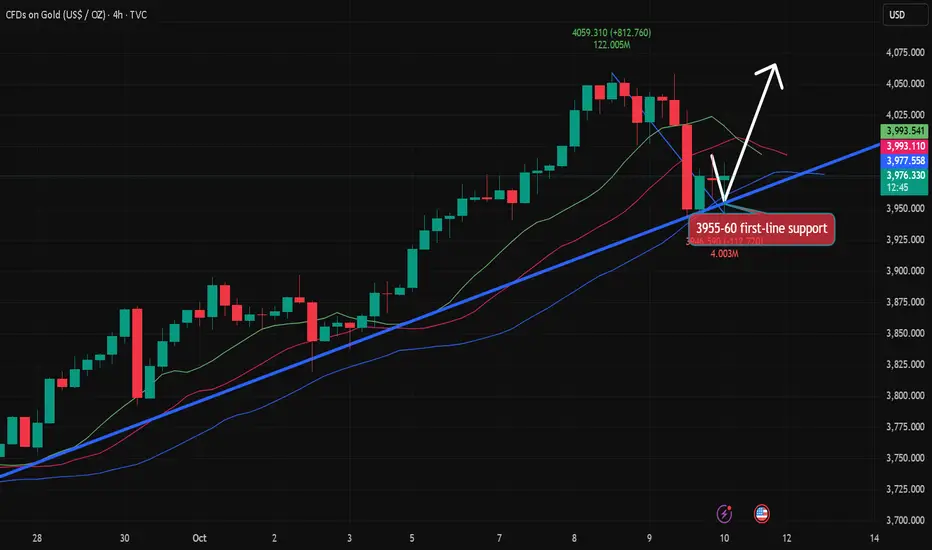
Looking at the 4-hour chart, Quaid believes gold prices still have the potential to reach new highs. Current support is around 4,035, followed by 4,020.
If support at 4,035 is broken, gold could potentially reach the 4,080-4,090 high. This is because 4,035 is at the 0.618 Fibonacci support level, while 4,020 is at the 0.50 level.
However, the possibility of a deeper pullback to 4020 cannot be ruled out. As long as gold remains above 4020 in the short term, it remains strong.
For short-term operations, Quaid recommends that you can go long around 4035. If the price breaks through 4060, the target may reach 4080-4090.

Elliott Wave Analysis – XAUUSD (13/10/2025)
________________________________________
🔹 1. Overview
In the previous plan, I predicted an upward correction after a panic sell-off, which was identified by an unusually extended blue wave C on H1.
________________________________________
🔹 2. Momentum
D1 Momentum is currently reversing downward, however, since price and momentum are diverging, the bullish pressure remains strong.
H4 Momentum has now entered the overbought zone, so within the next 1–2 H4 candles, a corrective decline may occur.
H1 Momentum is currently falling, while price is moving sideways, so we should continue observing this zone carefully.
________________________________________
🔹 3. Wave Structure
D1 Chart:
• Price is still within the yellow wave 5.
• Although D1 momentum is declining, the extended wave 5 structure suggests that once a correction begins, the first drop will likely be steep and deep.
• The divergence between D1 candles and D1 momentum only signals weakening bullish strength, not yet a confirmed reversal.
H4 Chart:
• Price is currently moving along the upper boundary of the channel.
• Earlier, a blue ABC structure completed, and now price is forming three consecutive peaks near the previous high.
• This setup hints at a WXY pattern, where wave Y may develop as either:
1️⃣ A Flat (5-wave) pattern, or
2️⃣ A Triangle.
H1 Chart:
• A blue ABC correction has been completed, followed by a rally back to the previous top.
• Price is now moving sideways around this zone.
• Given that the ABC correction is done, there are two possible outcomes:
o (1) The correction is complete, and price is now in a 5-wave impulsive rally, meaning further upside.
o (2) The correction is still developing, and price may continue to drop as described in the H4 scenarios.
________________________________________
🔹 4. Additional Notes
• The current wave structure shows significant overlap, and given the previous panic sell, this slow recovery makes sense — it likely represents a leading diagonal (wave 1 triangle).
• In such a case, once price breaks out of the channel, it should accelerate sharply into a strong wave 3.
• However, since price remains sideways, this scenario may instead represent wave X of a continuing correction.
⚠️ Important:
Unlike the Friday Buy setup, which had strong confluence, the current scenario presents two conflicting possibilities, so the probability is not high.
________________________________________
🔹 5. Trade Plan
Sell Setup (Short-Term):
• Sell Stop: 4040
• SL: 4058
• TP1: 4010
Risk Management:
If price rises strongly above, confirming wave 3 behavior, then cancel the Sell setup.
As mentioned, this signal has lower probability and a relatively wide stop, so it’s better to either observe or enter with a small position size.

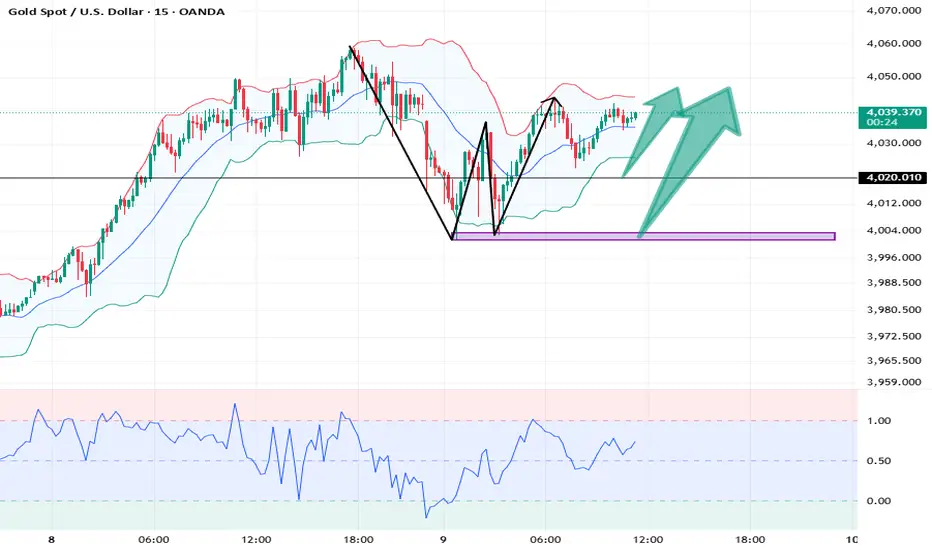
XAUUSD Bullish Retracement Opportunity: Targeting $4,030 ?(XAUUSD) price action, focusing on a recent strong move and a potential reversal setup.
1. Key Price Action
Prior Uptrend: The chart shows a significant, powerful bullish move leading up to the $4,030–$4,040 area, evidenced by a series of large, green (bullish) candlesticks. This indicates strong buying pressure and momentum preceding the current segment.
Recent Sell-off/Correction: Following the high, the price experienced a sharp sell-off (red candlesticks), bringing it back down significantly.
Current Bounce and Retracement Area: The price has bounced off a lower area and is now currently trading around $4,012.48.
2. Proposed Trading Scenario (Technical Pattern)
The black and green arrow indicates a potential bullish reversal/continuation pattern:
Potential Retracement/Support Zone: The cyan-shaded rectangle, roughly between $3,990 and $4,005, appears to be a demand zone or a zone of prior support/resistance that the price is expected to re-test. The proposed path shows the price first pulling back to this zone before resuming its ascent.
Planned Trajectory: The indicated path suggests a "dip-buying" strategy, where a trader would wait for a pullback into the support/demand zone (the cyan box) and then enter a long position.
Target 1 (T1): $4,030.42: This is the immediate target, likely a re-test of a recent swing high or a key resistance level.
Target 2 (T2): $4,040.00: This is the secondary target, indicating an expectation for the price to break the first resistance and continue higher to test the ultimate recent high or the next significant resistance level.
3. Conclusion
The analysis suggests a bullish outlook in the short to medium term, following an initial retracement. The trading plan hinges on the cyan box holding as a key support/demand zone to facilitate a push back toward the recent high, aiming for new short-term highs at $4,030 and $4,040. This is a classic "buy-the-dip" setup within a broader context of strong upward momentum.

XAU/USD Technical Outlook – October 13, 2025Gold continues to respect its ascending channel on the H1 timeframe. After retesting the 4,000 psychological level, price has regained momentum, forming a new short-term base around 4,035–4,045.
The structure remains bullish, supported by higher highs and higher lows, with dynamic support from the channel’s lower boundary. Traders are now watching the retest zone near 4,050—a potential launch point for the next impulsive wave toward 4,120–4,160.
Key levels to watch:
Support: 4,035 – 4,045 / 3,990
Resistance: 4,085 / 4,120 / 4,160
EMA alignment: Bullish across short and mid-term EMAs
RSI: Maintaining above the midline, confirming buying strength
Trading strategy:
If price holds above 4,035, consider buy setups on pullbacks toward the lower trendline or Fibonacci retracement 38.2–50% zones. A confirmed break above 4,085 may trigger strong continuation toward 4,120+.
However, failure to defend 4,035 could signal a temporary correction toward the 3,990 area before resuming the uptrend.
The bias stays bullish as long as structure and momentum remain intact within this channel.
Follow for more daily insights and advanced gold trading strategies.

Xau/Usd- Bullish Play Above Support Price action on the 15-minute chart shows a potential bullish continuation forming after multiple CHoCHs (Change of Character) and a recent Break of Structure (BOS) to the upside.
Key Levels:
Resistance Zone: ~4,016 – 4,036
Support Zone: ~3,975 – 3,985
Strong High: Above 4,040 (target area)
Current Setup:
Price has tested the resistance zone and is showing signs of potential retracement. If price respects the support zone on the next pullback, a bullish continuation towards the target (strong high) is expected.
Scenario:
Pullback to the support zone (marked demand).
Bullish reaction from this zone could trigger a move upward.
First target: Break and close above resistance → continuation to strong high area.
Invalidation: Break and close below support zone (~3,975) would invalidate this short-term bullish setup.
Bias: Bullish (Short-Term)
Confirmation Needed: Price action around support zone
Timeframe: 15-Minute (Intraday)

XAUUSD (Gold) — Bullish Continuation ScenariosGold remains in a strong uptrend following a corrective pullback. A fair value gap below is likely to act as support. Two possible plays: an aggressive entry from current levels anticipating continuation, or a conservative approach waiting for a deeper retest before looking higher.

Game Plan Mon 13 Oct 2025Let's see what the market deliver this week.
Only price action for educational purpose.
No financial advice.
Your Money, Your Responsibility.
Just sharpening my edge day in, day out.
@TeamWePrint

Gold Weekly Summary and Forecast 10/13/2025Last week, gold soared again without any retrace in weekly TF perspective. This could not last for long but there is also no sign of dropping. Although in lower TF, we saw a few selling opportunities, gold always recovered with bigger rise. Therefore, I am still expecting gold to reach my monthly target, which is around 4120.
For next week's trading strategy, I will be cautious in selling under 4120 and limit my buying above 4120. I am expecting a spike up to 4120 early next week and went down afterwards. Let's see how the market will play out next week.

(GOLD) H4 – $4,000 Reclaimed, Where is the Optimal Strategy?🎯 Macro Summary: The Safe-Haven Demand Dominance
The new trading week kicks off with a strong signal from Gold: the price has successfully recaptured the critical psychological level of $4,000 and is trading around $4,020.
Primary Driver: Geopolitical risk concerns and escalating US-China tensions (with the US President announcing "very strange things" happening in China and countermeasures being considered) have driven the market to seek Gold as a safe haven.
Record Trend: Buyers are looking to sustain the momentum, aiming for an eighth consecutive weekly gain, indicating a powerful underlying trend that cannot be ignored.
The Warning Level: To maintain the bullish trend and avoid a deep correction toward $3,900, Gold must hold above the lower boundary of the ascending channel at $3,962 (on a weekly candle close).
📊 In-Depth Technical Analysis (H4): Pinpointing Fibo Reaction Zones
Based on the current H4 market structure and the use of Fibo/Liquidity React Zone tools—the signature of FranCi$$_FiboMatrix—we have the following strategic trading areas:
1. Strategic SELL Reaction Zones:
These are strong Fibo resistance areas where we will look for SELL corrections if buying momentum stalls:
SELL ZONE 1 (FIBO) 402x - 403x (4,025.424 - 4,032.844) The nearest critical Fibo resistance zone. Price is currently reacting here.
SELL ZONE 2 (Extension) 411x - 412x (4,115.422 - 4,128.811) The powerful FIBO Extension 1.5 - 1.618 target. This is the next target if price breaks SELL ZONE 1 and continues its strong ascent.
BUY ZONE (LIQUIDITY) 392x - 389x (3,907.030 - 3,895.674) The crucial Liquidity React Fibo Buy Zone. This is the ideal point to look for long entries (BUY) when the price corrects down, close to the psychological $3,900 mark.
Great! Based on the in-depth, precise Fibo and reaction zone analysis that defines the FranCi$$_FiboMatrix channel on TradingView, I will fully translate and standardize your content into a comprehensive and professional weekly market outlook for Gold (XAUUSD) on the H4 chart.
Here is the weekly market analysis for Gold (XAUUSD) on the H4 chart, integrating both macro and technical elements:
⚡️ WEEKLY OUTLOOK: XAUUSD (GOLD) H4 – $4,000 Reclaimed, Where is the Optimal Strategy?
Version: Weekly Outlook – H4 Analysis | FranCi$$_FiboMatrix Channel
🎯 Macro Summary: The Safe-Haven Demand Dominance
The new trading week kicks off with a strong signal from Gold: the price has successfully recaptured the critical psychological level of $4,000 and is trading around $4,020.
Primary Driver: Geopolitical risk concerns and escalating US-China tensions (with the US President announcing "very strange things" happening in China and countermeasures being considered) have driven the market to seek Gold as a safe haven.
Record Trend: Buyers are looking to sustain the momentum, aiming for an eighth consecutive weekly gain, indicating a powerful underlying trend that cannot be ignored.
The Warning Level: To maintain the bullish trend and avoid a deep correction toward $3,900, Gold must hold above the lower boundary of the ascending channel at $3,962 (on a weekly candle close).
📊 In-Depth Technical Analysis (H4): Pinpointing Fibo Reaction Zones
Based on the current H4 market structure and the use of Fibo/Liquidity React Zone tools—the signature of FranCi$$_FiboMatrix—we have the following strategic trading areas:
1. Strategic SELL Reaction Zones:
These are strong Fibo resistance areas where we will look for SELL corrections if buying momentum stalls:
Zone Price Range Analysis Basis
SELL ZONE 1 (FIBO) 402x - 403x (4,025.424 - 4,032.844) The nearest critical Fibo resistance zone. Price is currently reacting here.
SELL ZONE 2 (Extension) 411x - 412x (4,115.422 - 4,128.811) The powerful FIBO Extension 1.5 - 1.618 target. This is the next target if price breaks SELL ZONE 1 and continues its strong ascent.
Xuất sang Trang tính
2. Strategic BUY Liquidity Zone:
This zone is the prime area to catch the next BUY wave when the market retraces:
Zone Price Range Analysis Basis
BUY ZONE (LIQUIDITY) 392x - 389x (3,907.030 - 3,895.674) The crucial Liquidity React Fibo Buy Zone. This is the ideal point to look for long entries (BUY) when the price corrects down, close to the psychological $3,900 mark.
Xuất sang Trang tính
📈 Optimal Weekly Action Plan
Scenario A: Distribution and Re-accumulation (Correction to BUY Zone)
Action 1 (SELL/SHORT): Actively look to SELL at the 402x - 403x zone (SELL ZONE 1) upon clear H4/H1 bearish reversal candle signals.
Sell Target (TP): Aim for the LIQUIDITY REACT FIB BUY ZONE 392x - 389x.
Action 2 (BUY/LONG): Wait for strong bullish confirmation signals at 392x - 389x to enter a long trade, following the main trend.
Buy Target (TP): Aim back towards SELL ZONE 1 or SELL ZONE 2 at 411x - 412x.
Scenario B: Acceleration (Breakout):
If the price executes a decisive breakout and closes above the 402x - 403x zone, we disregard the SELL setup and prioritize buying the momentum.
Next BUY Target: REACTION SELL ZONE 411x - 412x.
⚠️ Risk Warning (Risk Management):
Deep Correction Risk: Pay extremely close attention to the $3,962 level. If the Gold price breaks and closes below this level, the risk of a deeper correction toward $3,900 is very high. Maintain strict risk management (SL) for long trades if the price moves below this mark.

XAUUSD🟡 XAUUSD Trade Breakdown — 1:6.83 Risk-to-Reward Setup
I took this Gold (XAUUSD) trade with an entry at $3,966, a stop loss at $3,947, and a take profit target at $4,098.
This setup offered a 6.83x risk-to-reward ratio, meaning my potential reward was nearly seven times greater than my risk.
The trade was based on clean price structure and momentum confirmation. After entry, price has already moved in favor and is now trading around $4,016, showing solid momentum toward my target.
Risk management was key here — a tight stop below structure, a well-defined entry zone, and a clear target aligned with higher timeframe resistance.
Whether this trade fully hits TP or not, it’s a great example of why strong risk/reward setups matter more than win rate.
📊 Trade Details:
Pair: XAUUSD (Gold)
Entry: $3,966
Stop Loss: $3,947
Take Profit: $4,098
Risk-to-Reward Ratio: 1:6.83
Current Price: $4,016
💡 Lesson: Focus on setups that give you asymmetric risk — small loss potential, big reward potential.

Understanding the Carry Trade Strategy1. The Core Concept of Carry Trade
The essence of carry trade lies in exploiting interest rate differentials between two countries. Every currency has an interest rate attached to it—set by its central bank. For instance, if the interest rate in Japan is 0.1% and in Australia is 4.5%, a trader can borrow Japanese yen at the lower rate and invest in Australian dollars to earn the higher rate.
The formula for expected profit in a simple carry trade is:
Carry Trade Profit = Interest Rate Differential + Currency Appreciation (or - Depreciation)
Thus, profits come from two sources:
Interest income from the higher-yielding currency.
Exchange rate gains if the invested currency appreciates relative to the funding currency.
2. Real-World Example of Carry Trade
Consider the USD/JPY carry trade—a classic example often used by traders.
Suppose the U.S. interest rate is 5% and Japan’s is 0.1%.
A trader borrows ¥10 million (Japanese yen) at 0.1% and converts it into U.S. dollars.
The trader then invests that money in a U.S. bond or other instrument yielding 5%.
Annual Profit (approx.):
Interest differential = 5% - 0.1% = 4.9%
If the USD/JPY exchange rate remains stable, the trader earns nearly 4.9% as profit. If the dollar appreciates against the yen, profits rise further when converting back to yen. However, if the dollar weakens, part of the profit—or even all of it—can be wiped out.
3. Historical Perspective: The Rise of Carry Trades
Carry trades gained prominence in the 1990s and early 2000s, driven by globalization and massive liquidity in global markets.
One of the most famous examples was the Japanese Yen Carry Trade. Japan’s ultra-low interest rates encouraged global investors to borrow yen cheaply and invest in higher-yielding assets across the world—especially in emerging markets and commodities.
Between 2003 and 2007, this strategy helped fuel asset bubbles in stocks, real estate, and commodities. Investors were earning attractive returns as long as volatility remained low. But when the 2008 Global Financial Crisis hit, markets turned risk-averse, and carry trades were rapidly unwound. The yen surged as traders rushed to repay yen loans, resulting in sharp losses for many.
4. The Mechanics of Carry Trade Profits
Carry trade profits can be broken down into three main elements:
A. Interest Rate Differential
This is the basic profit component. The greater the difference between the two countries’ interest rates, the higher the potential return.
B. Exchange Rate Movements
The real profit or loss depends heavily on how exchange rates move during the investment period. If the high-yield currency strengthens, profits increase; if it weakens, losses mount.
C. Leverage
Forex markets allow high leverage—sometimes up to 100:1 or even higher. This means traders can amplify returns (and risks) substantially. A small interest rate difference can produce significant profits when multiplied by large positions.
5. Factors Influencing Carry Trade Returns
Several macroeconomic and market factors determine how profitable carry trades can be:
1. Central Bank Policies
Changes in interest rates by central banks directly impact carry trade returns. If a central bank raises rates, its currency becomes more attractive for investment; if it cuts rates, the currency weakens.
2. Inflation Expectations
High inflation can erode real returns, making a high-yield currency less appealing. Traders prefer stable economies with manageable inflation.
3. Market Volatility
Carry trades thrive in periods of low volatility. When markets are calm, traders are more willing to take on risk. During crises, investors rush to safe-haven currencies like the U.S. dollar, Swiss franc, or Japanese yen, often leading to large carry trade losses.
4. Global Risk Sentiment
Carry trades are often referred to as “risk-on” trades. They perform well when global markets are optimistic and fail when fear dominates. This is why equity market trends, bond yields, and commodity prices all indirectly affect carry trade profitability.
5. Currency Liquidity
Major currencies like USD, EUR, JPY, and GBP are highly liquid and preferred for carry trades. Emerging market currencies may offer higher yields but also carry higher volatility and default risk.
6. Popular Carry Trade Currency Pairs
Some of the most widely used carry trade pairs include:
AUD/JPY (Australian Dollar / Japanese Yen) – Classic pair due to Australia’s historically high rates and Japan’s near-zero rates.
NZD/JPY (New Zealand Dollar / Japanese Yen) – Similar to AUD/JPY, with higher yield differentials.
USD/CHF (U.S. Dollar / Swiss Franc) – Used when U.S. rates are higher than Switzerland’s.
TRY/JPY (Turkish Lira / Japanese Yen) – Extremely high yields but high volatility.
BRL/JPY (Brazilian Real / Japanese Yen) – Popular during commodity booms, but risky during downturns.
7. Risks in Carry Trade Strategy
While carry trades can generate steady profits in stable times, they are not risk-free. Major risks include:
A. Exchange Rate Risk
The biggest danger. A sudden appreciation in the funding currency or depreciation in the target currency can erase profits instantly.
B. Interest Rate Changes
Unexpected central bank decisions can sharply change interest rate differentials, hurting carry positions.
C. Market Sentiment Shifts
During global crises or geopolitical tensions, investors rush to unwind carry trades, leading to rapid currency reversals.
D. Leverage Risk
Because carry trades often use high leverage, even small currency moves can cause large losses.
E. Liquidity Risk
In volatile markets, traders might face liquidity shortages, making it difficult to close positions at desired prices.
8. Modern Trends in Carry Trades
In today’s financial environment, carry trade strategies have evolved beyond simple currency pairs. Institutional investors use derivatives, swaps, and ETFs to implement sophisticated carry trade structures.
Post-2020, as global central banks diverged in their policy responses, carry trades returned in new forms:
U.S. Dollar Carry Trades (2022–2024): As the U.S. Federal Reserve raised rates, investors borrowed in low-yielding currencies (like yen) to invest in dollar assets.
Emerging Market Carry Trades: Countries like Mexico, Brazil, and India offered high returns due to elevated interest rates, attracting foreign capital.
Crypto Carry Trades: Some investors even use stablecoins and crypto lending platforms to earn yield differentials, though with added risks.
9. Carry Trade and Global Financial Stability
Carry trades play a crucial role in global capital flows. When investors move funds across borders seeking yield, they influence exchange rates, bond yields, and asset prices.
However, this can create instability:
A large unwinding of carry trades can trigger currency crashes.
It can fuel asset bubbles in emerging markets.
It may distort monetary policy transmission in developing economies.
For example, during the 2008 crisis, the yen surged as carry trades unwound, destabilizing global markets. Similarly, during 2020’s COVID panic, the rapid appreciation of the dollar caused liquidity stress worldwide.
10. Managing Risks and Enhancing Carry Trade Profits
Successful carry traders don’t rely solely on interest differentials—they actively manage risk through various techniques:
A. Hedging
Using options and forward contracts to protect against adverse currency moves.
B. Diversification
Spreading investments across multiple currency pairs reduces exposure to a single market shock.
C. Monitoring Economic Data
Keeping track of inflation, central bank meetings, GDP growth, and unemployment helps anticipate policy changes.
D. Using Technical Analysis
Identifying strong trends and key support/resistance levels can optimize entry and exit points.
E. Position Sizing
Maintaining disciplined position sizes relative to account equity prevents catastrophic losses during unexpected events.
11. Carry Trade in the Post-Interest Hike World
After years of ultra-low rates, the world entered a new monetary era post-2022, where inflation surged and central banks tightened policies. This reshaped carry trade dynamics:
The U.S. Dollar became the favored investment currency due to its high yields.
The Japanese Yen and Swiss Franc again became popular funding currencies.
Emerging markets like India, Indonesia, and Brazil attracted carry flows due to strong domestic demand and stable growth.
However, volatility remains high. With central banks recalibrating rates, traders must remain agile, adapting strategies to shifting yield curves.
12. The Psychology Behind Carry Trades
Carry trades are as much about psychology as economics. When markets are optimistic (“risk-on”), investors believe currencies with higher yields will remain stable, leading to self-reinforcing inflows. But once fear sets in (“risk-off”), the same investors rush for safety, causing violent reversals.
This herd behavior explains why carry trades often “grind higher slowly” but “crash quickly.”
13. Carry Trade and Macroeconomic Indicators
Certain indicators provide clues about carry trade potential:
Interest Rate Differentials: The larger the spread, the greater the opportunity.
Volatility Index (VIX): Low VIX values favor carry trades; high VIX signals danger.
Commodity Prices: For countries like Australia or Brazil, commodity booms strengthen their currencies, enhancing carry returns.
Current Account Balance: Surplus nations have more stable currencies, reducing depreciation risk.
14. Example: The AUD/JPY Case Study
Let’s revisit the Australian Dollar / Japanese Yen pair—a carry trade classic.
Between 2003 and 2007:
Australia’s interest rate averaged around 6%, while Japan’s was near 0%.
Investors borrowing yen and investing in AUD earned a 6% interest differential plus additional currency gains as AUD appreciated.
However, during the 2008 financial crisis, the AUD/JPY pair fell nearly 40% in months as investors fled to safety. This demonstrated the twin-edged nature of carry trades—profitable during stability but dangerous in turmoil.
15. The Future of Carry Trade Profits
Looking ahead, carry trades will continue to evolve with shifting global monetary landscapes. Key trends shaping their future include:
AI-driven Forex Trading: Algorithms now optimize carry strategies based on real-time data, volatility signals, and machine learning models.
Decentralized Finance (DeFi): On blockchain platforms, yield differentials between tokens and stablecoins mimic traditional carry trades.
Diverging Monetary Cycles: With some central banks cutting rates while others hike, new opportunities will emerge across regions.
However, geopolitical uncertainty, inflationary pressures, and climate-related disruptions will keep volatility elevated—testing even the most sophisticated carry traders.
Conclusion: The Double-Edged Sword of Carry Trade Profits
Carry trades remain one of the most powerful yet perilous tools in global finance. They thrive in stability and crumble in panic. At their best, they provide consistent yield and drive cross-border investment; at their worst, they amplify global financial shocks.
For modern traders and investors, understanding the mechanics, risks, and psychology behind carry trade profits is essential. Success lies not merely in spotting interest differentials but in anticipating the shifts in market sentiment and monetary cycles that dictate when the trade will shine—or collapse.
Ultimately, carry trade profits are not just a measure of financial skill—they reflect the pulse of the global economy itself, balancing between the search for yield and the instinct for safety.

Gold is fluctuating slightly. Watch the market.Gold has been quite active recently, entering a pullback and correction mode. On the daily chart, it's almost forming a high-level engulfing pattern. Therefore, today's close is crucial. Whether it continues to decline, remains volatile, or rebounds strongly upwards will be crucial for future trends.
In the 4-hour level, the price temporarily maintains a narrow range of oscillation and repair, and the price is under pressure at 4010. The moving average trend at the 1-hour level tends to be flat, and there are signs of moving downward. The K-line begins to slowly break through the short-term moving average and maintains a weaker trend. There is potential for further downward correction in the late trading session, with continued strong support at 3950.
Gold Trading Strategy:
Go long on gold at 3970-3960, with a stop-loss at 3950 and a profit range of 4015-420.

10.10 Gold pullback continues to be bullish!!!Looking at the 4-hour market trend, watch for the important support level at 3957-3960. The bulls are rising strongly and there's no end in sight. Trading strategies should prioritize buying on dips. In the middle, be cautious and watchful when buying.
Gold Trading Strategies:
1. Go long on gold at 3957-3960, with a stop loss at 3948 and a target of 4015-4020. Hold if it breaks through!
Prices fluctuated wildly. Downward pressure persists.On Thursday, the market experienced significant price fluctuations, correcting around 4041.5 before rapidly rising, reaching a high of 4058.2. However, the market reversed during the US trading session. Influenced by news of a ceasefire in the Middle East, prices plummeted below the 4000 mark, reaching a low of 3943.3 before consolidating and closing at 3976.9.
This converging pattern indicates that short-term downward pressure persists.
Short-term Trading Focus:
1. Focus on the 4000 mark. If the price rebounds near this level, consider shorting.
2. After breaking through 4000, consider a final short position at 4020.
Profit targets are 3980-3960. Further declines could target 3945-3920.
A long strategy can start with a small long position around 3945, with a profit range of 3980-4000.

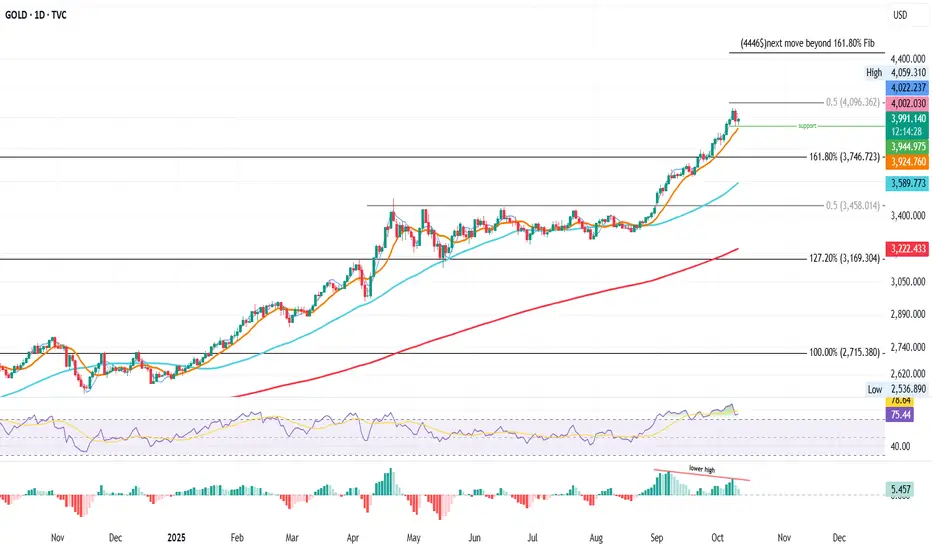
Gold Daily – Holding the Line Before the Next MoveGold Daily – Holding Support, Eyes on the Next Leg
Gold’s run from the 50MA support that started in the second half of August has been nothing short of spectacular.
After such a sharp move, it’s natural to look for where price might pause or recharge.
Based on historical price action and key Fibonacci levels, several zones stand out.
The 0.5 Fib level at $4,096 acted as resistance on October 8, marking the local high of this move.
Below, the green support line around $3,945 is now being tested, a zone that also aligns closely with the BBcenter, creating a confluence of potential support.
So far, this level has held for two sessions, but confirmation will depend on today’s daily close, roughly 12 hours from now.
With inflation concerns resurfacing and central banks showing renewed interest in gold reserves, the macro backdrop still favours strength in the long term.
Many are calling for a top in gold after this explosive rally, but as history shows, tops are rarely that obvious.
If this support zone, defined by the BBcenter and green line, manages to hold, price could push again toward $4,096, and possibly even extend to the projected “Next Move Beyond 161.8%” level around $4,446.
Bias: Cautiously bullish, support cluster holding, watching daily close for confirmation of continuation.
Always take profits and manage risk.
Interaction is welcome.
SIGNAL TYPE ; SELL GOLD XAUUSD🔴 SELL SIGNAL ACTIVE — XAUUSD (GOLD)
Bears are stepping in as price shows signs of exhaustion at key resistance levels.
This setup marks a high-probability short-term downside opportunity, ideal for traders who look to capitalize on momentum reversals and clean structural shifts.
✳️ Market Snapshot
Structure Shift: Price forms a lower high, signaling potential weakness ahead.
Momentum Turn: Sellers are reclaiming control after a failed bullish push.
Entry Zone: A defined area where downside acceleration is likely to begin.
Risk Control: Stop-loss levels remain tight (around 40–50 pips) to safeguard capital.
Trading Outlook
Consider short positions near the highlighted resistance or confirmation candle.
Targets: Short-term take-profits at recent support or liquidity sweep zones.
Tip: Keep position sizing aligned with your risk plan — focus on accuracy, not aggression.
Trader’s Note
This signal is intended for short-term momentum trading. Always apply your own analysis, follow strict risk management, and treat this as a trade idea, not financial advice.

Congratulations to everyone who followed yesterday’s analysisCongratulations to everyone who followed yesterday’s analysis — the market reacted exactly as expected.
We mentioned that any reaction to the Gaza ceasefire would likely appear during the U.S. session, and that’s precisely what happened: gold dropped sharply to 3944, following our sell plan below 4024-4018.
Today, gold continues to move within a corrective phase after forming a double top near the all-time highs. Momentum still favors the downside, though some intraday rebounds are possible as traders adjust positions ahead of the weekend - see my today analysis

XAUUSD SUPPORT, RESISTANCE & TRENDLINE ANALYSISI always try to keep it simple. The 15 min trendline has broken the low. I will plan for downside move today with targets 3940 / 3924 and maximum till 3918.
For upside if it breaks the 4000 mark then see further upside with 4024 & 4060 as your target.
NOTE: My personal view is Bearish in the short term.

Analysis of the Latest Gold Market DynamicsAnalysis of the Latest Gold Market Dynamics
Gold prices experienced a significant correction after reaching a record high, primarily due to a stronger US dollar and easing geopolitical tensions.
Geopolitics: Israel and Hamas reached a ceasefire agreement, weakening gold's safe-haven appeal.
US dollar trend: The US dollar index rose for four consecutive days, hitting a two-month high, making it more expensive to hold gold.
It is undeniable that gold prices had previously risen too sharply, and technical overbought conditions triggered a large number of long profit-taking, leading to a price correction.
Technical Analysis:
Current Trend and Pattern: Gold prices have fallen sharply after reaching a record high of $4,060, with a large bearish candlestick closing on the daily chart, indicating that short-term upward momentum has weakened and the market has entered a period of high-level consolidation.
Key Resistance and Support:
$4000-4010 (psychological barrier & short-term resistance)
$3940-3950 (4-hour chart starting point & near-term resistance)
$4050-4060 (historical high & double top resistance)
$3910 (lower support band on the 4-hour chart)
$3840 (core trend support; a break below could reverse the uptrend)
Current Trading Strategy:
Main Concept: Range-bound Trading
Buying low and selling high within the $3910-4010 range is the current primary strategy.
Long Strategy (Buy on Pullbacks)
Ideal Entry Area: $3940-3950 or around $3910.
The initial target can be seen in the $3980-4000 area.
Short Strategy (Short on Rebounds)
Ideal Entry Area: When gold prices rebound to the $4,000-4,010 resistance zone or the $4,050-4,060 double top resistance zone.
Target Outlook: The short-term target can be seen below the support zone of $3950-3940.
Breakthrough Response Strategy
Breakout Above Key Resistance: If gold prices break through and stabilize above $4,060, it will signal the end of the correction and the potential for new upside potential. Long positions can then be entered.
Breakdown Below Key Support: If gold prices break below $3,910 and threaten the core support of $3,840, it could signal a deeper correction. Short-term trading should focus on waiting and watching or shorting on rallies.

GOLD Local Long From 4000$! Buy!
Hello,Traders!
GOLD taps perfectly into the 4000$ demand area where Smart Money accumulates long positions after sweeping liquidity below intraday lows. A bullish reaction toward 4,024$ is expected as price rebalances inefficiency. Time Frame 15M.
Buy!
Comment and subscribe to help us grow!
Check out other forecasts below too!
Disclosure: I am part of Trade Nation's Influencer program and receive a monthly fee for using their TradingView charts in my analysis.

Gold/Silver ratio. Chose either gold or silver or both? 9/Oct/25Gold ( XAUUSD ) and Silver ( XAGUSD ) chart ratio.. What do you think silver price will be when Gold/Silver ratio drop to 30? When Gold at ≈ 4500 by early 2026? 4500/62 ≈ 72?! or 10,000 / 50 ≈ 333?! by 2033?

XAUUSD: Market Analysis and Strategy for October 9thGold Technical Analysis
Daily chart resistance: 4080, support: 3885
Four-hour chart resistance: 4060, support: 4020
One-hour chart resistance: 4047, support: 4020
Gold News Analysis: Heightened geopolitical and economic uncertainty, coupled with market expectations of a US interest rate cut, have prompted investors to flock to safe-haven assets. This gold boom is driven by a multi-pronged force. The Federal Reserve's monetary policy shift has been the strongest driver. With the US government shutdown and the release of key economic data stalled, market expectations for a rate cut have intensified. Futures contracts indicate that traders are betting with an over 80% probability that the Fed will announce a 25 basis point rate cut at this month's meeting, followed by another similar cut in December.
Gold Trading Recommendations: Based on the four-hour chart, key support levels remain at 4020 and 4000. Upside pressure is at 4047, with buying opportunities awaiting a pullback to support levels. (Selling is risky, so try a small size.)
Buy: 4020near
Buy: 4000near
Sell: 4047near