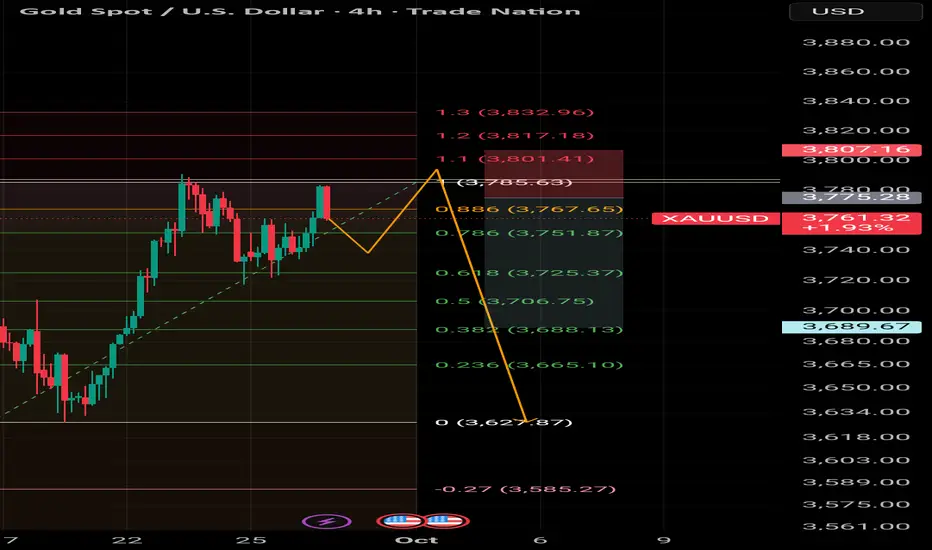
Gold Buys And downside levelsI’m expecting gold to go down a bit and get buy orders , if it goes down I’m expecting it to retrace down to 3650 this much retracement is normal in gold as it’s extremely volatile.
Selling these levels are also quiet easy if you see candle close below these levels sell and Target next downside level. For buying never buy directly wait for bullish candle to close above rejection candle for solid buys. And as it’s gold always expect the unexpected it might not go down to 3650 and we can even see 3800 before going down to get buy orders so trade safely , I’ll keep updating my entries here everyday.
Plus always keep eye on Trendlines
GOLD trade ideas


Gold Enters a Turbulent Phase
In my previous analysis , I noted that OANDA:XAUUSD COMEX:GC1! COMEX_MINI:MGC1! was preparing to break out of a prolonged re-accumulation phase (April–August 2025). This scenario has played out: the market confidently broke above the upper boundaries of the range.
At the moment, the price is most likely completing wave 3 of the impulse, which has shown a classic extension (~2.618 of wave 1).
Next, I expect a correction in the form of a triangle or a flat correction (lasting 2–3 weeks). During this period, the volume accumulated below will be redistributed, followed by one more final upside climax.
The local wave count may look like this:

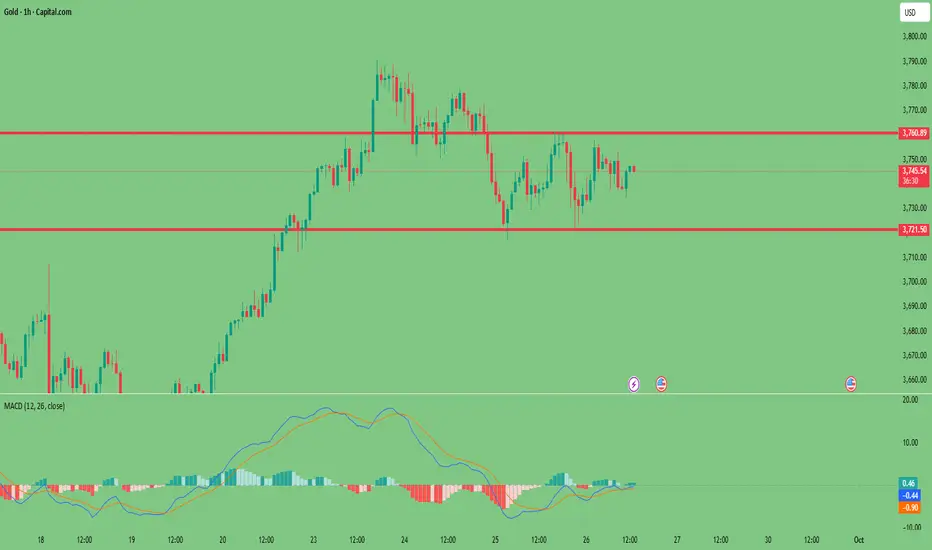
3717 Won’t Hold—Gold’s Next Breakdown AheadThe highest point of gold during the day was around 3761. It can be clearly seen that as the bullish momentum of gold gradually declines, the high point of the candlestick chart is also gradually moving downward. Judging from the daily candlestick chart, a bearish candlestick chart appeared for the second consecutive day today, and it is very likely to close in a doji pattern, suggesting that gold is likely to continue to fall.
From the perspective of short-term morphological structure, gold has currently perfectly constructed a downward trend channel based on the wave top areas of 3790, 3778 and 3761; and upper shadows appear on many candlestick charts, suggesting that the selling pressure from above is relatively large, and the center of gravity continues to move downward and test the lower support area many times. Based on the current structure, 3717 is likely not the current low, and gold will continue to fall. The upper short-term resistance is in the 3750-3760 area; the lower support is in the 3715-3705 area, followed by the 3695-3690 area.
Therefore, for short-term trading:
1. Prioritize waiting for a gold rebound and then continue shorting gold within the 3750-3760 area; the short-term target is 3725-3715.
2. If gold first retreats to the 3715-3705 area, we can take advantage of the initial pullback and go long gold in that area, with the short-term target being 3730-3740.

XAUUSD 4H🔹 Overall Outlook and Potential Price Movements
In the charts above, we have outlined the overall outlook and possible price movement paths.
As shown, each analysis highlights a key support or resistance zone near the current market price. The market’s reaction to these zones — whether a breakout or rejection — will likely determine the next direction of the price toward the specified levels.
⚠️ Important Note:
The purpose of these trading perspectives is to identify key upcoming price levels and assess potential market reactions. The provided analyses are not trading signals in any way.
✅ Recommendation for Use:
To make effective use of these analyses, it is advised to manually draw the marked zones on your chart. Then, on the 15-minute time frame, monitor the candlestick behavior and look for valid entry triggers before making any trading decisions.

Will Gold Break Higher Toward 3740?Gold continues to show strength on the 4H chart, with buyers holding price action above key moving averages. The market recently broke out of a consolidation phase, signaling potential for further upside movement.
Key Levels:
Buy Entry Point: 3710
Take Profit: 3740
Stop Loss: 3690
Reasoning:
Gold has shown strong bullish momentum, bouncing above the moving averages and breaking short-term consolidation. This setup suggests continuation toward the next resistance zone around 3740. Placing the stop loss at 3690 provides downside protection just below the support level, while targeting 3740 captures the upside potential within the swing move.
Disclaimer:
This analysis is for educational purposes only and not financial advice. Markets are volatile—always manage risk and trade according to your own strategy.

Xauusd update short Entry near 3,739 – 3,740 (resistance).
Stop loss around 3,751 – 3,752 (above resistance).
Take profit near 3,700 – 3,710.
→ That gives around 1:3 R:R ratio, which is favorable if bearish momentum kicks in.

Gold Bull Flag and new ATHsBullish Signs are showing a high probability of new All Time Highs around 3800. Let's ride the trend till the wheels fall off.

Getting prepared to short Gold Gold has enjoyed a massive ride for weeks let's make some profit with the potential pull back...... Goodluck
Xauusd: risky move again the flow At this point, jumping in to short gold clearly isn’t the wisest move. However, I find the RSI signal pretty tempting. RSI has already made 3 consecutive peaks above 70. Meanwhile, MACD looks like it’s about to bump into the signal line for a little showdown.If it drops and breaks below 70, this short setup could be quite rewarding. I’ll enter according to the setup shown in the chart. And since I know better than to get delusional with the market, I’ll go in with a very small position size—just in case the market decides to smack me hard.

Gold May Retest 3800 — How to Trade It?Today, gold pulled back to the 20 area and formed a short-term bottom confirmation on the 30M chart with several long lower wicks.
Next, watch the 58 resistance. If price breaks and holds above, bulls will gain a clear advantage, with a likely move to test 3800.
During this move, the 72–77 zone may provide resistance, but strong bullish momentum is likely to break through it.
If gold reaches around 3800 and pulls back, this level will become a new support zone.

XAUUSD Intraday Update – 26 Sept 2025🟡 XAUUSD Intraday Update – 26 Sept 2025
Gold has broken out of a bullish flag pattern, confirming continuation of the uptrend.
🔹 Key Levels:
Support: 3750 – 3729 (flag base & breakout retest)
Resistance: 3780 – 3834
Major Target: 3892 (measured flag projection & Fib 3.618)
Technical Outlook:
Price Action: The breakout above the flag consolidation signals strong bullish momentum.
Measured Move: The projected target from the flag aligns with 3830 → 3892.
Market Bias: As long as price holds above 3750, buyers remain in control.
📌 Bias: Bullish.
📌 Targets: 3830 → 3892.
📌 Invalidation: Break back below 3729 would weaken the bullish flag setup.

Should I go long or short at this time? Please read this articleToday's market trend is basically consistent with previous analysis views. The gold price stabilized and rebounded after hitting a second bottom at around 3720. Investors who previously established long positions near this level have realized substantial profits, successfully reaching their pre-set profit target of 3750 a few hours ago. I have already re-established a long position near 3730.
Since Tuesday's breakout, the market has been fluctuating and consolidating between 3760 and 3720, reflecting the ongoing tug-of-war between bulls and bears in this area. For traders, this type of range-bound market has more operational advantages than a unilateral trend. It not only provides opportunities for long orders, but also creates space for short orders, which is conducive to obtaining stable trading profits.
From a short-term technical perspective, we need to focus on the key resistance levels of 3750 and 3760. If the price effectively breaks through the above positions, it may open up further upside space. If gold prices pull back to the 3735-3725 range without a clear breakout, traders who are not already holding positions should consider establishing long positions in this area in batches.
Trading Strategy:
Buy Range: 3725-3735
We welcome your insights or questions regarding market trends or specific trading strategies. Leave a comment in the comments section to discuss future market trends and strategies.
XAUUSD - Gold Buyshort term buy trade
Breakout and reentry out of zone
5 min closure back in zone and imediate buy look for 1:1.5 RR

#GOLD WILL THE correction continue ATHResistance level:3760-3776-3791
Support levels:3752-3741-3731i expect a pullback 3737-3717 and if the bulls return the price to 3800.
my forecast on #gold is 3880.
By; Honey-trading!

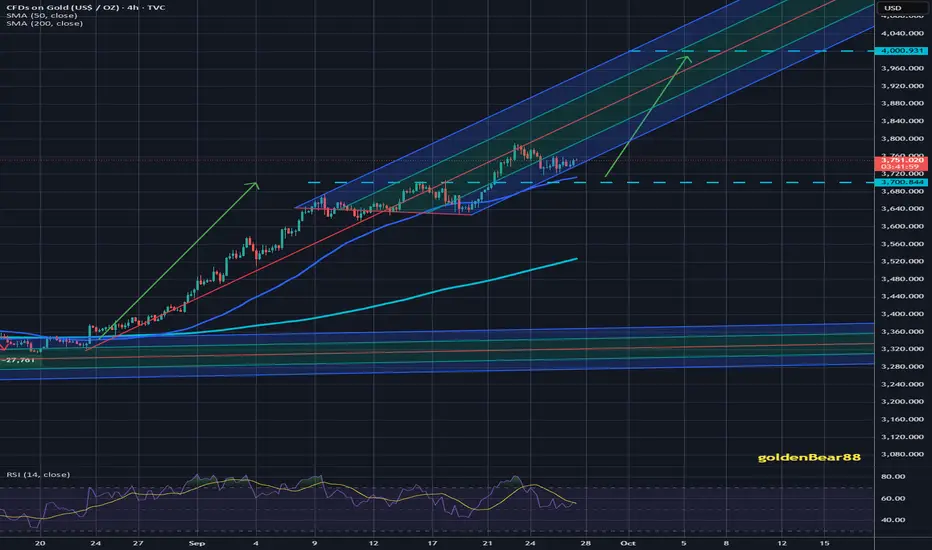
Gold Targeting #4,000.80 markTechnical analysis: The #3,745.80 former hard Resistance now turned in Support is now crossed and Gold is now Technically ready to accomplish new local High’s. Personally, I am surprised that Gold didn't re-tested #3,700.80 mark on renewed DX strength as it was fair to expect it both Fundamentally and Technically. Gold recovered #3,732.80 - #3,757.80 without any catalyst (strong Hourly 4 chart's series of Bullish candles) which in my opinion wiped out and liquidated many Sellers from the market. This will be essentially a Higher High’s Upper zone first on Ascending Triangle which was created throughout yesterday's session which was invalidated to the upside / validating my expectation of an #10 to #15 point Trading range (Rectangle) on however aggressive pace for the next #1 - #2 session horizon. The (#1W) Weekly candle is now at (# +2.67%) and the week will most likely close on a positive note following last candle's (# -0.67%). I will take advantage of the Lower High’s Lower zone, giving distinguished Buying opportunities within this relief rally / Bullish Intra-week cycle and Profit on wide timeframes for reduced Risk. Traders have to realize that Trading against Gold’s Hourly 1 and 4 charts should backfire sooner or later. I am looking at #3,762.80 / #3,778.80 / #3,782.80 and / #3,792.80 test initially as I do expect that Trading will be performed widely above #3,800.80 benchmark mid next Monty as even strong DX didn't managed to deliver more serious decline on Gold. #3,722.80 benchmark however is next strong Support and break of the configuration will negate Short-term Bullish potential. I am very satisfied with my Bullish stance and Profits I am making on Intra-day basis even though I am well known Seller of the market (I have to adjust to the trend). Needless to mention, I do expect and preserve my #4,000.80 mark as my Medium to Long-term Target. Enjoy the Profits and have a great weekend!
Daily Plan: What’s Next After the All-Time High Correction?📊 Market Context
Gold is struggling to recover from yesterday’s pullback after hitting a record high at 3791 USD/oz. In the Asian session on Thursday, price action remains cautious as traders await U.S. mid-tier data and further speeches from Fed officials for fresh momentum. While the long-term trend remains bullish, the current pause highlights how sensitive gold is to short-term liquidity sweeps and macro catalysts.
🔎 Technical Analysis (H1/H4)
ATH zone sits at 3791, with sellers reacting strongly from that level.
Price is currently trading below the downtrend reaction zone 3755–3757, showing near-term weakness.
Buy-side liquidity remains intact at 3712 and deeper at 3688–3686 (CP + OBS Buy Zone).
Sell-side liquidity zone identified at 3775–3777, likely to attract reactions if retested.
Larger liquidity magnet lies at 3824–3830, but only if bulls regain momentum above 3777.
🔑 Key Levels
Resistance / Sell Zones: 3775–3777 - 3791 - 3824–3830
Support / Buy Zones: 3712 - 3688–3686
📈 Scenarios & Trading Plan
✅ BUY ZONE (Main Setup): 3688–3686
SL: 3680
TP: 3696 - 3700 - 3705 - 3710 - 3720 - 3730 - …
✅ SELL ZONE (Liquidity Reaction): 3775–3777
SL: 3782
TP: 3770 - 3765 - 3760 - 3750 - 3740 - 3730 - …
⚠️ Risk Management Notes
Stay alert for false breakouts around 3775–3777, as price may sweep liquidity before reversing.
Avoid chasing entries mid-range; wait for price action confirmation in the buy/sell zones.
U.S. data and Fed commentary could trigger volatility spikes — adjust risk accordingly.
✅ Summary
Gold is consolidating after its record high at 3791, with traders waiting for new catalysts. The plan today: buy dips at 3688–3686, targeting a recovery towards 3720–3730, while looking for short-term sells at 3775–3777 if rejection occurs. A break above 3777 would re-open the path towards 3824–3830.
📢 Follow MMFLOW TRADING on TradingView for real-time liquidity setups and BIGWIN strategies as gold approaches its next critical levels.

Bullish Pennant in Gold* Gold is showing off a Bullish Pennant on the 4H chart – a classic continuation pattern formed after a strong rally (the flagpole).
* That means, after a short consolidation, Gold could be gearing up for another breakout toward new all-time highs
- For me, it's the "calm before the next storm" – and if the pattern successfully carries out, then we may see bulls pushing prices above $3,791+.
Keep an eye on the breakout zone, currently testing by gold – the next move could be BIG
What is a Bullish Pennant?
It’s a continuation pattern that forms after a sharp upward move (the “flagpole”). Price then consolidates in a small triangle-like structure (the “pennant”), before often breaking out higher.
Gold recently rallied nearly $180 (from $3,610 to $3,790) before pausing into a pennant-shaped consolidation on the 4H chart.
Why it matters here?
The flagpole in Gold is approx. $180.
If the pattern breaks above $3,791–$3,800, the typical projection is another $150–$180 upside.
That sets a potential target around $3,950–$3,980.
Note: While this is a textbook pattern, breakouts are not guaranteed. Traders watch for confirmation with volume and momentum indicators.

Elliott Wave Analysis XAUUSD – September 26, 2025
________________________________________
🔹 Momentum
• D1: Currently decreasing → the corrective trend is likely to continue. It may take about 2 more D1 candles for momentum to enter the oversold zone, after which a reversal could occur.
• H4: Momentum is rising → today we may see a bullish move or sideways range.
• H1: About to enter the oversold zone → a short-term bullish reversal is likely.
________________________________________
🔹 Wave Structure
• D1:
o As analyzed previously, wave 5 (yellow) has already reached its first target at 3789.
o It may take around 2 more D1 candles for momentum to enter oversold → showing that the bearish leg is weakening.
o Considering depth and time, the market is likely within wave 4 of wave 5. Once the correction completes, the uptrend should resume toward the second target.
• H4:
o A WXY corrective structure is developing.
o The ABC (blue) has completed wave W → the market may now be in wave X, followed by a Y-wave decline to finish the correction.
• H1:
o Wave X appears to be forming a triangle, currently in the final wave e.
o However:
If price rises sharply above 3762, it would suggest the corrective phase is already completed.
The target area for wave e is around 3752 → potential Sell zone.
If price breaks below 3729, it confirms wave Y is in play, targeting 3713 and 3698 → potential Buy zones.
⚠️ Note: If the Buy target is reached first, the Sell setup will be canceled.
________________________________________
🔹 Trading Plan
🔻 Sell Zone
• Entry: 3751 – 3753
• SL: 3761
• TP: 3729
________________________________________
🔺 Buy Zone 1
• Entry: 3714 – 3712
• SL: 3704
• TP: 3751
________________________________________
🔺 Buy Zone 2
• Entry: 3699 – 3696
• SL: 3686
• TP: 3751

adjustment reduction, liquidity 3730⭐️GOLDEN INFORMATION:
Gold (XAU/USD) steadies near $3,760 in Wednesday’s Asian session after pulling back from a record $3,791. Expectations of further Fed rate cuts and safe-haven demand continue to underpin the metal. Fed Chair Jerome Powell noted the “challenging” balance between inflation risks and a weakening labor market, signaling readiness to ease policy further if needed. Markets now price in two additional 25 bps cuts this year, in October and December, which would lower the opportunity cost of holding non-yielding Gold.
⭐️Personal comments NOVA:
correction down, accumulation and continue to increase price towards 3800
⭐️SET UP GOLD PRICE:
🔥SELL GOLD zone: 3800- 3802 SL 3807
TP1: $3790
TP2: $3780
TP3: $3770
🔥BUY GOLD zone: $3730-$3728 SL $3723
TP1: $3740
TP2: $3750
TP3: $3760
⭐️Technical analysis:
Based on technical indicators EMA 34, EMA89 and support resistance areas to set up a reasonable SELL order.
⭐️NOTE:
Note: Nova wishes traders to manage their capital well
- take the number of lots that match your capital
- Takeprofit equal to 4-6% of capital account
- Stoplose equal to 2-3% of capital account

Gold Energy build up supported at 3703The Gold remains in a bullish trend, with recent price action showing signs of a continuation pause within the broader uptrend.
Support Zone: 3703 – a key level from previous consolidation. Price is currently testing or approaching this level.
A bullish rebound from 3703 would confirm ongoing upside momentum, with potential targets at:
3785 – initial resistance
3800 – psychological and structural level
3820 – extended resistance on the longer-term chart
Bearish Scenario:
A confirmed break and daily close below 3703 would weaken the bullish outlook and suggest deeper downside risk toward:
3670 – minor support
3640 – stronger support and potential demand zone
Outlook:
A bullish bias remains intact while the Gold holds above 3,703. A sustained break below this level could shift momentum to the downside in the short term.
This communication is for informational purposes only and should not be viewed as any form of recommendation as to a particular course of action or as investment advice. It is not intended as an offer or solicitation for the purchase or sale of any financial instrument or as an official confirmation of any transaction. Opinions, estimates and assumptions expressed herein are made as of the date of this communication and are subject to change without notice. This communication has been prepared based upon information, including market prices, data and other information, believed to be reliable; however, Trade Nation does not warrant its completeness or accuracy. All market prices and market data contained in or attached to this communication are indicative and subject to change without notice.

Gold breaks records and tops out: Where next?Gold achieved a historic breakthrough to $3,759 per ounce, potentially driven by an unusual "barbell strategy" where investors simultaneously bought risk assets while hedging against systemic risks.
On the one hand, continued expectations for two additional rate cuts by year-end supported non-yielding assets. On the other hand, political uncertainty increases as Trump prepares to meet with lawmakers on funding proposals. The probability of a Gov shutdown approaches 70% by October 1st, which would force the FOMC into a 'blind' meeting in October.
Technicals
The short-term setup shows a double top formation at $3,759, suggesting potential consolidation rather than immediate continuation.
Resistance Levels : $3,800 is a critical resistance, both a Fibonacci extension cluster and a psychological level
Support Levels :
Immediate support at $3,740 (breakout confirmation level)
Secondary support at $3,700-$3,730 (previous consolidation zone)
Deeper pullback potential to $3,673 (61.8% Fibonacci retracement)
Wave Structure : Elliott waves suggest completion of a potential Wave 3, with consolidation expected before a possible fifth wave extension toward $3,785-$3,800
Forward Outlook
The setup favours consolidation over the remainder of the week, with key events including Fed Chair Powell's speech and Friday's PCE inflation data serving as potential catalysts for the next directional move.
The momentum divergences suggest limited downside risk from current levels, making any pullback toward $3,700-$3,740 a potential buying opportunity for the anticipated final leg higher toward the $3,800 resistance zone.
Risk management remains crucial given the proximity to potential reversal levels and the unusual nature of gold's correlation with equity strength.
This content is not directed to residents of the EU or UK. Any opinions, news, research, analyses, prices or other information contained on this website is provided as general market commentary and does not constitute investment advice. ThinkMarkets will not accept liability for any loss or damage including, without limitation, to any loss of profit which may arise directly or indirectly from use of or reliance on such information.

Xauusd sell
"I believe the gold uptrend needs a period of recovery and consolidation before regaining strength."
