Gold longGold made a steep pullback from that all time high, time to take some profits and aggregate more liquidity. Currently we're seeing a strong rejection, invalidating the latest bearish impulse.
With the FEDs interests rates coming up I have no doubt that the price of gold will be going up again heading towards a new ATH.
Trade ideas

XAUUSD: Gold Battles the Key 4000 ZoneXAUUSD: Gold Battles the Key 4000 Zone
Hey everyone! Let's dive into Gold (XAUUSD) on the 4-hour chart, where we've seen some dramatic moves recently.
What We've Seen:
Gold made a strong run earlier in the month, but was firmly rejected twice at the 4400 mark, forming a clear "Double Top" pattern (marked with red circles). This led to a significant pullback, pushing price down through several support levels.
Currently, Gold has found some footing after hitting a low and is now attempting to recover.
The Current Battleground: 4000 Key Zone
Price is currently retesting the crucial 4000 Key Zone (highlighted in blue). This level acted as support previously, was broken, and is now being challenged again. The immediate task for buyers is to "Observe the price action if it can break the recent swing high" (marked with the purple circle) just below 4000, which has been acting as immediate resistance.
Scenario 1: Bullish Reclaim & Push Higher (If 4000 Holds Strong)
If Gold can successfully reclaim and hold above this 4000 Key Zone, it would be a strong bullish signal. This could open the door for:
A push towards the 4150 to 4250 1st Resistance zone, where sellers might step in again.
A more sustained recovery attempt, potentially aiming higher if that resistance is overcome.
Scenario 2: Rejection & Further Downside (If 4000 Proves Too Strong)
However, if the 4000 Key Zone acts as strong resistance and Gold fails to break above that recent swing high, we could see:
A reversal back towards the 3900 Immediate Support level.
Should 3900 fail to hold, the next significant support would be the 3800 to 3850 Next Support area.
In Summary:
The 4000 Key Zone is the pivotal point right now. Watch how price reacts here and whether it can overcome that immediate swing high resistance. This will largely dictate Gold's direction in the short term.
Disclaimer:
The information provided in this chart is for educational and informational purposes only and should not be considered as investment advice. Trading and investing involve substantial risk and are not suitable for every investor. You should carefully consider your financial situation and consult with a financial advisor before making any investment decisions. The creator of this chart does not guarantee any specific outcome or profit and is not responsible for any losses incurred as a result of using this information. Past performance is not indicative of future results. Use this information at your own risk. This chart has been created for my own improvement in Trading and Investment Analysis. Please do your own analysis before any investments.

XAUUSD SELL IDEAPrice falls below the $4,000 level. It calls for possible short sell. I’m looking forward to selling XAUUSD from the current market price. Therefore a sell opportunity is envisaged.

Gold Recovers 1000 Pips Ahead of FOMC: Key Levels in Focus📊 Market Overview
After a sharp selloff that shook long positions, Gold has rebounded nearly 1000 pips, recovering from the 388x area toward 398x ahead of the upcoming FOMC meeting.
Despite the short-term recovery, Gold remains down around 3.5% this week, reflecting cautious sentiment as traders reposition before the Fed decision and amid fading U.S.–China trade tensions.
Currently, price is trading near $3,980–3,990 during the Asian session, consolidating under the psychological $4,000 zone.
💎 Technical Outlook (H1–M15)
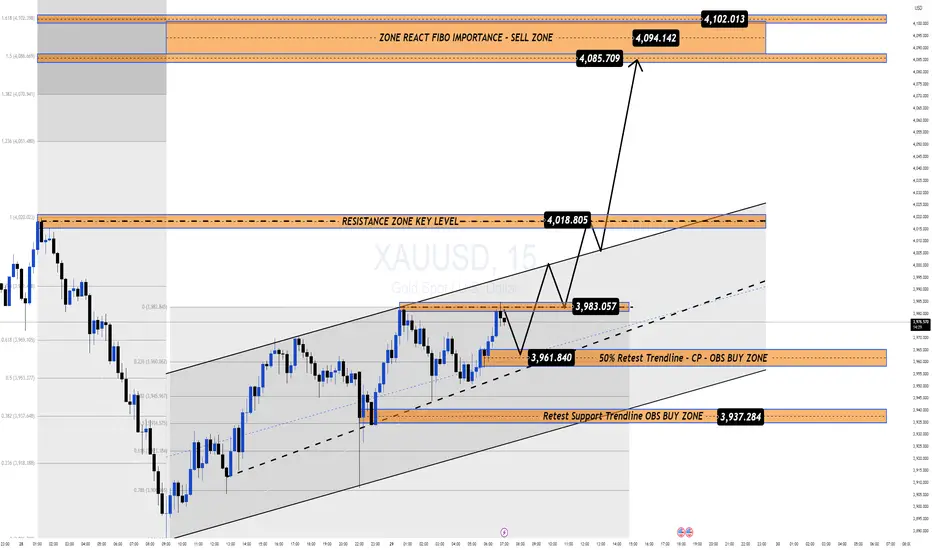
Gold continues to trade within a short-term ascending channel, forming a corrective recovery inside a broader downtrend.
Immediate Support Zones:
• 3,961 – 3,937 → Trendline retest & OBS Buy Zone
• 3,918 → Structural invalidation area
Resistance & Key Reaction Levels:
• 4,018 – 4,085 → Mid-term key resistance
• 4,094 – 4,102 → Major Sell Zone (Fibo 1.5–1.618 confluence)
📍If Gold breaks and holds above 4,018, momentum could extend toward 4,085 – 4,102, where strong selling pressure may reappear.
📍If the price rejects at 4,094 – 4,102, expect a corrective move back toward 3,961 – 3,937, aligning with the channel base and trendline retest.
🌍 Macro Context – FOMC Ahead
Markets expect the Fed to cut rates by another 25bps, following September’s “risk management” cut.
However, if Powell’s tone turns hawkish, Gold could face renewed downside pressure as rate-cut expectations fade, particularly for December.
Conversely, a cautious or dovish tone emphasizing inflation risks and slower growth could boost Gold above $4,100 in the short term.
Meanwhile, easing trade tensions between the U.S. and China and the ongoing equity rally may continue to limit safe-haven demand.
🧭 Summary
Gold is holding a short-term recovery bias, yet the medium-term trend remains fragile ahead of the FOMC.
Expect volatility around the 4,000–4,100 zone, with the Fed statement likely to set the next major direction.
🛡️ Stay patient — liquidity builds before clarity, and key reactions around $4,094–4,102 will reveal the next macro impulse.
GOLD XAU/USD 1H Techenical outlook double bottom 📉 GOLD (XAU/USD) 1H Technical Outlook ✨
⚙️ Pattern Update:
Price forming a Double Bottom 🟢 & showing signs of a Descending Channel Breakout 💥
📊 Buying Zone (Support Levels):
🟩 3950
🟩 3920
🟩 3896
👉 Wait for a bullish confirmation candle before entering long positions! 🔥
🎯 Resistance / Target Levels:
🎯 4014
🎯 4044
🎯 4075
💡 Strategy:
✅ Wait for confirmation 📈
✅ Follow strict Risk Management ⚖️
✅ Trade with patience & discipline 💪
📢 Like 👍 | Comment 💬 | Follow 🔔 | Share 🔄
Let’s trade smart — not emotional! 🧠💰

Today's gold trading strategyExpectation of policy easing "stable with growth": Despite the presence of hawkish voices within the Federal Reserve, core officials have expressed clear signals of easing measures - the President of the St. Louis Federal Reserve, Musalem, explicitly stated that if there are further risks in the labor market, he might support another rate cut. More importantly, the probability of a rate cut at the October 28-29 interest rate meeting remains above 90% in the market. This policy expectation provides a solid support for gold. As an interest rate-sensitive asset, gold's attractiveness will continue to rise in an environment where the easing expectation is clear.
Today's gold trading strategy
xauusd @buy4060-4080
TP:4110-4130-4200
SL:4040

Gold Extends Decline Below $4,000 as Risk Appetite Returns🔍 Market Context
Gold continues to struggle amid renewed optimism around US–China trade talks.
The shift in sentiment has reduced safe-haven demand, while softer expectations of further Fed rate cuts keep the US Dollar capped — offering limited downside support for XAUUSD.
However, the technical landscape remains clearly bearish.
The break below the $4,000 handle confirms continuation of the downtrend first outlined in early-week plans.
📊 Technical Analysis
Structure: Gold maintains a clean bearish channel on the H1–H4 frame.
Immediate resistance: $3,985 – $4,000 (former support, now supply zone).
Target zones:
• Short-term liquidity area near $3,925–$3,930
• Extended target sits around $3,880–$3,860, aligning with Fibo 1.618.
Invalidation: Only a sustained break and hold above $4,020–$4,030 would neutralize this short-term bearish bias.
🎯 Trading Outlook
If gold retests the broken $4,000 zone and fails to regain it,
expect sellers to extend control toward $3,920 or lower ahead of the FOMC meeting.
That event may later define the next recovery point — but for now, momentum remains firmly on the downside.
⚜️ Summary
Gold’s recent slide isn’t random — it’s structural.
The market is rebalancing after excessive bullish sentiment,
and liquidity below $3,900 is likely to attract attention before any significant rebound.
Watch the reaction near $3,920–$3,880 —
that’s where the next meaningful decision for gold may emerge.
📊 MMFLOW TRADING Insight:
“Smart money doesn’t chase candles — it waits for liquidity to shift.”

It’s Not Just a Chart, It’s a Mind Game — Stay Calm, GoldRiders.First of all — congratulations to everyone who followed yesterday’s setups!
We sold in the morning and made profits, then bought during the U.S. session — and won again.
Even though the technical analysis was pointing opposite to the news direction, price movement proved once more that the chart often leads before headlines.
Some followers were confused when I mentioned the news was positive for the dollar — which normally means gold should fall — yet buyers secured safe profits above 3938. That was a wise move reflecting good risk control.
Despite the positive Richmond Manufacturing Index and Consumer Confidence data (both supportive for USD), gold respected the technical levels more than fundamentals.
This is normal, as low to medium-impact data rarely outweigh technical setups, unlike major events such as interest rate decisions, which can override technical signals completely.
From the chart:
After dropping from 4019 early yesterday to 3886 around noon, gold reversed and started forming a higher high.
Currently, any dip below 3945 signals minor weakness, below 3928 indicates stronger bearish pressure,
and a confirmed breakdown happens only under 3898–3883.
On the upside, strong resistance persists between 3970–3983, tested since last evening.
A breakout above it could open the way to 4017–4020.
Important Warning:
Today is high-risk.
Expect volatility not only during the FOMC rate decision at 9:00 PM and Jerome Powell’s speech at 9:30 PM,
but possibly much earlier — the “volatility show” can start anytime.
So please trade cautiously.
If you’re new, still learning, or your emotions or account size can’t handle sharp swings —
sit out today and observe.
For learners, use a demo account as if it’s real — that’s one of the best lessons you’ll ever get.
Also note: Meta, Microsoft, and Alphabet (Google) will release earnings today — adding even more volatility.
Bullish Scenario (Buy)
Entry: Safe entry above 3983 (aggressive from 3967)
Targets: (3972–3976) – 3982 – 3994 – 4000 – (4007–4012) – 4021 – 4031 – 4046 – 4055 – 4064 – (4072–4077) – 4084 – 4097 – 4103 – 4117
Don’t feel safe with any buy before breaking 3983. The next key resistance is 4020.
Bearish Scenario (Sell)
Entry: Safe entry below 3928 (aggressive from 3938)
Targets: (3932–3930) – 3922 – 3913 – 3906 – 3901 – 3895 – 3887 – 3873 – (3860–3856) – 3842 – 3821 – 3813 – (3804–3800) – 3793
Notes:
1- This page doesn’t engage with sarcastic or disrespectful comments — if you don’t like the post, just scroll.
Professional discussions are always welcome.
2- If you found this analysis useful, share it — your support makes a real difference!
✍️ We appreciate it, if you drop a comment if you received the analysis clearly.
Disclaimer:
This analysis reflects my personal opinion and market observation only.
It is not investment advice or a buy/sell recommendation.
Trading in financial markets involves high risk, and all decisions remain the trader’s responsibility.
ANFIBO | XAUUSD - Soboring today [10.30.2025]Hi traders, I'm here, Anfibo.
XAUUSD Analysis – Daily Trading Plan
Trading Plan for Today:
>>> SELL ZONE:
ENTRY: 4135 - 4150
SL: 4165
TP: 4045 - 4010 - 4000
>>> BUY ZONE:
ENTRY: around 3935
SL: 3915
TP: 4020 - 4080 - 4135 - ...
Risk Management:
- Prioritize Buy setups following the higher-timeframe trend; Sell only for intraday scalps.
- Maintain a minimum Risk:Reward ratio of 1:2.
- Avoid entries during major geopolitical or economic announcements.
- Monitor the Head & Shoulders pattern closely — confirmation will guide the next major move.
Conclusion:
Gold has completed a healthy correction after its parabolic surge to $4,400, and the market is now regrouping around the $4,000 zone, with early signs of renewed bullish momentum. As long as $3,890 remains intact, the broader trend remains bullish, and I expect a potential rebound toward $4,200 in the near term.
GOODLUCK, LOVE U GUYS!

GOLD | Daily Analysis #2 - 30 October 2025Hello and welcome back to DP,
Review and news:
Yesterday Gold pulled back slightly from recent highs after strong run-up. According to FXTrendo, it had briefly topped the psychological US$4,000/oz level, then traded around ~US$3,995. Expectations that the Federal Reserve might cut interest rates later this year remain a tailwind, which helps non-yielding assets like gold. Geopolitical uncertainties and safe-haven demand continue to underpin gold’s appeal. In summery gold remains structurally bullish, but near-term momentum is under pressure. The market is in a consolidation/correction phase while waiting for the next catalyst (Fed clarity, inflation prints, major geopolitical event).
1H – 4H Technical Analysis:
As you can observe, the major downtrend broke, the upside moving is feuled up. Demand zones are strong and 3914 zone is still irony. So if price pass and break 4024 area, there is potential to uptrend goes continuously. With analyzing the support and resistance zones, these scenarios are possible: Bearish scenario: If gold fails to reclaim the resistance zone (~4,000 +), and breaks below short-term support (~3,940), then a deeper retracement toward ~3,900 or lower becomes more likely. Bullish scenario: If gold holds above ~3,940-3,900 and the Fed or external shock triggers safe-haven flows, a move back toward ~4,050-4,100 is possible. Neutral to caution: Given the mixed signals (strong overall trend but short-term pullback), many traders may prefer to wait for confirmation (e.g., breakout above resistance or a clean bounce off support) rather than aggressively chase.
Disclaimer:
This content is for informational purposes only and does not constitute financial or investment advice. © DIBAPRISM
Amir D.Kohn

Will gold fall below 3900 again on October 29?
Current Market Characterization: Volatile with a bearish bias. Gold prices have broken below the key psychological level of $4,000, indicating short-term technical weakness. The market is currently caught between long-term bullish fundamentals and short-term factors such as easing geopolitical risks and improved risk appetite. Ahead of the Federal Reserve's interest rate meeting, volatile and range-bound trading is likely to persist.
I. Core Market Logic
Short-Term Bearish Factors:
Technical Selling Pressure: Last week’s significant sell-off has led to further weakness in technical indicators.
Improved Risk Appetite: Signs of easing geopolitical tensions (e.g., trade negotiations) have reduced gold’s appeal as a safe-haven asset.
Break of Key Support: The loss of the $4,000 level (coinciding with the long-term uptrend line) has intensified bearish sentiment.
Medium- to Long-Term Supporting Factors:
Fed Rate Cut Expectations: The market has almost fully priced in a 25-basis-point rate cut in October, with another cut expected in December. This limits the downside for gold prices in the long run.
II. Key Price Levels
Bullish Defense Line: $4,020
If gold fails to reclaim and stabilize above this level, the short-term bearish trend is likely to continue.
Core Resistance Zone: $3,970 - $3,990
This area, formed by the 5-day and 10-day moving averages, serves as a strong short-term resistance zone and an ideal entry point for short positions.
Support Zone: $3,880 - $3,890
This is the current near-term key support band. If gold stabilizes here, a technical rebound may occur.
Breakdown Target:
If the $3,880 - $3,890 support band is decisively broken, bears will likely test lower support levels.
III. Intraday Trading Strategy
Primary Approach: Prefer selling on rallies, with light long positions at key support levels as a secondary strategy.
Short Strategy (Primary):
Entry Timing: Wait for gold to rebound to the $3,970 - $3,990 resistance zone and show signs of rejection before entering short positions.
Profit Target: Initial target at the $3,900 - $3,910 support band. Secondary target at $3,870 - $3,880.
Stop Loss: Place above $4,000.
Long Strategy (Secondary):
Entry Timing: If gold retraces to the $3,880 - $3,890 support band and shows signs of stabilization or reversal on shorter timeframes (e.g., 1-hour/4-hour charts), consider entering light long positions.
Profit Target: Aim for $3,950 - $3,970.
Stop Loss: Place below $3,870.
IV. Trading Discipline and Risk Warnings
Follow the Trend: As long as the price remains below $4,020, the overall strategy should favor selling on rallies rather than attempting to buy the dip against the trend.
Exercise Patience: Only execute trades when prices approach key resistance or support levels. Avoid impulsive trading in intermediate ranges and refrain from chasing the market.
Strict Risk Management: Market sensitivity is heightened ahead of the Fed meeting. Always adhere to stop-loss orders to mitigate risks from unexpected fluctuations.

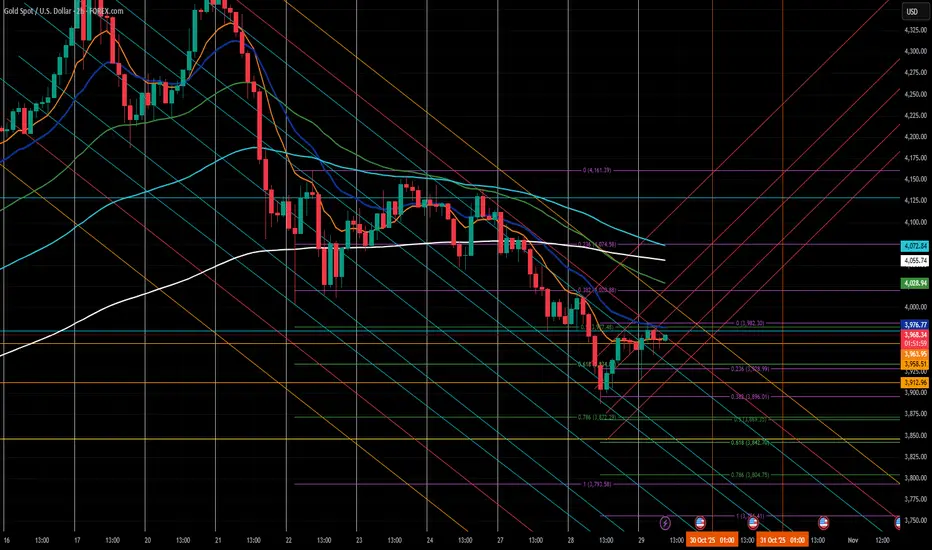
GOLD - DCL TargetsAfter today's monster drop I would like to set some targets for profit taking.
I'm short from 4236$ in this idea:
The first target was the 200 EMA at 4129$. If you are happy with the 120$ drop in 2 days you just take profits and find the next trade.
If you want a bit more you can wait for the DCL.
I think we still have 140-150$ minimum more to drop as the DCL is forming at or below the Fibonacci 38.2 level. So minimum 3974 will be tagged at the DCL. The Fibonacci 50.0 is also not off of the table at 3848$.
These kind of DCLs usually last for 5-6 days , so you can wait till next Tuesday or Wednesday before you close the short position. Don't forget 29th October FOMC, so I suggest to close Wednesday the latest . FOMC meetings can cause lots of volatility in the gold market...
I'm also watching the 6 RSI and the Slow Stochastic to get oversold.
These are the main parameters for me to take profit:
I will not hold the position during the Wednesday FOMC meeting, if we tag 3848$ before next Wednesday I will close immediately. Otherwise I wait for the RSi 6 and SlowSToch to get oversold at around 3974$.

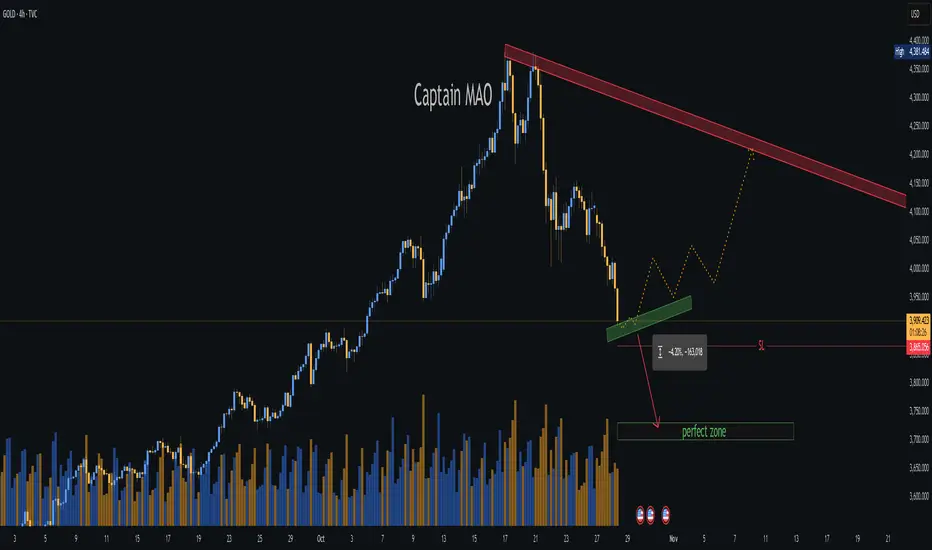
GOLD (XAUUSD) is ready to drop again! Gold has broken below a very strong support trendline which held the price for many weeks. It then also tried to test a powerful resistance level (the red trendline) but it failed to break through. It is now very likely to head all the way down to the next major support zone (which is the while line drawn below)

GOLD (XAUUSD) | Smart Money Buy Setup from Demand Zone 📝 Description:
Gold is showing a potential reversal structure from the lower demand zone after a liquidity grab near $3,962.
The price is now reacting bullishly from the mitigation block and aiming toward the supply zone at $3,984–$4,019.
Trade Plan:
Entry: From $3,972–$3,975 demand zone (after liquidity sweep)
Stop-Loss: Below $3,962 (structure invalidation)
Target: $4,019 (supply zone / PDH area)
Bias: Bullish – expecting continuation toward previous highs
R:R: ~1:3 setup
If price cleanly breaks above $3,984, expect further continuation to $4,029 (Previous Day High).
A failure to hold above $3,962 would invalidate this bullish setup.

GOLD Will Go Up From Support! Buy!
Here is our detailed technical review for GOLD.
Time Frame: 2h
Current Trend: Bullish
Sentiment: Oversold (based on 7-period RSI)
Forecast: Bullish
The market is testing a major horizontal structure 3,985.10.
Taking into consideration the structure & trend analysis, I believe that the market will reach 4,051.12 level soon.
P.S
Please, note that an oversold/overbought condition can last for a long time, and therefore being oversold/overbought doesn't mean a price rally will come soon, or at all.
Like and subscribe and comment my ideas if you enjoy them!

Gold Under Pressure Sell Setup Near 3975XAU/USD is positioned near 3975, showing potential for a downside move as selling pressure builds and short term bullish momentum fades. If the current resistance holds, the pair could test the next support zone.
Key Levels:
Sell Entry: 3975
Take Profit: 3950
Stop Loss: 3995
Reasoning:
Technically, Gold has stalled near 3975, forming a local ceiling. Price action suggests that sellers may push the pair lower toward 3950.
Fundamentally, gold is facing headwinds from a firm U.S. dollar and rising interest rate expectations. Diminished haven demand and improving market sentiment in risk assets further limit upside potential.
Disclaimer:
This analysis is for educational purposes only and does not constitute financial advice.

xauusd today 💡 What to watch now:
If price spikes above 4020 and then closes below 4010, that would be a classic manipulation wick, potentially followed by a drop.
If the USDX starts breaking above 99.25, that would confirm the short bias on gold.
I’m not entering yet — it looks promising, but we’re still waiting for a clearer picture. Definitely worth keeping an eye on though!

XAU/USD – Make-or-Break Zone Sharp 11% Drop from Record HighBeen asked to analysis GOLD on current market structure
On October 20, 2025, Gold (XAU/USD) recorded a new all-time high at $4,383, marking a historic peak in the current macro cycle. Since then, the metal has retraced sharply by nearly 11%, bringing price action back into a critical decision zone — a true make-or-break level.
This area will define the next major directional leg. A strong bounce from current support could revalidate the long-term bullish structure and initiate another run toward ATH, while a breakdown below this zone may confirm a deeper correction before the next accumulation phase.
xAU-USDThe hourly timeframe of the ANAs
has a downtrend line that must be broken to climb 📊🕯
and next to it, it has created a support level at 3022
So to climb in the ANAs and take a safe long, you should wait for the downtrend line to break 🚨🚀

Chart Analysis (XAUUSD-15 M)🟢 Chart Analysis (XAU/USD – 15M)
Current Price: $3,964
Resistance Zone: $3,980 – $3,983
Support Zone: $3,950 – $3,951
Major Support: $3,910
📊 Technical Outlook:
Price Action:
Gold has rebounded strongly from the $3,910 zone, forming higher lows — a sign of short-term bullish momentum.
Structure:
The chart shows a range-bound pattern between $3,950 and $3,983.
A breakout above $3,983 could trigger a bullish continuation, while rejection here could push the price back toward $3,950 or even $3,910.
RSI Indicator (53.47):
RSI is currently neutral but trending upward — indicating mild bullish strength.
A move above 60 would confirm momentum toward $3,983.
Volume:
Recent candles show increasing volume on bullish moves, suggesting buying pressure is returning.
🎯 Trade Idea (1:1 Risk–Reward Example)
Scenario 1 – Buy Setup:
Entry: Above $3,966
Take Profit (TP): $3,978
Stop Loss (SL): $3,954
Bias: Bullish above $3,960
Scenario 2 – Sell Setup:
Entry: Below $3,950
Take Profit (TP): $3,938
Stop Loss (SL): $3,962
Bias: Bearish below $3,950
🧭 Summary:
Gold is consolidating within a tight range.
➡️ A break above $3,983 will likely open room for upside momentum.
➡️ A drop below $3,950 can shift bias back to bearish, targeting $3,910.
Overall Bias: Neutral to bullish (as long as price holds above $3,950).

GOLD Bounce Incoming?VANTAGE:XAUUSD short-term technicals make it possible. Here’s why:
The downside move already stretched with three impulsive bearish candles, showing an overextended drop.
Price is now sitting right around the trendline + falling channel confluence, which often acts as a reaction zone.
Below, those green FVG/demand blocks remain unfilled meaning the market could grab liquidity from above before revisiting the lower zones.
⚡️A short-term relief bounce can play out first, but the main structure is still bearish unless the market reclaims the upper FVG area with strength.
Price reacting inside the accumulation zone after double CHoCH and unfilled FVG below.
If bulls hold 3,945–3,955, a bounce toward 3,990 → 4,020 remains valid.
Volume shifting blue = early demand confirmation.
Above 4,000 → distribution area may trigger short-term profit-taking.
A close below 3,930 invalidates the setup.
Macro side: Fed’s hawkish tone & rising yields may cap upside,
but weaker USD or risk-off sentiment could fuel the bounce. ⚡️
📊 Daily Outlook (1D)
The long-term trend is still bullish, but after the rejection from 4,300, price is consolidating near the key demand zone around 3,920.
If this level holds, a short-term rebound toward 4,080–4,250 is possible.
However, a daily close below 3,915 could extend the correction down toward 3,820–3,750.
⏱ 1-Hour Outlook (1H)
The medium-term bias remains bearish as price trades below both EMAs.
The 4,000–4,120 region acts as a major distribution/supply zone,
while 3,935–3,950 serves as a short-term accumulation/demand area.
At the moment, gold is ranging between these two liquidity clusters a neutral zone where volatility can expand either way.
💡 15-Minute Outlook (M15)
Price shows a minor recovery move from the lower demand zone.
Liquidity above 3,995–4,015 is the next key target zone.
As long as price holds above 3,940, upside targets sit around 4,015–4,040.
But a new rejection near 4,000 could trigger a retest of the lower accumulation area.
🧭 Overall View
• Mid-term: Trend remains positive, but still in correction phase.
• Short-term: Bounce potential is valid, yet supply pressure sits just above.
• Summary: Accumulation is forming below, distribution remains above best to approach with reactive “confirmation-based” setups from demand zones rather than chasing moves in the middle.

At the moment, D1 and H4 are synchronized — bearish bias. Target
Analysis at 09:00 (UTC +2)
At the moment, D1 and H4 are synchronized — bearish bias.
Target: D1 Fractal.
The continuation of the bearish structure looks logical, but there’s a caveat.
The W1 IMB has been mitigated, and on D1 a lot of liquidity has already been taken.
Considering the aggressive rally since August and the current correction on W1, there’s a high probability that a bullish setup may start forming from the current price level.
However, we have a problematic zone — FTA / D1 IMB.
For confident longs, the price needs to secure a close above this zone.
Until that happens, the short scenario remains valid.
For today:
There’s an H4 bearish BPR, from which we can expect confirmation for a move lower; inside it there’s an AH, which could be a potential entry point.
Asian session narrative: it swept its own liquidity and built a bullish sentiment. The upward move looks strong, so to confirm a short we need bearish confirmation on H1, since the long may still continue.
A local long from the H1 IMB toward AH is possible if the zone gets tested and AH remains intact.
If the price closes above PDH, the bearish scenario will start to lose strength — we’ll need to wait for more information.
Every zone I’ve marked requires additional confirmations on lower timeframes (LTF).
Concept: Smart Money

BUYING GOLD NOW!!!!XAUUSD made a measure breakouts from the internal structure highs and price have already made a pull back am looking forward to see price reclaim back up to 4k again and new high as well
LETS SEE YOUR THOUGHTS ON THIS.....
