GOLD 4H CHART ROUTE MAP Hey Everyone,
This is an extended 4H chart idea, continuing from our previous analysis, now with the added Goldturn levels above, allowing us to continue to track ongoing movement.
After completing the 4212 move, price continued to push upward, leaving a small gap near 4383 before facing rejection. We’re now seeing price retest the lower Goldturn levels for support, with a current test around the 4212 Goldturn. The 4212–4154 zone remains a key weighted area, and as long as price holds above this zone, we may see a potential bounce.
We’ll return on Sunday with our multi-timeframe roadmap and trading plans for the week ahead. Thank you all once again for your continued support, likes, and comments, we truly appreciate it.
Mr. Gold
GoldViewFX
Trade ideas

Gold Consolidation to growth againGold is currently consolidating with a potential bias to the upside. The market is waiting for a breakout from the current consolidation pattern
Recently, price tested the 4265 support level but failed to break below it. This suggests that buyers are still active around this zone. However, price has also struggled to break the immediate resistance, indicating that the market remains in a range for now. If price manages to break above the resistance, it could signal the start of a new bullish move. In this case, the next potential targets would be 4305, followed by 4345.
If price fails to break resistance and forms a bearish rejection candle, we could see another pullback or move to the downside, possibly retesting the 4265 support again.
You may find more details in the chart.
Trade wisely best of Luck,
Ps; Support with like and comments for better analysis Thanks for Support.
Summary:
Gold remains in a consolidation phase, but a confirmed breakout above resistance could lead to further bullish momentum. Traders should monitor price action around 4305 for confirmation before entering new positions.

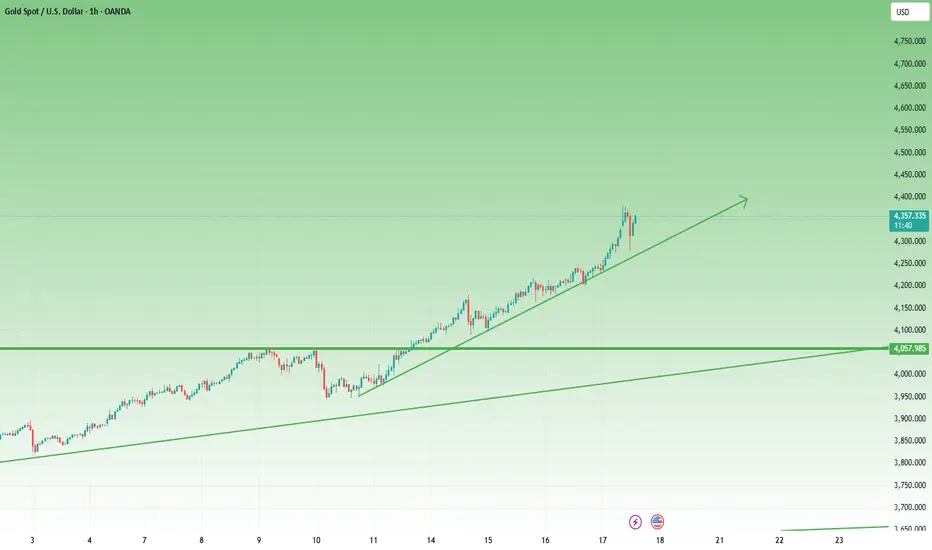
XAU/USD (GOLD) Inverse Head & Shoulder Pattern Bullish Analysis📈 #XAUUSD (Gold) Technical Update 💰✨
Bullish momentum building on the 1H timeframe with an Inverse Head & Shoulders breakout above the 4115 neckline! 🚀
🎯Breakout Level: 4115
💪Pattern: Inverse H&S — bullish continuation
Technical Targets:
TP1, 4156
TP2, 4202
TP3, 4375
As long as price holds above 4115, bias remains bullish 🟢
Keep an eye on volume confirmation and potential retest zones before the next leg up! 🔍
#Gold #XAUUSD #Forex #TechnicalAnalysis #PriceAction #Trading

XAUUSD- Is the Correction Really Over?Yesterday, after revisiting the 4,000 support zone as expected and explained in my previous analysis, Gold bounced strongly and tested the area above 4,100.
That rally delivered around 800 pips profit on my long trade, and now the market is showing a mild pullback, consolidating around 4,085.
The key question now:
Is the overall correction over, or is there still more to unfold?
From a technical perspective, as long as 4,000 remains intact, Gold retains its bullish potential toward the 4,200 resistance zone.
However, I prefer to stay patient at the moment — being flat at the time of writing — and will wait for a potential dip toward 4,050 or slightly below.
If the price shows a positive reaction in that area, I’ll consider re-entering long positions.
Upside targets:
• First: 4,150
• Second: 4,200
Keeping a positive risk-reward balance remains the main priority.

GOLD (XAUUSD): Bullish Market Opening?!
We got a nice pullback on Gold on Friday
and the price nicely retraced to a key intraday support.
Analysing the market reaction to that, I spotted a cup & handle pattern
and a confirmed violation of its neckline.
With a high probability, the market will rise after the opening.
The price will reach at least 4272 intraday resistance.
❤️Please, support my work with like, thank you!❤️
I am part of Trade Nation's Influencer program and receive a monthly fee for using their TradingView charts in my analysis.

Hellena | GOLD (4H): SHORT to support area of 4040.Gold is actively rising and I believe that before the impulse ends we should see the correction that many are expecting.
As of today, I see the completion of the higher order wave “3” and the approaching start of the correction in wave “4”. It makes no sense to put any distant plans in the correction and I think that the support area of 4040 looks quite attractive.
Fundamental context
Gold continues its rally and recently broke new highs, fueled by expectations of U.S. rate cuts, global uncertainty, and safe-haven demand. Central banks are still actively increasing their gold reserves — this structural demand adds support even if price pullbacks occur.
Supply growth is modest — mining output is constrained, and recycling of gold is not enough, which limits the downward pressure on prices.
Given this backdrop, the chance of a correction rises as momentum stretches — but the underlying fundamentals remain favorable for further upside once the correction completes.
Manage your capital correctly and competently! Only enter trades based on reliable patterns!

XAUUSDHello Traders! 👋
What are your thoughts on Gold?
Gold has reached a key support zone after a sharp two-day drop.
From this area, we expect a corrective rebound toward the broken structure.
This retest could complete a pullback phase before the next wave of decline resumes.
A short-term rally toward the resistance zone is likely.
If price shows rejection there, the next downside targets are expected to follow.
As long as price remains below the red resistance zone, the bearish bias remains intact.
Look for bearish confirmation signals on lower timeframes before entering short positions.
Don’t forget to like and share your thoughts in the comments! ❤️

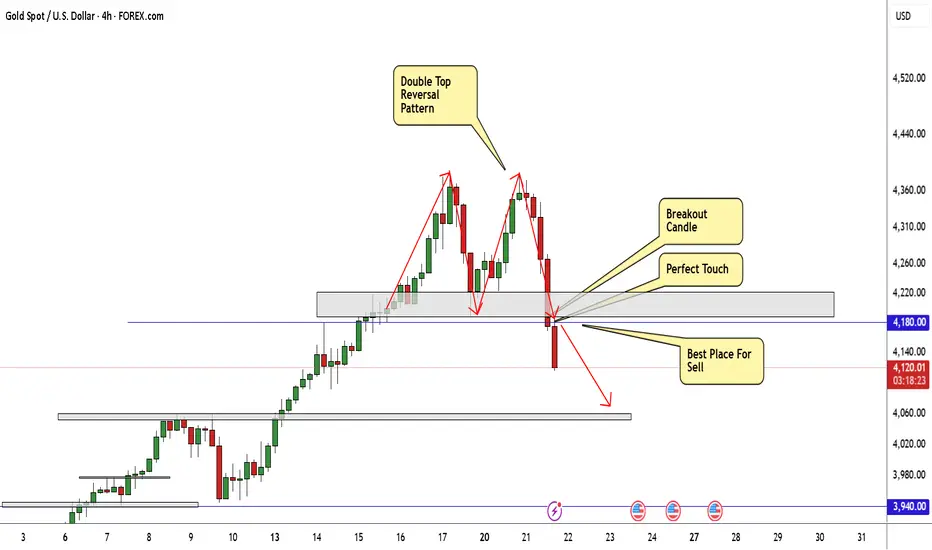
GOLD Finally Made Reversal Pattern , Short Setup To Get 400 PipsHere is my 4H Chart On GOLD , And finally the chart made a reversal pattern The price creating a very clear reversal pattern ( double top) and the price made a very good bearish price action now from good res area so we can enter a sell trade after the price back to retest the neckline to can use a small stop loss and targeting 200 to 400 pips , this is a good bearish movement after this massive movement to upside without any correction , so we will sell this pair for the next weeks .
Gold/Copper Signaling Recession & Market Super bubble!We're continuing to see extreme signals from Gold, and that should raise concerns.
Earlier, I highlighted the Gold/Oil ratio — now, I want to draw your attention to the Gold/Copper ratio:
🔗
Historically, such extreme readings in the Gold/Copper ratio have consistently preceded recessions. The only exception? A period of economic stagnation and sideways markets — not exactly a bullish outcome. See the chart from 2014 to 2016
🔗 www.tradingview.com
Quick recap:
Gold = Fear + Inflation hedge
Copper = Economic strength + Inflation signal
Oil = Similar to Copper; reflects growth and inflation expectations
These divergences aren't random — they’re warning signs of a recession & market Super Bubble that's about to POP!
These are not random fluctuations of prices. You can choose to view them as such. I get it. But from a macroeconomic perspective, this is bad JUJU!
Capitalism without failure is like religion without hell! Remember that!
Click boost, like, and subscribe! Let's get to 5,000 followers! ))

Gold – Madness in MotionGold rose this week — so far (and I really want to stress so far ) — by around 10%. That’s massive by any standard.
On Monday, I tried to catch a dip and missed it. Since Tuesday, I’ve been on the sell side — completely wrong on direction , yet somehow still managed to finish positive overall.
Yesterday my stop got hit, but after what happened overnight, it turned out to be just a scratch. With this kind of volatility, a recovery of 250pips can happen in ten minutes.
Looking at the chart — it’s bullish, no question. Should it be bought? Hmmmm...
Looking at the volatility… for me, it’s become untradeable.
Can it keep going higher? Of course.
How high? Nobody knows.
At this point, any prediction is just throwing numbers in the air.
Trading corrections, as I’ve tried to do, is a guessing game. I’ve had some luck so far, but after yesterday's stop loss, I’m stepping aside.
My take: stay out. Let others make money if they can.
A 1,000-pip rise and an equal reversal — all while I was asleep (and trust me, I sleep very little) — is too crazy. Stops can be wiped for bulls just as easily as for bears.
At some point, it will settle down and define its levels.
Until then — it’s not for me anymore.
Gold Analysis – Volatility Rules the GameYesterday marked another strong bullish session for Gold, as the price completely erased Friday’s losses, confirming that buyers are far from done. Regardless of how high the market has already climbed, momentum remains firmly on the bullish side.
Technically, Gold managed to reclaim and break above the 4285–4300 resistance zone, which triggered a sharp acceleration toward the recent all-time high around 4380.
At the time of writing, the market is undergoing a normal retracement, which is a healthy technical reaction after such an aggressive move. The 4300 area has now turned into key short-term support, and as long as bulls defend this level, the probability of a new ATH remains high.
From a trading perspective, however, volatility has reached extreme levels. This type of price action often favors large players with fundamental reasons rather than discretionary traders. For that reason, I prefer to stay on the sidelines today, waiting for volatility to stabilize before engaging again.

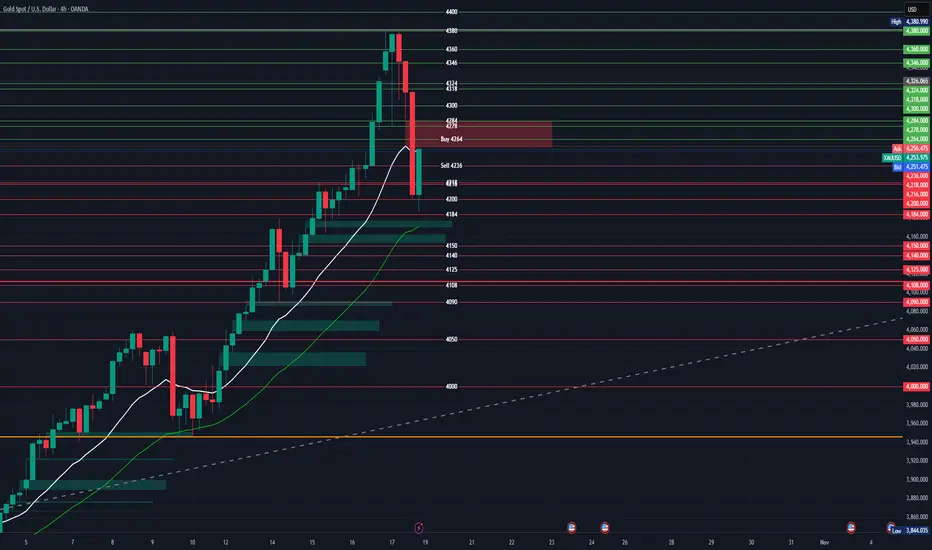
Gold weekly chart with Buy and Sell levelsAnother great week last week we caught the rise early for 1500 pips, lets see can we catch the sell off this week
Buy Entry – 4264
Context: Price recently retraced toward key Fibonacci support near 0.5–0.618 levels (around 4180–4240 region).
Rationale: 4264 aligns with prior breakout zone and 20 EMA dynamic support. Volume concentration just below adds confluence for a potential rebound.
Targets:
Short-term: 4300 (psychological and structural resistance).
Extension: 4340–4360 (previous swing highs).
Stop-loss: Below 4230 support or under 4180 structure (protect against deeper retrace).
Sell Entry – 4236
Context: Positioned near lower range boundary after bullish exhaustion from 4380 top.
Rationale: Acts as a breakdown confirmation if price closes below 4240, breaking the 20 EMA and invalidating near-term bullish structure.
Targets:
Initial: 4180 (0.5 retracement pivot).
Extended: 4120–4100 (previous accumulation zone).
Stop-loss: Above 4270–4280 resistance area (invalidate short bias).
Summary
Bias: Bullish while price holds above 4230–4240.
A daily close below 4230 invalidates buy bias and favors continuation toward 4180–4100.
If 4264 holds, expect potential retest of 4340–4360 range highs.
ill update throught the week
Gold 1H – Slight Correction or Bullish Reaccumulation Ahead?XAUUSD – Intraday Trading Plan | by Ryan_TitanTrader
📈 Market Context
Gold extends its rebound near $4 250 as traders weigh the recent uptick in U.S. Treasury yields against growing expectations of a softer Federal Reserve stance.
After the latest mixed U.S. economic data, markets are leaning toward a mildly dovish outlook — rate-cut bets for early 2026 are gaining traction, while the dollar remains steady.
Today’s focus centers on U.S. housing-starts and jobless-claims data, which could steer short-term volatility.
A stronger-than-expected report may trigger temporary selling pressure on gold, while weaker figures could revive safe-haven demand and extend the rally toward $4 380 +.
Expect liquidity hunts before any clear directional move, as institutional players refine positions near the week’s range extremes.
🔎 Technical Analysis (1H / SMC Style)
• Market structure remains bullish, with previous Breaks of Structure (BOS) confirming continuation after the earlier accumulation phase.
• A short-term Change of Character (ChoCH) signals corrective movement — likely a liquidity sweep before the next bullish leg.
• Liquidity resting below $4 200 has already been taken, aligning with the discount zone around $4 196 – $4 198.
• A potential re-accumulation is forming; buyers may look for confirmation (M15 BOS/ChoCH) inside this demand zone.
• Upside liquidity targets cluster near $4 375 – $4 380, coinciding with a premium supply zone where sellers might re-enter.
🔴 Sell Setup
Entry: 4378 – 4376
Stop-Loss: 4386
Take-Profit Targets: 4325 → 4260
🟢 Buy Setup
Entry: 4196 – 4198
Stop-Loss: 4190
Take-Profit Targets: 4250 → 4370 → 4380 +
⚠️ Risk Management Tips
• Wait for lower-timeframe BOS/ChoCH confirmation before execution.
• Be cautious around U.S. macro data releases — spreads and volatility can widen temporarily.
• Use partial take-profits at nearby liquidity zones and trail stops once market structure confirms continuation.
✅ Summary
Gold maintains its bullish bias above $4 200 after sweeping liquidity.
A short-term correction could retest $4 196 – $4 198 for fresh buy entries, while the broader trend remains upward.
Only a clean structural break below $4 190 would invalidate the bullish continuation scenario.
FOLLOW RYAN FOR MORE USEFUL TRADING IDEAS!!!

XAU/USD: Bullish Surge to 4400?As the previous analysis worked exactly as predicted, OANDA:XAUUSD is setting up for a bullish surge on the 4-hour chart , where price is bouncing off a solid upward trendline, converging with the EMA 50 as dynamic support and a key support zone, signaling potential continuation of the uptrend amid recent consolidation. This confluence creates a strong buying opportunity if buyers hold the line against short-term pullbacks.
Entry zone between 4090-4165 for a long position. Targets at 4380 (first) and 4400 (second) near the resistance zone, delivering a risk-reward ratio close to 1:3 . Set a stop loss on a close below 4090 to mitigate downside risks. 🌟 Monitor for confirmation via a bullish candle close above the entry with building volume, capitalizing on gold's safe-haven appeal in uncertain markets.
Fundamentally , no major news events are observed in the economic calendar today. However, key Chinese data releases such as the PBoC interest rate decision and Q3 GDP could indirectly influence gold through global risk sentiment and commodity demand. 💡
📝 Trade Plan:
✅ Entry Zone: $4,090 – $4,165 (buy zone near trendline + EMA 50)
❌ Stop Loss: Close below $4,090
🎯 Targets:
TP1: $4,380 (initial resistance)
TP2: $4,400 (major resistance / extended target)
💎 Risk-to-Reward: Approx. 1:3, offering a strong technical edge.
What's your take on this gold setup? Comment below! 👇

Gold prices begin to recover, big fluctuations⭐️GOLDEN INFORMATION:
Gold (XAU/USD) drops below $4,100 in Wednesday’s Asian session, extending its sharpest selloff in over a decade as traders lock in profits after a nine-week record-breaking rally. Easing US-China trade tensions ahead of the November 1 tariff deadline further dampen safe-haven demand.
⭐️Personal comments NOVA:
Currently, the gold price fluctuates greatly and moves quickly. There are signs of recovery and retreat to the resistance zone around 4235.
⭐️SET UP GOLD PRICE:
🔥SELL GOLD zone: 4235 - 4237 SL 4242
TP1: $4222
TP2: $4200
TP3: $4170
⭐️Technical analysis:
Based on technical indicators EMA 34, EMA89 and support resistance areas to set up a reasonable SELL order.
⭐️NOTE:
Note: Nova wishes traders to manage their capital well
- take the number of lots that match your capital
- Takeprofit equal to 4-6% of capital account
- Stoplose equal to 2-3% of capital account

(Gold 2H – XAU/USD):(Gold 2H – XAU/USD):
✅ Breakdown confirmed: Price has clearly broken below the ascending trendline and retested it (marked by the red circle).
✅ Support zone: Price is sitting just below the previous support box (~4,250–4,230).
✅ Ichimoku Cloud: Next visible support lies inside the Kumo (blue shaded area).
🎯 Target Levels (Downside)
1. First target: 4,180 – 4,170 → top of the Ichimoku cloud.
2. Main target: 4,130 – 4,110 → the “Target Point” you have marked (bottom of the cloud and horizontal support).
3. Extended target (if momentum continues): 4,070 – 4,050 → next structural support zone.
📈 Summary
Entry: After the retest near 4,250.
TP1: 4,180
TP2: 4,130
SL: Above 4,270 (trendline retest).
So, my main target zone = 4,130 ±20 (as drawn on my chart).

XAUUSD: Shakeout Before the Next Takeoff?Gold dropped more than 2% on October 17 after hitting a record high above $4,340/oz . The main reason came from a strong rebound in the U.S. dollar and President Donald Trump’s more dovish remarks . He stated that a “comprehensive” tariff on China would be unsustainable and confirmed plans to meet with the Chinese President — a move that helped ease trade tensions and cooled down safe-haven demand.
On the H4 timeframe, gold remains within a steady ascending channel, though currently undergoing a short-term correction after touching the upper resistance boundary. The EMA34 around $4,187 serves as temporary support, while the $4,130 zone — aligned with the main ascending trendline — acts as stronger support. The technical structure suggests a likely pullback before the uptrend resumes.
The preferred scenario is that gold will dip toward $4,130, where buyers may step back in. If this level holds and forms a higher low pattern, price could rebound toward $4,350, a key resistance zone overlapping the previous high.
The overall trend remains bullish, but a technical correction is needed to build momentum for the next rally.
Trading Plan: Wait to buy around $4,130 – $4,140, set SL below $4,090, and take profit at $4,280 – $4,350.
This pullback looks only temporary — the bulls are still in control. Let’s see how gold reacts around $4,130 before its next upward leg.

XAUUSD - Surging Hour by Hour👋Hello everyone, great to see you again in today’s OANDA:XAUUSD session.
As forecast, XAUUSD has continued its strong uptrend, hitting the 4,100 target and then 4,200 USD. The quick move through these two psychological levels in a short time underscores the bulls’ strong momentum.
Ongoing economic risk concerns—from a prolonged U.S. government shutdown, renewed U.S.–China trade tensions, and rising geopolitical stress—continue to fuel demand for gold as a safe-haven asset.
From an analytical standpoint, the path of least resistance remains to the upside, with no immediate signs that this trend is being challenged. At the time of writing, price is trading around 4,230 USD, up more than 250 pips since the session began. Bullish structures and orderly pullbacks keep repeating; as long as the marked supports on the chart hold, I believe the next move still offers solid opportunities for buyers.
What about you—how do you see XAUUSD? 💬Share your thoughts in the comments.
Good luck!

GOLD Has buyers area at 4000 demand zone buy possible from that🚀 GOLD BULLISH OUTLOOK (1H Timeframe) 🏆
📉 Price showing strong demand zone support around 4000 — buyers stepping in with momentum!
💰 Buying Opportunity: 4000 zone
🎯 Technical Targets:
1️⃣ 4074
2️⃣ 4156
📊 Structure remains bullish as long as price holds above 4000 zone. Watch for confirmation candles before entry ✅
#Gold #XAUUSD #PriceAction #TechnicalAnalysis #TradingSetup #BullishMomentum

XAU/USD Intraday Plan | Support & Resistance to WatchGold is trading around 4121, consolidating after a modest recovery from the 4075 support zone. Price is currently caught between the MA50 and MA200, showing signs of indecision as buyers and sellers battle for short-term control.
While the broader uptrend remains structurally intact, short-term momentum is still bearish to neutral, with gold struggling to close above the 4151 resistance. A decisive break above 4151 could pave the way for a corrective rally toward 4192 and 4227, where the MA200 may act as dynamic resistance.
On the downside, if gold fails to hold above 4117, another retest of 4075 is likely. A clean break below this level could extend weakness into 4020, with 3984–3953 marking the deeper support base where dip-buyers are expected to become active again.
📌 Key levels to watch:
Resistance:
4151
4192
4227
4279
Support:
4117
4075
4044
4020
3984
🔎 Fundamental focus:
Even though gold is under short-term pressure, the overall trend is still healthy. Uncertainty in the global economy continues to support gold, and many traders see price drops toward key support levels as good buying opportunities.

Gold Selling Plan!!Yesterday gold went wild and dropped almost 3k pips. This is crazy and it signals a few heavy selling sessions ahead. Therefore, I will look for selling opportunities from 4195. My first target is 4042. Ultimate target for today is 3905.

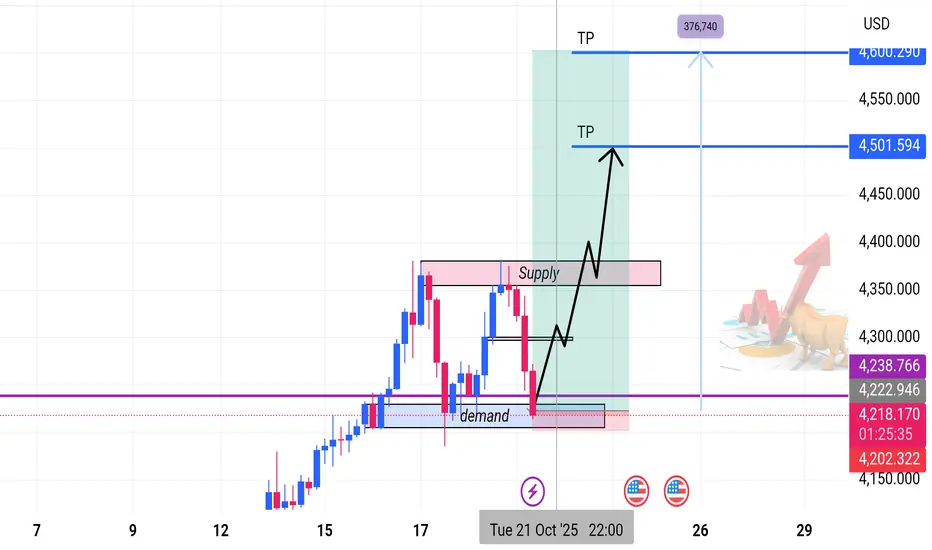
Bullish Continuation from Demand Zone | 4H SetupOverview:
Gold is maintaining a strong bullish structure on the 4-hour timeframe, forming consistent higher highs and higher lows.
Recently, price tapped into a key Demand Zone, showing a clear rejection and early signs of buyer re-entry — signaling a potential continuation of the uptrend.
Technical Outlook
• Trend: Bullish market structure intact.
• Current Price: ~4,230.34
• Demand Zone (Buy Zone): Price has bounced from a major demand area — indicating renewed buying pressure.
• Reversal Confirmation: Rejection wicks and bullish candles confirm demand reaction.
• Supply Zone (Resistance): Overhead supply remains the key obstacle. A break and close above it could trigger a strong rally toward the next resistance.
Trade Setup
Parameter Level (Approx.) Description
Entry (Buy Zone) 4,230.34 Reaction from demand zone
Take Profit 1 (TP1) 4,501.59 Conservative target
Take Profit 2 (TP2) 4,576.74 Extended target
Stop Loss (SL) ~4,200.00 Below demand zone
Market Outlook
As long as the demand zone holds, the bullish structure remains valid.
A confirmed break above the supply zone could invite strong momentum toward higher targets.
Failure to hold the demand base may trigger a corrective move lower — hence, risk management remains crucial.
Bias: 🟢 Bullish
Timeframe: 4H
Strategy: Supply & Demand | Market Structure | Price Action
Gold Long PredictionArpad Nadassy gold long prediction
I predict a large pullback to the daily demand at around 3000 and that will be our perfect chance to go lond again.
