Where Will Gold Go Next Week? Weekly Price Review
On Friday (October 31), international gold prices fell due to a stronger dollar and increased market uncertainty regarding whether the Federal Reserve would further cut interest rates. However, gold is still on track for its third consecutive monthly gain. As of this writing, spot gold was down 0.53% to $4,003.60, up about 4% for the month. The dollar index hovered near a three-month high, making gold more expensive for holders of other currencies. Global gold demand hit a record high in the third quarter due to the Fed's rate cuts, the US government shutdown, and geopolitical tensions; yesterday, US President Trump announced that he would conduct a nuclear test, the first such test in 30 years since it was suspended in 1992, providing strong support for gold. Easing US-China trade tensions and Fed Chairman Powell's hawkish remarks were bearish for gold.
After the previous gains, gold prices underwent a slight correction as investors began taking profits ahead of the weekend and the end of the month, leading to a more cautious market sentiment. The recent sharp pullback in gold prices is primarily driven by market optimism regarding a potential trade agreement between the US and China, as well as the increasingly hawkish stance of the Federal Reserve. The Fed announced its second rate cut this year on Wednesday, lowering it by 25 basis points to reduce the target range for the federal funds rate to 3.75%–4.00%. However, following Powell's speech, traders lowered their expectations for another rate cut in December. According to the CME FedWatch tool, the market currently sees a 74.8% probability of a 25 basis point rate cut in December, down from 91.1% a week ago. On the other hand, gold prices were partly supported by the latest report from the World Gold Council (WGC). The report showed that global gold demand increased by 3% year-on-year to 1,313 tons, a record high for a single quarter, with a surge in investment demand being the main driver. Furthermore, the continued contraction in China's manufacturing sector is also unfavorable for gold. Looking ahead to next week, the gold market will still face many uncertainties, and the battle between bulls and bears is expected to continue. From a news perspective, a series of important economic data will be released next week, such as the US non-farm payrolls and PMI data. The performance of these data will directly affect market expectations for the US economic outlook, and thus influence gold price movements. In addition, speeches by Federal Reserve officials and developments in the geopolitical situation also require close attention.
Gold Price Trend Analysis for Next Monday:
Gold Technical Analysis: Gold is currently continuing its consolidation. Can the bulls rise? Next week will be crucial. If gold continues its strength on Monday, it is highly likely that the rebound will continue. Remember, it's just a rebound; the daily chart for gold will then enter a long period of adjustment, with significant ups and downs. So, where will gold go next week?
From a weekly chart perspective, gold prices have closed lower for several consecutive weeks, currently below the 5-week moving average, which shows signs of turning downwards, indicating that short-term bearish forces are in control. Regarding the MACD indicator, the green bars are continuously shortening, and the fast and slow lines have crossed at a high level and the gap is gradually widening, further confirming the bearish dominance. However, from a longer-term uptrend perspective, gold is currently still within an upward channel, with key support around $3900. As long as this level is not decisively broken, the long-term uptrend for gold is likely to continue.
On the daily chart, gold prices are below multiple moving averages, with the moving average system showing a bearish alignment. The short-term 5-day and 10-day moving averages continue to exert downward pressure on gold prices. The Bollinger Bands are widening downwards, with the price trading between the middle and lower bands, and close to the lower band support, indicating a short-term weak market. Yesterday, the Asian session saw a high of 4046 followed by a pullback, and the US session saw a break below the intraday low to 3972, resulting in a long-shadowed bearish candlestick. Looking at the daily chart alone, barring any news events, Monday's strategy is to sell on rallies. Daily resistance is around 4023; consider shorting at this level. The US session high is around 4010, meaning the market is likely to weaken and trade below 4010. The initial target is around 3980, with a break below that level targeting yesterday's low of 3972. Before the 3972 level is broken, there is still a chance for a rebound, so a small stop-loss can be used to short. If it breaks through, continue shorting on the rebound. In summary, for short-term gold trading next Monday, the key resistance level to watch is 4010-4023, and the key support level is 3915-3885. Please follow the trend closely. Welcome to discuss.
Gold Trading Strategy Reference for Next Monday:
Selling Strategy: Sell gold in batches around 4010-4015 with 20% of your position, targeting 3980-3960, with a further target of 3950 if it breaks through.
Buying Strategy: Buy gold in batches around 3950-3955 with 20% of your position, targeting 3980-4000, with a further target of 4010 if it breaks through.
Trade ideas

Gold Elliott Wave– Potential Wave (4) Completion ZoneGold (XAU/USD) on the daily chart appears to be completing a classic Elliott Wave 5-wave impulse structure. After a strong rally into the wave (3) high, price is currently retracing toward the projected wave (4) correction zone.
The highlighted support area aligns with key Fibonacci retracement levels:
0.5 retracement: around $3,845
0.618 retracement: around $3,718
This region also coincides with the lower boundary of the ascending channel, adding confluence for potential bullish reversal.
If wave (4) finds support within this zone and maintains structure, a new impulsive rally toward wave (5) could begin — targeting the upper trendline resistance near $4,500–$4,600.

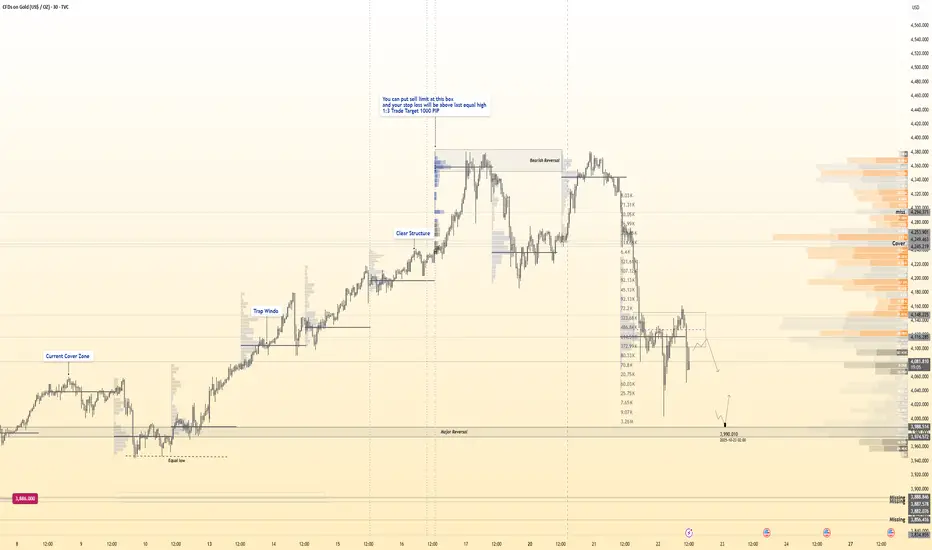
XAUUSD Long: Bulls Preparing for the Next Impulse Toward 4180Hello, traders! Gold (XAUUSD) continues to move within a strong bullish structure, defined by a clear Ascending Channel. The market has shown steady buyer strength, forming consistent higher highs and higher lows. Along this uptrend, price has broken resistance level — most notably around 3950, turning him into new support zone. After reaching the upper part of the channel near the Supply Zone (around 4250), the price entered a corrective phase, retesting the midline of the ascending channel.
This correction appears healthy within the broader bullish context, as it aligns with previous pivot points and areas where demand has repeatedly returned.
Currently, the market is trading between the Support Zone (around 3950) and the Supply Zone (around 4100–4250). Buyers have recently defended the lower boundary of the channel, suggesting potential continuation to the upside if momentum sustains.
My main scenario anticipates a bullish continuation from the current pivot zone.
If the price successfully holds above the Demand Line and breaks through 4100, I expect a further move toward the 4180–4250 resistance area — which aligns with the top of the channel and prior supply zone.In my opinion, this structure still favors the bulls, and any correction toward 3950 would likely offer a buying opportunity within the prevailing uptrend.Therefore, my target (TP) is set at 4180, aiming for a retest of the channel’s upper resistance line. Manage your risk!

Exclusive! Analysis and Interpretation of Powell's Remarks!Powell's Intention Was to "Break the Expectation of an Inevitable Rate Cut," and Data Supports Further Rate Cuts!
Fundamentally, the market's hawkish interpretation of Powell's remarks is a misjudgment. Powell's true intention was to correct the market's excessive expectation that "rate cuts are a foregone conclusion," not to shift to a hawkish stance. The latest economic data shows a continued slowdown in labor demand, and the potential inflation level is not far from the 2% target, all of which support the Fed continuing to cut rates!
Technically, the long-term bullish structure for gold remains intact, with the market currently consolidating. The daily candlestick closed with a large bullish candle, restoring bullish confidence. A double bottom pattern below provides solid support for the bulls, suggesting continued upward movement within the day. Looking at the 1-hour chart, the price is in an upward channel, moving in a stepped fashion. The key support level to watch is 3980; if this level is breached, the market will likely continue to consolidate. Key support is at the double bottom around 3910, where buying opportunities can be considered. Resistance is seen at the previous high of 4047-4050. If the bulls hold above 4050, the next target is 4100! Overall, the strategy is primarily to buy on dips, with selling on rallies as a secondary approach.
Trading suggestion: Buy around 3980-3985, with a stop-loss below 3970. Target 4047-4050! If it breaks below 3980, observe the market and wait for key support levels to buy gold again. If the bulls don't provide a good opportunity to buy on a pullback during the trading day, then wait for confirmation of a breakout at 4047-4050 before buying on a pullback, with a target of at least $20!
I've explained this in detail. If you have any questions, please leave a message!

Gold Pullback or Reversal? Key Zone Ahead!As I expected , Gold ( OANDA:XAUUSD ) started to drop thanks to the Double Top Pattern and reached its target at the Support zone($4,011 – $3,981) .
Now, do you think Gold will start dropping again, or will it resume its recent weeks’ uptrend?
Today, I’m going to do a short-term 15-minute analysis of Gold , so stay tuned.
At the moment, Gold is approaching a Resistance zone($4,192 – $4,137) —also a Potential Reversal Zone (PRZ) —and moving within an ascending channel . Overall, the recent moves in Gold over the past couple of days look like a pullback to the previous Support zone($4,192 – $4,137) .
From an Elliott Wave perspective , it seems that Gold , given the momentum of its recent drop, is completing corrective waves, and we should expect another decline .
I expect Gold to start dropping again from the Resistance zone($4,192 – $4,137) and PRZ , and AFTER breaking the lower line of the ascending channel , it could fall at least down to around $4,039(First Target) .
Second Target: Support zone($4,011 – $3,981)
Stop Loss(SL): $4,222
Please respect each other's ideas and express them politely if you agree or disagree.
Gold Analyze (XAUUSD), 15-minute time frame.
Be sure to follow the updated ideas.
Do not forget to put a Stop loss for your positions (For every position you want to open).
Please follow your strategy; this is just my idea, and I will gladly see your ideas in this post.
Please do not forget the ✅ ' like ' ✅ button 🙏😊 & Share it with your friends; thanks, and Trade safe.

GOLDThe era of cheap gold ends
From 1919 to 2015, the price of gold due to Gold Fixing. The price was set by London Gold Market Fixing Limited. On March 20, 2015 fixing ceased to be installed according to the old methodology and was replaced by electronic auctions LBMA Gold Price.
Initially, the "golden five" consisted of the following companies
1.N M Rothschild & Sons
2.Mocatta & Goldsmid
3.Pixley & Abell
4.Samuel Montagu & Co
5.Sharps Wilkins
What now?
Thirteen market participants are accredited to participate in LBMA Gold Price trading:
Bank of China
Bank of Communications
China Construction Bank
Goldman Sachs International
HSBC Bank USA NA
ICBC Standard Bank
JPMorgan Chase
Morgan Stanley
Société Générale
Standard Chartered
The Bank of Nova Scotia - ScotiaMocatta
The Toronto Dominion Bank
UBS
These banks all belong to the same families.
Most of the gold has already been bought and there is no point in keeping it at this level.
In a period of instability, investors will seek refuge for their assets. And gold will not be a bad refuge for long term.
WE WILL BE GOLD BEFORE THE PORN, WHILE GOLDEN IDEOLOGISTS WILL EXIST . Rothschild's

Gold Rebounds After Fed’s Second Rate Cut of the YearHello everyone, the gold market ( OANDA:XAUUSD ) is showing a notable technical rebound, trading around $4,005/oz after a sharp correction earlier. The return of dip-buying emerged right after the Federal Reserve officially cut interest rates by another 0.25% — the second time this year. Although the move had been widely anticipated, Chair Jerome Powell’s neutral remarks eased concerns, shifting market sentiment into a cautious yet hopeful tone. Lower interest rates reduce the opportunity cost of holding gold, thus encouraging renewed demand, especially as prices recently tested a strong support area near $3,900.
On the geopolitical front, the meeting between US President Donald Trump and Chinese President Xi Jinping in South Korea has added short-term ripples to risk assets. However, most analysts view this as a temporary easing, given that deep divisions over trade and technology remain unresolved. This backdrop keeps safe-haven flows partially anchored in gold rather than rotating fully into riskier assets.
Technically, the 4-hour chart shows gold approaching the FVG resistance zone at $4,020–4,060, aligning with the lower edge of the Ichimoku cloud — often seen as a key battleground for buyers. The broader structure still reflects a downtrend with lower highs and lower lows, yet the close above $4,000 signals emerging buying pressure. If gold can sustain above this level and break decisively through $4,060, a recovery toward $4,120–4,150 may unfold — an area of confluence between the FVG and the thicker cloud zone.
Overall, gold leans toward a technical rebound, but sustained upside momentum will only be confirmed if the price breaks $4,060 with sufficient strength.
And you — do you think gold will keep climbing, or is this just a brief “breather” before another turn lower?

GOLD (Xauusd) is going DOWN! great sell tradeAs you can see GOLD - Xauusd is in a clear downtrend. The red lines drawn show a downward channel which indicate that GOLD is now moving to the downside... Secondly, Gold has broken a powerful support level (the upper green line)! It is now very likely to head down to the lower green line (next support level). Great time to sell!

( Gold Protocol ) Bullish & Bearish Reversal Detected➕ Bearish Reversal " 4115 Zone
➕ Bullish Reversal : 3990
🩸 Volume Surge Confirmed — Institutional buyers active
🩸 Session Aligned — Timing matches liquidity expansion window
🩸 Cluster Shield Formed — Demand imbalance verified
🩸 Delta Shift Positive — Accumulation phase confirmed
🩸 POC Retest Completed — Weak shorts absorbed
🩸 Structure Break Pending — Bullish intention verified
Logic: This is engineered reversal, not prediction.
💯 Objective: Controlled execution with minimal drawdown.
Bullish bounce off 50% Fibonacci support?The Gold (XAU/USD) is falling towards the pivot, which aligns with the 50% Fibonacci retracement and could bounce from this level to the swing high resistance.
Pivot: 3,847.44
1st Support: 3,701.62
1st Resistance: 4,357.81
Disclaimer:
The above opinions given constitute general market commentary, and do not constitute the opinion or advice of IC Markets or any form of personal or investment advice.
Any opinions, news, research, analyses, prices, other information, or links to third-party sites contained on this website are provided on an "as-is" basis, are intended only to be informative, is not an advice nor a recommendation, nor research, or a record of our trading prices, or an offer of, or solicitation for a transaction in any financial instrument and thus should not be treated as such. The information provided does not involve any specific investment objectives, financial situation and needs of any specific person who may receive it. Please be aware, that past performance is not a reliable indicator of future performance and/or results. Past Performance or Forward-looking scenarios based upon the reasonable beliefs of the third-party provider are not a guarantee of future performance. Actual results may differ materially from those anticipated in forward-looking or past performance statements. IC Markets makes no representation or warranty and assumes no liability as to the accuracy or completeness of the information provided, nor any loss arising from any investment based on a recommendation, forecast or any information supplied by any third-party.

GOLD | Bearish Momentum Below 4,053GOLD | Bearish Momentum Below 4,053 ⚠️
Gold currently shows bearish momentum while trading below 4,053, with potential to extend losses toward 4,011.
A confirmed break below 4,011 would signal continuation of the bearish trend toward 3,944.
However, if the price stabilizes above 4,011, a bullish reversal is possible.
A close above 4,053 would confirm bullish momentum toward 4,074 → 4,124.
Pivot Line: 4,053
Resistance: 4,074 – 4,101 – 4,124
Support: 4,011 – 3,978 – 3,945

Gold - The most obvious top!🪙Gold ( TVC:GOLD ) will reverse soon:
🔎Analysis summary:
After we witnessed a major breakout back in 2024, Gold has been rallying about +120% ever since. However, Gold is now approaching a monster resistance trendline of the long term rising channel. It is really just a matter of time until Gold will create its official top.
📝Levels to watch:
$4,500
SwingTraderPhil
SwingTrading.Simplified. | Investing.Simplified. | #LONGTERMVISION

GOLD BUY NOW!!!!!I`m still bullish as well on gold price is making a minor pull back to continue the rally to the upside am still going to buy gold here as far as our internal structure high have been taken out consider this pull back as retest.....

Gold prices still face the risk of falling further
News:
Gold prices weakened again in U.S. trading on Monday (October 27), extending last week's decline. With the thaw in U.S.-China trade relations, investor demand for gold as a safe-haven asset has declined. Market focus has now shifted to the Federal Reserve's interest rate decision, which is expected to be a rate cut later this week.
Spot gold prices fell below $4,000 an ounce on Monday, hitting a three-week low of $3,885 an ounce at one point, as improved market sentiment weakened demand for the safe-haven metal.
Specifically:
Gold daily level: Yesterday closed with a big negative, losing the middle track support. Originally expected to close with a cross or a small positive or negative today, to rebound and confirm the middle track resistance and then rise and fall, to prepare for a wave of pull-ups after tomorrow's interest rate cut, it is also easy to cause a false fall after the middle track breaks, tempting investors to follow the trend and continue to bearish at low levels; but in fact, today continued to fall.
At present, the price of gold has fallen below the previous terraced support band in the 4-hour trend. The K-line continues to be under pressure and the short-term moving average maintains a good volatile downward trend. In the short term, we will pay attention to whether there will be a second downward trend after the rebound and repair.
Today's focus is on the 4000-20 area to suppress the decline, and breaking through 3970-75 to look below 3900. The target has been achieved. After the short-term plunge in gold, and with the Federal Reserve's interest rate decision approaching, the bulls and bears will play a tug-of-war.
Trading strategy:
Buy: 3990-3985, SL: 4050, TP: 3930-3910

XAUUSDGold is in a correction phase, with prices near the support zone of 3973-3954. If the price fails to break above 3954, a rebound is likely. Consider buying in the red zone.
** Very Risky Trade
🔥Trading futures, forex, CFDs and stocks carries a risk of loss.
Please consider carefully whether such trading is suitable for you.
>>GooD Luck 😊
❤️ Like and subscribe to never miss a new idea!

XAU/USD: Sharp Pullback Tests $4,000 as Rally Takes a BreatherXAU/USD faced heavy turbulence this week, rallying initially before hitting strong resistance and reversing sharply toward the $4,000 psychological support. The selloff, accompanied by rising volume, signals potential exhaustion following the recent parabolic move.
A dip toward $3,900 would not indicate a breakdown, but rather a healthy correction, offering the market a chance to reset momentum and prepare for a more sustainable bullish leg ahead.

NEXT WEEK XAUUAS - GOLDnext week will are looking for short positions on the gold after taking the liquidity at 4046$

Hellena | GOLD (4H): LONG to 61.8% Fibo of 4265.Dear colleagues, in the new forecast the idea remains the same - the upward momentum (12345) is not yet complete.
At the moment I see the end of the formation of the corrective wave “4” at the level of 4000, as stated earlier, and the beginning of the upward movement in wave “5”.
I do not want to set distant targets, because their achievement may take time, so let's start small - the nearest target is the resistance area at 4265 - the area beyond the 61.8% level of wave “4”. I think that this is the nearest target that we should expect.
Fundamental context
Earlier this week, gold experienced a sharp pull-back after its recent record highs. Nothing to panic about — it’s simply a technical correction: investors are taking profits after a rapid and extended rally. Key drivers like central bank buying and lower rate expectations remain intact, so the broader bullish story is still alive. In fact, this brief dip may offer a better entry point before the next leg up.
Manage your capital correctly and competently! Only enter trades based on reliable patterns!

XAUUSD Double Top Breakdown and Bearish Flag in PlayGold has completed a double top reversal, hitting its measured target before forming a bearish flag under the key supply zone.
As price remains capped below $4,050–$4,200, bearish momentum could continue toward the $3,700 region, aligning with the flag target.
We should watch the $4,020 POI zone closely any retest and rejection from that area could confirm continuation to the downside.
💬 Share your thoughts below and don’t forget to like & share if this analysis adds value!

GOLD XAUUSD NEWYORK BACKUP CHART 2HR+EMA LONDON /NEWYORK GOLD MARKET SESSION SHOWING ME SOME STRONG BULLISH DISPOSITION but the bullish confirmation hinges on break and close 4030 line chart close of my 4hr candle chart my preferred intraday time frame for deep analysis and trade directional bias in real time
if they break 4030, i will watch 15 min chart of the 4070-4055 zone for possible sell reaction price action, like I did in the yesterday sniper buy at 3885-3890 for reference which was posted for free.
the 4HR structure is my litmus test and guide in bullish continuation or bearish take profit.
if 4030 on timing 12;00 drops then i will hope that 4003-4006 demand keeps the bullish impetus so we can ride into 4150 wave ..
the FOMC RATE AND MEETING WILL BE VOLATILE .
GOLD IS 100% BULLISH AND IN THE HANDS OF CENTRAL BANKS.
GOODLUCK

XAU/ USD Bullish trend analysis Read The captionSMC Trading point update
-
Technical analysis of XAU/USD (Gold Spot)
Timeframe: 1H (OANDA)
Technical Basis: Smart Money Concepts (SMC) + EMA Confluence
---
Market Structure
Current trend: Bearish, price respecting a descending wedge/channel.
Recent Break of Structure (BOS) confirms bearish momentum continuation.
Price is retracing after forming a new low and may move back to mitigate imbalance (FVG).
---
Key Technical Areas
Retracement Levels:
0.5 – 0.79 Fibonacci zone marks the premium shorting area.
Fair Value Gap (FVG) zone between 0.62–0.79 levels is the ideal entry region.
EMA Resistance:
EMA-50 ≈ 4,067
EMA-200 ≈ 4,120
Both EMAs align with the supply zone, strengthening sell bias.
---
Projected Move
1. Expected retracement toward the 4,067–4,100 zone (supply/FVG region).
2. Potential short entry within that area.
3. Bearish continuation targeting the next structural low at 3,960 (as marked).
---
Targets
Next Target (retracement zone): 4,089
Final Bearish Target: 3,960
Mr SMC Trading point
---
Summary
Gold remains under bearish pressure within a contracting structure. A retracement to the premium zone (4,067–4,100) offers potential short opportunities aligned with structure and EMA resistance. A break below 3,995 would further confirm bearish continuation toward 3,960.
---
Pelas support boost 🚀 this analysis

XAU/USD Gold bullish analysis buy strong 📈 XAUUSD (Gold) – Fresh Bullish Setup! 💰✨
Gold is showing strong momentum from key support levels, and the bulls are stepping in once again! 🐂🔥
🎯 Entry: 4077
Targets:
✅ 1st – 4093
✅ 2nd – 4135
✅ 3rd – 4154
Outlook: As long as price holds above support, we remain bullish with potential for upside continuation. 🚀📊
Stay patient, trade smart, and follow your plan! 💼💎
#Gold #XAUUSD #Forex #TradingSignal #Bullish #GoldForecast #TechnicalAnalysis #BuyTheDip
👉 Like 👍 | Follow 🔔 | Comment 💬 | Share 🔁

BUYING GOLD NOW!!!!XAUUSD made a measure breakouts from the internal structure highs and price have already made a pull back am looking forward to see price reclaim back up to 4k again and new high as well
LETS SEE YOUR THOUGHTS ON THIS.....
