GOLD XAUUSD GOLD ,WE ARE waiting on the descending trendline to see the price action
if that 30min descending trendline is respected connecting 3792 and 3772 we could get a sell correction from the level and if its disrespected we hold our lower level buy until 3828. or more.
on a flip side 3700 is possible if we respect the neckline of the double top structure.
#gold #xauusd
GOLDCFD trade ideas

XAUUSD H1 – Potential Sell in the Supply AreaXAUUSD — H1 Timeframe
Titik Sona Community — 25 Sep 2025
???? Setup Sell #1
Entry
3765.43
Stop Loss
3772.43
Take Profit
3725.36
Risk / Reward
~1 : 5.7
???? Setup Sell #2
Entry
3771.36
Stop Loss
3778.36
Take Profit
3725.58
Risk / Reward
~1 : 6.5
Reference chart: view charts on TradingView
Trading Ideas
The two setups above are sell opportunities in the supply area with confirmation of the H1 rejection pattern. The target is directed to the demand below, with strict risk management according to the SL that has been determined.
Technical Reasons
The price of the retest in the supply area + trendline channel is down.
The structure is still forming a lower high (bearish trend valid).
The demand zone below is a logical target for TP.
The risk/reward of both setups is very attractive (±1:6).
Entry & Position Management
Entry Strategy:
Choose one of the settings according to your risk tolerance.
Sell entry at a predetermined level after rejection is valid.
SL is strict according to their respective setups.
TP is directed to the demand area below.
Position Management:
Optional TP scaling in minor support.
Shift SL to BEP after the price moves +200 pips.
Invalidation & Alternative Scenarios
Invalidation: if the price closes above 3780, then the sell setup is void.
Bullish alternative: a break above 3785 paves the way to 3800.
Pre-Entry Checklist
Wait for the rejection to be valid in the supply area.
Check high impact news USD & XAU.
The maximum risk is 1–2% of the account.
Analyst: Titik Sona Community — 25 Sep 2025

Gold – Short Setup (Watch GDP Today)Gold rallied hard into resistance, but the structure is starting to look heavy. I’m watching for a lower high rejection to set up a clean short.
📊 Key Levels
Entry Zone: 3763–3776, only if retested and rejected on the 15–30M TF.
TP1: 3734 → I’ll take a big part off here.
TP2: 3716
TP3: 3697
📉 Gameplan
No blind shorts – I want to see a clear retest + rejection before entering.
Risk defined above 3776.
Locking in heavy profits at TP1 (3734) and trailing the rest down to deeper supports.
⚠️ Caution: Today’s GDP release will move the market. Gold can whip both directions quickly. Don’t get trapped — size small, wait for confirmation, and protect profits.
👉 Follow for more clear trade setups with levels, entries, and risk management – I post breakdowns like this every week.

Expecting more drop Gold As per chart mentioned its falling triangle pattern . Price should visit below 3700 and if marked circle passed it will be straight blood bath ‼️‼️

Gold? Shaking
Hi
Gold is shaking those weak holders
Retailers
It's not a down trend. My 2c
We shall see new highs soon.
May be 4k in hindsight.
Below 3840 will call bearish.
This reversal. healthy for an uptrend.
All the best.
Not a guru
NB/ consult you guru further explaination

XAU/USD – Bullish Trendline Support Targeting 3,910–3,950Analysis:
The chart for XAU/USD (Gold Spot vs. U.S. Dollar) on the 1-hour timeframe shows a clear upward trajectory supported by a strong ascending trendline.
Support Trendline: Price recently retested the rising support line, confirming buyers are still defending this level.
Short-Term Pullback: After a sharp drop from the recent high around 3,820–3,830, price has stabilized near the trendline, signaling healthy retracement within a bullish structure.
Bullish Scenarios:
If price respects the support line, a rebound towards 3,870 and then 3,910 levels is expected.
A successful break above 3,910 may open the door toward the next resistance near 3,950.
Risk Factor: A sustained break below the support trendline would invalidate the bullish scenario, potentially dragging the price back towards 3,790 or lower.
Conclusion: Gold remains in a bullish trend as long as it holds above the support line. Traders may look for buying opportunities on dips, targeting 3,870 → 3,910 → 3,950 in the short term.

Key Levels for the Month 10/2025 ∷Gold∷supply 🐻&🐍&🐂 demand🔳30Day🔲
__________________________
U-Support-Resistance🔀
3705
3737
3772
3806
3840
Mids∷🏛∷
3604
3670
L-Support-Resistance🔀
3330
3386
3404
3424
3440
3475
3490
3507

Gold on excellent upswing now correctedAs discussed throughout my yesterday's session commentary: 'My position: I am Buying Gold as planned on each reversal and local Low's test as I Bought #3,763.80 and #3,765.80 / kept it over-night and my #3,800.80 Target is hit and orders closed automatically. I have Bought minutes ago on #3,813.80 and currently holding my Buying orders / #3,827.80 test.'
I have booked excellent Profits on yesterday's Buying sequence on Gold Buying Gold multiple times as stated above and altering my orders on #3,827.80 extension.
My position: However Gold extended the upside extension towards #3,870's and since most Buyers got trapped and most of them liquidated, they didn't pay attention to end of the Month (this is last session of the Month) and possible Profit taking from Investors. I missed current Selling decline as it was delivered mostly on Asian session however I will turn to Buying now as Gold is ready for new upswing and #4,000.80 benchmark extension, maintaining it as my Medium-term Target. Gold's Short-term Bullish trend is negated if Gold closes the session below #3,800.80 mark.

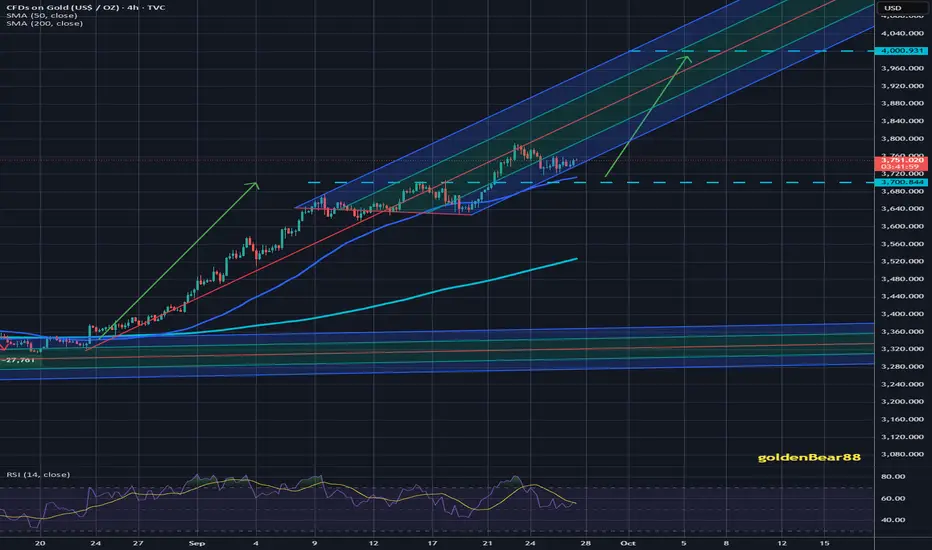
More Bullish On Gold (XAUUSD)Gold on the 4H timeframe is still showing strong bullish momentum. Since mid-September, price has been consistently forming higher highs and higher lows, which is the classic sign of an uptrend. Even though a recent “Sell” signal has appeared near the top, the overall structure has not broken down. What we’re seeing here is likely a short-term correction or profit-taking phase rather than a reversal. The important thing is that the price continues to hold above the $3,820–$3,830 area, which is acting as immediate support. If this zone holds, it gives the bulls a solid base to push higher.
The broader picture also favors the upside because gold has been trading well above the TDH bands, indicating momentum is intact. The reward-to-risk setup currently leans bullish, with the potential upside target near $4,100 compared to a stop level around $3,640. The recent candles suggest some hesitation, but as long as the market doesn’t fall below $3,640, the trend remains bullish. A decisive break above $3,900 would likely accelerate the move toward $4,100, while holding above $3,825 on dips will keep buyers confident.
Trade Setup (Bullish Bias)
• Entry: Around $3,825–$3,835 or on small dips
• Stop-Loss: Below $3,640 (swing low support)
• Take-Profit: $4,100 and beyond if momentum holds
• Risk/Reward: Approximately 1:1.5 (favorable for long positions)

Gold smashes record high: Gov shutdown + EOM flows drive rallyGold hit fresh all-time highs above $3,875 as multiple catalysts converged on September 30th. Let's break down the perfect storm driving this bull run and critical technical levels ahead.
Key Market Drivers:
US Government Shutdown: Congress fails to agree on fiscal budget by tonight's deadline – no jobs data Friday, Fed flies blind into October meeting
Fed Rate Cut Odds: 89% probability of October cut, 65% chance of December follow-up as economic data blackout begins
China's Golden Week: 8-day market closure starting tomorrow removes world's largest gold consumer from active trading
End-of-Month Flows: Quarter-end portfolio rebalancing adding fuel to momentum
Technical Analysis:
Triangle Breakout : Confirmed breakout from major consolidation pattern
Fibonacci Targets : 200% extension at $3,885 (current area), next target $3,920
Elliott Wave Count : Approaching potential 5th wave completion near $4,000
RSI Setup: Flat momentum suggests another leg higher before divergence
Trading Levels:
Resistance: $3,885 (200% Fib), $3,920 (triangle target), $4,000 (psychological)
Support: $3,830, $3,790 (swing low), $3,750 (triangle support)
Channel: Ascending channel intact – trend bullish while above support
Strategy :
Bullish Bias : Continuation above $3,850, target $3,920-$4,000
Risk Scenario: IF (possible) government deal reached, watch for profit-taking to $3,790
Stop Loss: Above $3,910 for any short-term correction trades
A historic confluence of political dysfunction, monetary policy uncertainty, and technical breakout adds to bullish bias.
This content is not directed to residents of the EU or UK. Any opinions, news, research, analyses, prices or other information contained on this website is provided as general market commentary and does not constitute investment advice. ThinkMarkets will not accept liability for any loss or damage including, without limitation, to any loss of profit which may arise directly or indirectly from use of or reliance on such information.

XAUUSD 15M Analysis(30th September 2025) ASIAN/LONDON
BUY/SELL SCENARIOS:
BUYS:
1) Retest the 15m Bullish OB at the 3833.39 level.
2) Create a 3/5m Bullish CHOCH with a body candle close (with a FVG).
3) Retest the 3/5m Bullish CHOCH level to capitalize on BUYS towards the 3875.00 level.
SELLS:
1) Body candle close below the 3822.65 level.
2) Retest the 15m Bearish CHOCH at the 3822.65 level.
3) Create a 3/5m Bearish Engulfing candle to capitalize on SELLS towards the 3788.15 level
This is just an idea, Trade according to your trading plans. Cheers!

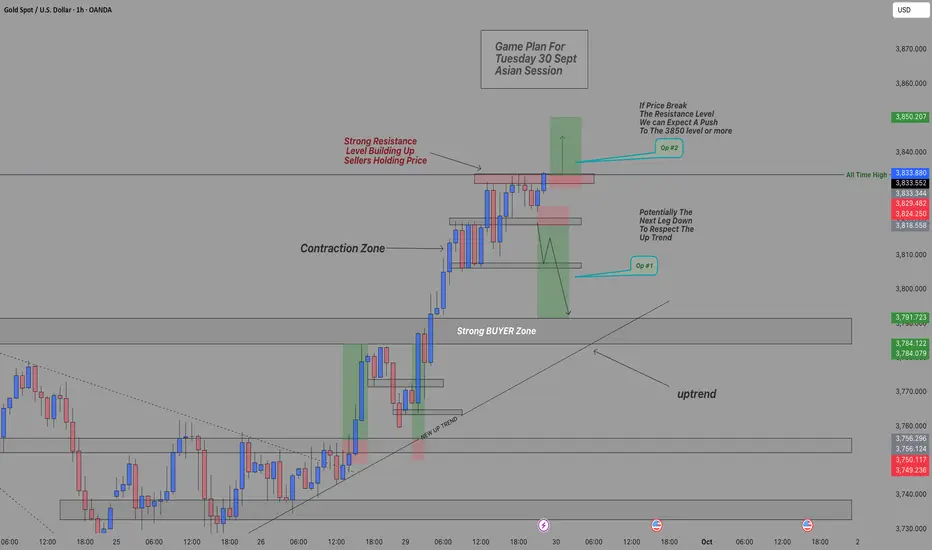
Tuesday 30 Sept - Chart Update before Asian SessionPrice pushed up all day long to set the New ATH.
Market closing right now!
A quick update of price action and the chart breakdown before the Asian Session.
Op #1 - Price can respect the Resistance level and drop down as soon as the market opens.
Confirmation Entry level SELL - @3818.87 to @3791.7 📉
Op #2 - Expecting a potential push up to break the Resistance zone & ATH level @3834.
Confirmation BUY Entry - Wait for price to retest the 3834 level after breaking the resistance zone and target the @3850 (psychological level)
Advice: DON'T RUSH THAT ONE - WAIT FOR THE PRICE TO TELL US.
Aiming for a 1:4 ratio as usual.
Best move - Skip Asian Session & Wait for London to be sure of price direction!
Trade Safe!
@TeamWePrint
Plan day: 29-sep 2025 Related Information:!!!
U.S. inflation, as measured by the Personal Consumption Expenditures (PCE) Price Index, rose to 2.7% year-on-year in August from 2.6% in July, the Bureau of Economic Analysis reported on Friday. The figure was in line with market consensus. Meanwhile, the core PCE Price Index, which excludes volatile food and energy prices, increased 2.9% year-on-year in August, matching both the July pace and analysts’ estimates. On a monthly basis, headline PCE and core PCE rose 0.3% and 0.2%, respectively.
Markets are currently pricing in nearly an 88% probability of a Fed rate cut in October and a 65% chance of an additional cut in December, according to the CME FedWatch Tool. Lower interest rates could reduce the opportunity cost of holding Gold, thereby supporting the non-yielding precious metal.
personal opinion:!!!
Gold extends gains, targeting $3,850.

XAUUSD: Market Analysis and Strategy for September 29thGold is currently rising, so there's no need to speculate on where the top will be; simply follow the trend. After a period of consolidation and building momentum, gold bulls have surged $60, breaking through the $3,800 level. Therefore, the $3,800 level has become strong short-term support for gold, so continue buying on dips around $3,800.
In the long term, the precious metal maintains a favorable bullish outlook. Although the Relative Strength Index (RSI) is high, indicating overbought conditions, this suggests the possibility of market consolidation or a short-term sell-off. Key support for gold lies in the $3,800-$3,810 range. If gold continues to trade above $3,800, it could rise to $3,850. The NY market is focusing on resistance above the $3,830-$3,850 level, while the $3,800-$3,780 support range is under consideration. The short-term bull-bear boundary for gold is $3,800, so I recommend buying on dips!
NY Market Buy Range:
BUY: 3801-3806,
BUY: 3782-3787


XAUUSD Short Term H2Gold Price Forecast: Weakening Momentum, Support Levels in Focus
- Momentum indicators are also showing cracks. The Relative Strength Index (RSI), which had supported gold’s rise to record highs, is now diverging from price action, forming a lower high while gold pushed higher. This bearish divergence signals fading momentum and suggests that downside pressure could continue, especially if short-term bounces fail to break back above the $3,717–$3,779 range.
- If the 10-day average fails to hold, the next area of focus is a wider support zone between last week’s low of $3,627 and the 38.2% Fibonacci retracement at $3,609. Adding significance to this area is the rising 20-day moving average, now at $3,617. A test of this level would mark the first meaningful correction since gold regained strong upward momentum in late August, signalling a potential cooling of the rally.
- Buyers need to quickly reclaim ground above $3,779 to revive bullish momentum. Otherwise, the path of least resistance remains lower, with sellers likely pressing toward deeper support levels in the days ahead.

Gold Spot XAU - Intraday Technical Analysis - 29 Sept.OANDA:XAUUSD
Gold is consolidating near 3,759.85 after a pullback from recent highs, testing the zero line and critical inflection bands in a triangle breakout structure.
Bullish (Long) Setup
Long Entry (3,765):
Initiate longs above 3,765, as this level marks a breakout above resistance after reclaiming short-term momentum from the descending channel and zero line, suggesting buyers are in control.
Additional positions can be considered at 3,759 if dips are supported, anchoring to higher low formations.
Upside Targets:
3,790 (Target 1): Mapped local resistance, ideal for partial profit on momentum continuation.
3,809 (Target 2): The next target and upper channel extension.
Stop Loss:
Use below 3,753 to reduce downside risk if the breakout is rejected.
Bearish (Short) Setup
Short Entry (3,753):
Shorts can be initiated below 3,753, confirming a breakdown of support and invalidating the trend reversal setup.
Downside Targets:
3,729 (Target 1): Logical for profit booking if the downward move persists.
3,710 (Target 2): Further extension and mapped support.
Stop Loss:
Cover shorts above 3,765 on failed breakdown and reversal attempts.
Neutral/Range Logic
Zero Line (3,760):
Price oscillation here signals uncertainty; best to await a clear break above the long entry or below the short entry zone for directional trades.
Sustained action above 3,765 confirms bullish control, while below 3,753 supports a bearish view.
This structure supports risk-managed, disciplined trading of Gold Spot/USD for both breakout and reversal moves.
Follow Chart Pathik for More Day to Day Update on Gold Comex Spot Analysis.

Reaccumulation. Breakout. Distribution.
Gold. 120 days of reaccumulation.
The cT scenario looks like the base case — aiming for 3550–3600.
I’m working this setup.
What comes next is likely years of volatile distribution OANDA:XAUUSD COMEX:GC1!

SMART MONEY CONCEPT (SMC)📊 Trade Breakdown – GOLD 15M
1. Context
• The market came from a distribution phase with a strong rejection at the resistance zone.
• Initial bearish structures appeared (ChoCh + BOS), pushing price down into key support zones.
2. Key Confirmations
• ChoCh (Change of Character): price signaled a potential reversal from bearish to bullish.
• BOS (Break of Structure): break of minor structures confirmed buyers stepping in.
• Fakeout + Rejection: liquidity was taken at support (stop hunt), followed by a strong bullish reaction.
• FVG Mitigation: price filled the imbalance before continuing upward.
3. Execution
• Entry taken after the clear rejection at the institutional support zone.
• Stop Loss placed just below liquidity zone for protection.
• Take Profit projected at the resistance zone (3,767).
4. Result
✅ Price fully respected structure and hit the target at 3,767.
✅ Two days of patience paid off with a clean, high-probability setup.
🔑 SMC Lesson
• Liquidity gets cleared before any strong move.
• ChoCh + BOS + FVG + rejection at key zones = golden setups.
• Discipline and patience are just as important as technical analysis.
GOOD JOB TRADERS….;)

GOLD: Move Down Expected! Short!
My dear friends,
Today we will analyse GOLD together☺️
The in-trend continuation seems likely as the current long-term trend appears to be strong, and price is holding below a key level of 3,755.40 So a bearish continuation seems plausible, targeting the next low. We should enter on confirmation, and place a stop-loss beyond the recent swing level.
❤️Sending you lots of Love and Hugs❤️


Gold Targeting #4,000.80 markTechnical analysis: The #3,745.80 former hard Resistance now turned in Support is now crossed and Gold is now Technically ready to accomplish new local High’s. Personally, I am surprised that Gold didn't re-tested #3,700.80 mark on renewed DX strength as it was fair to expect it both Fundamentally and Technically. Gold recovered #3,732.80 - #3,757.80 without any catalyst (strong Hourly 4 chart's series of Bullish candles) which in my opinion wiped out and liquidated many Sellers from the market. This will be essentially a Higher High’s Upper zone first on Ascending Triangle which was created throughout yesterday's session which was invalidated to the upside / validating my expectation of an #10 to #15 point Trading range (Rectangle) on however aggressive pace for the next #1 - #2 session horizon. The (#1W) Weekly candle is now at (# +2.67%) and the week will most likely close on a positive note following last candle's (# -0.67%). I will take advantage of the Lower High’s Lower zone, giving distinguished Buying opportunities within this relief rally / Bullish Intra-week cycle and Profit on wide timeframes for reduced Risk. Traders have to realize that Trading against Gold’s Hourly 1 and 4 charts should backfire sooner or later. I am looking at #3,762.80 / #3,778.80 / #3,782.80 and / #3,792.80 test initially as I do expect that Trading will be performed widely above #3,800.80 benchmark mid next Monty as even strong DX didn't managed to deliver more serious decline on Gold. #3,722.80 benchmark however is next strong Support and break of the configuration will negate Short-term Bullish potential. I am very satisfied with my Bullish stance and Profits I am making on Intra-day basis even though I am well known Seller of the market (I have to adjust to the trend). Needless to mention, I do expect and preserve my #4,000.80 mark as my Medium to Long-term Target. Enjoy the Profits and have a great weekend!
XAUUSD – Downtrend Continues to be FavoredDowntrend Continues to be Favored (Wolfe Waves Pattern H4)
Hello Trader,
Gold is following the Wolfe Waves structure on the H4 chart, after bouncing off the upper resistance zone and returning below the trendline. This indicates that the short-term upward momentum has weakened, and the scenario of a downward adjustment continues to be prioritized at this stage.
Technical Analysis
Wolfe Waves are clearly formed, wave 5 has hit resistance and a reversal signal has appeared.
The price failed to hold above the upper trendline, while the MACD shows weakening upward momentum.
The 3746 – 3748 zone is considered the main “sell zone” in the short term.
Nearby support zones: 3709 – 3711 and deeper at 3675 – 3678. Further out, the area around 3650 is an important “buy zone” in the medium term.
Trading Scenarios
1. Sell with the trend (priority)
Entry: 3746 – 3748
SL: 3754
TP: 3733 → 3720 → 3702 → 3690
2. Buy Short-term Scalping
Entry: 3709 – 3711
SL: 3705
TP: 3722 → 3730 → 3745
3. Buy Deep Support Scalping
Entry: 3675 – 3678
SL: 3670
TP: 3688 → 3696 → 3710 → 3725
4. Medium-term Buy Zone
Entry: around 3650
This is a large volume accumulation zone, coinciding with strong support on H4. This area is suitable for considering medium-term buy orders if the price adjusts deeply.
Conclusion
In the short term, the bearish scenario continues to be favored, especially when the price stays below the 3748 zone.
Buy strategies should only be considered in the form of scalping or at the important buy zone around 3650.
The current gold market is still in a distribution phase, so patience is needed to observe candle confirmations at entry zones to optimize the R:R ratio.
This is today's XAUUSD trading scenario according to Wolfe Waves on H4. You can refer to it and combine it with your personal strategy for the best risk management.
Follow me to receive the latest scenarios when the price structure changes.
