Gold Hits New Highs; Can It Break Through 3900?This week, key economic data releases to watch include the US ADP employment report, the ISM Manufacturing PMI, and the crucial September non-farm payrolls report. If data continues to show a slowdown in the U.S. economy, it will reinforce expectations of a rate cut by the Federal Reserve, which will be good for gold.
While an October rate cut is highly anticipated, any clues about the future path of interest rates could cause market volatility.
On Wednesday, gold generally showed a volatile upward trend, breaking through a new all-time high in early Asian trading, reaching a high of 3895.37. The 3900 level seems unable to halt the price's upward momentum. From the perspective of technical indicators, the 1-hour chart shows that the price rebounded on Tuesday and touched the lower track of the Bollinger Band, and then rose strongly to a new high of 3875. The moving average system is arranged in a straight line upward, and the momentum of gold bulls remains abundant.
The 4-hour moving average shows a golden cross bullish arrangement, the price remains above the 5-day moving average, the gold price is above the middle Bollinger band, the gold bulls are strong and remain unchanged. In the short term, pay attention to the MA10 moving average position of 3870-3875 area. You can still go long when the price pulls back to this position.
Trading Strategy:
Buy around 3870, with a stop loss at 3860. Target profit range: 3890-3900. Hold the position if it breaks above 3900.
GOLDCFD trade ideas

GOLD gold ,what a complete analysis on a potential swing ,a classic buy high and still fly higher.the 4000$ will come soon
this GOLD ERA STANDARD.
#GOLD #XAUUSD #DOLLAR #DXY

XAU/USD 01 October 2025 Intraday AnalysisH4 Analysis:
-> Swing: Bullish.
-> Internal: Bullish.
Price printed as per yesterday's intraday analysis whereby I mentioned in alternative scenario that price could print higher, however, weak internal high price target has changed.
Price is currently trading within an internal low and fractal high. CHoCH positioning is denoted with a blue horizontal dotted line.
Intraday Expectation:
Price to print bearish CHoCH to indicate bearish pullback phase initiation, price to then trade down to either discount of internal 50% EQ, or H4 supply zone before targeting weak internal high priced at 3,871.890.
Alternative scenario: Price could potentially print higher-highs.
Note:
The Federal Reserve’s sustained dovish stance, coupled with ongoing geopolitical uncertainties, is likely to prolong heightened volatility in the gold market. Given this elevated risk environment, traders should exercise caution and recalibrate risk management strategies to navigate potential price fluctuations effectively.
Additionally, gold pricing remains sensitive to broader macroeconomic developments, including policy decisions under President Trump. Shifts in geopolitical strategy and economic directives could further amplify uncertainty, contributing to market repricing dynamics.
H4 Chart:
M15 Analysis:
-> Swing: Bullish.
-> Internal: Bullish.
Price printed as per yesterday's intraday analysis whereby I mentioned price to trade down to either M15 supply zone, or discount of 50% EQ before targeting weak internal high priced at 3,871.890.
Price has printed a bullish iBOS.
CHoCH positioning is denoted with a blue horizontal dotted line.
Price is currently trading within an internal low and fractal high.
Intraday Expectation:
Price to print bearish CHoCH, to indicate, but not confirm, bearish pullback phase initiation. Price to then trade down to either M15 supply zone, or discount of 50% EQ before targeting weak internal high priced at 3,895.500.
Alternative Scenario: Price could potentially target strong internal low as H4 TF enters it's bearish pullback phase.
Note:
Gold remains highly volatile amid the Federal Reserve's continued dovish stance, persistent and escalating geopolitical uncertainties. Traders should implement robust risk management strategies and remain vigilant, as price swings may become more pronounced in this elevated volatility environment.
Additionally, President Trump’s recent tariff announcements are expected to further amplify market turbulence, potentially triggering sharp price fluctuations and whipsaws.
M15 Chart:

XAUUSD – Gold Hits Fresh ATH! What’s Next?📊 Market Context
Gold has just broken into a new All-Time High (ATH), pushing beyond previous resistance zones and confirming the strength of the ongoing uptrend. The correction earlier this week near 3,800 USD proved to be just a healthy pullback, allowing bulls to accumulate before launching this breakout rally.
With safe-haven demand still strong amid US government shutdown risks and expectations of further Fed rate cuts, gold remains firmly supported. The focus now shifts to how far this bullish wave can extend.
📍 Key Technical Zones
🔴 SELL Reaction Zones
3,911 – 3,915 (Fibo Liquidity) → Strong resistance, possible profit-taking zone.
🟢 BUY Zones
3,830 – 3,820 (Fibo Reaction 0.786 – Support Zone) → First demand zone on pullbacks.
3,808 – 3,810 → Secondary support if deeper correction unfolds.
3,747 – 3,752 (Liquidity BUY Zone) → Long-term confluence support for swing entries.
🎯 Trading Scenarios
1️⃣ Bullish Continuation Setup
Entry: On retracements to 3,830 – 3,820 with bullish confirmation.
Targets: 3,900 → 3,915, with potential for 3,950+ if momentum holds.
Stop: Below 3,808
2️⃣ Countertrend SELL Opportunity
Entry: Only at 3,911 – 3,915 if sharp rejection is seen.
Targets: 3,871 → 3,830
Stop: Above 3,922
3️⃣ Deep Pullback Swing BUY
Entry: 3,752 – 3,747 (Fibo Liquidity zone).
Targets: 3,830 → 3,900+
Stop: Below 3,735
⚡ Trading Notes
Gold remains in a powerful bullish channel → Priority should be on BUY setups.
Short-term SELLs are tactical only, with tight stops.
Watch US political headlines & Fed outlook as they may accelerate volatility near ATHs.
💬 Community Insight
Do you believe Gold will hit 3,950 – 4,000 USD this week, or will we see a stronger correction first? Share your setups below 👇

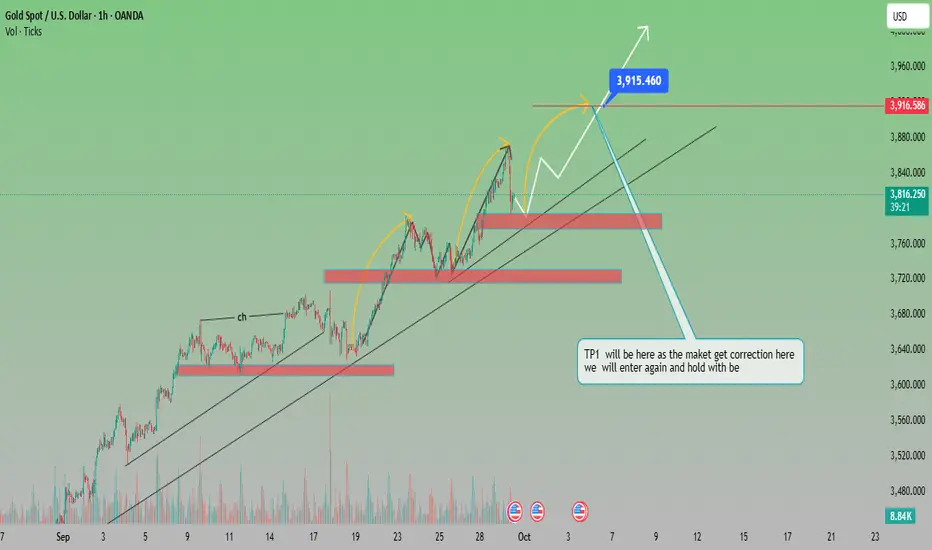
“Gold Price Action: Bullish Momentum with Key Correction Zones
Analysis of XAU/USD (Gold Spot)
The chart shows a clear uptrend channel, supported by higher highs and higher lows.
Price recently pulled back after testing the $3,915 zone, which is acting as a short-term resistance.
Multiple support zones are highlighted (around $3,760 and $3,700), which can provide strong buying opportunities on retracement.
The structure suggests impulse–correction–impulse movement, aligning with bullish continuation patterns.
Bullish Scenario
If price holds above the $3,760–$3,780 support, continuation towards $3,915 (previous high) is expected.
A breakout above $3,915–$3,920 will open the door for further upside, targeting $3,960–$3,980.
Bearish Scenario
If price breaks below the trendline support (~$3,760), deeper correction is possible toward $3,680–$3,640 (TP1 zone).
That zone is mentioned on the chart as a strong re-entry point for long positions.
✅ Suitable Target (Bullish):
Immediate Target: $3,915 (previous high)
Extended Target: $3,960 – $3,980
⚠️ Correction Target (Bearish Pullback):
$3,680 – $3,640 (strong buy zone for re-entry)
GOLD H1 – THE WOLFE WAVE PATTERN IS FORMINGHello trader 👋
Gold has surged back strongly after a nearly 70-point drop yesterday. Currently, the price is fluctuating around the newly established ATH, with the potential to extend short-term targets towards 3,960 – 4,000 if the uptrend continues.
On the H1 chart, the price structure indicates the possibility of forming a Wolfe Wave pattern. This will be the main reference frame for intraday trading, taking advantage of the fluctuation range within the pattern.
⚖️ Short-term trading strategy
🟢 Buy Scenario (priority following the main trend):
Entry: 3,852 – 3,854
SL: 3,847
TP: 3,865 → 3,878 → 3,890
👉 Trend-following trade, suitable for holding positions and maximizing profits.
🔴 Sell Scenario (scalping at the upper boundary):
Entry: 3,877 – 3,879
SL: 3,884
TP: 3,865 → 3,850 → 3,838
👉 Short-term sell order, only for scalpers within the pattern range.
📊 General Outlook
Gold continues to be supported by a major uptrend, but the H1 range suggests there could be some consolidation within the Wolfe Wave.
Buying positions are still prioritized for the day, as they align with the trend and allow for more effective order management.
Traders need to closely monitor price action at the upper and lower boundaries to make flexible decisions.
💡 News Factors to Watch
In the next hour, the market will focus on political news from the US, especially the potential US Government shutdown. This could be a catalyst for increased gold volatility during the session.
📌 Conclusion: Intraday trading prioritizes buying at support levels – selling scalps at the upper boundary within the H1 Wolfe Wave pattern. Tight capital management and clear SL to minimize risks. I will continue to update new scenarios for you – stay tuned so you don't miss out 🚀.

Gold Holds Near Record Highs📊 Technical Structure
TVC:GOLD (XAU/USD) continues to consolidate near its all-time high, with price currently trading around $3,863 after retreating slightly from the peak. The chart shows a clear bullish channel, with immediate Support Zone at $3,840–$3,847 and a Resistance Zone at $3,900–$3,905. Any corrective dips into the support area are likely to attract fresh buying, keeping the upside bias intact.
🎯 Trade Setup
Entry: $3,847 (near support retest)
Stop Loss: $3,836 (below channel and support zone)
Take Profit: $3,905
R:R Ratio: ~1 : 5.13
🏦 Macro Background
Gold’s bullish momentum is underpinned by three key themes:
US Government Shutdown Risk – A Republican spending bill failed in the Senate, increasing the likelihood of a partial shutdown, which supports safe-haven demand.
Dovish Fed Expectations – Markets are pricing in a 95% chance of a rate cut in October and a 75% chance of another in December, keeping USD under pressure.
Geopolitical Risks – Rising tensions over US missile supplies to Ukraine and Middle East instability continue to drive safe-haven flows into bullion.
Together, these fundamentals reinforce gold’s upside bias, making dips attractive for buyers.
🔑 Key Technical Levels
Resistance Zone: $3,900 – $3,905
Support Zone: $3,840 – $3,847
📌 Trade Summary
Gold remains in a bullish consolidation phase near record highs, with the path of least resistance to the upside. A retest of the $3,840–$3,847 support zone may provide a solid long opportunity targeting $3,900+. Fundamentals continue to support safe-haven demand and weaken USD, keeping gold well-bid.
⚠️ Disclaimer
This analysis is for reference only and does not constitute trading advice. Trading involves significant risk, and proper risk management is essential.


XAUUSD – U.S. Government Shutdown Pressure on GoldHello Traders,
For the first time since 2018, the U.S. government faces the risk of a shutdown. This can only be avoided if Congress passes new funding legislation, but the timing remains uncertain. This political backdrop is exerting strong pressure on the financial markets, and gold – the traditional safe haven asset – has become the focal point for investors.
Technical Perspective
Gold continues to set new ATHs right in the Asian session today, indicating the uptrend remains intact.
The upward price channel on H4 maintains a beautiful structure, with the main trend continuing to favor buying.
Yesterday's decline was merely a "liquidity sweep," after which the price quickly returned to its upward momentum.
Short positions can be considered when the price hits strong resistance, combining Fibonacci + Trendline, to optimize winning probabilities.
Trading Scenario
Sell (short-term at resistance):
Entry: 3884 – 3886
SL: 3890
TP: 3872 – 3860 – 3845 – 3830
Buy (in line with the main trend):
Entry: 3820 – 3823
SL: 3816
TP: 3835 – 3850 – 3862 – 3880
Conclusion
Gold remains strongly supported by the political instability in the U.S.
The medium-term strategy continues to prioritize Buying at support zones, while Selling should only be considered when there is a clear reaction at resistance zones.
Traders need to closely monitor political news, as any developments related to the U.S. government can alter gold's short-term structure.
Follow me for the fastest updates on new scenarios as price paths change.

Support Unproven: Gold Bears Eye Fresh PullbackGold began retreating from around 3872, hitting 3793 before rebounding again. It has now reached a high of around 3855, recovering most of its losses.
However, it's not difficult to see that since gold's recent decline reached a rare $80, its upward momentum has been lackluster, even somewhat weak. This suggests that the sharp pullback in gold's short-term performance has dampened bullish sentiment to some extent. Furthermore, it's clear that gold has shown clear signs of profit-taking above 3855. While a collapse is far from imminent, further declines are possible as signs of profit-taking intensify.
From a technical perspective, gold experienced a sharp decline in the short term and rebounded near 3793. Technically, the validity of 3793 as a low point needs to be retested and verified. Therefore, a direct upward move in the near term is unlikely, and a retest of the short-term support low is necessary.
So, when judging short-term support and resistance, we first need to pay attention to the role of the 3845-3855 resistance area above; below, we first pay attention to the support area of 3810-3800. If gold falls below the support near the low point of 3793, then gold may fall further to the 3780-3770 area.
Therefore, in terms of short-term trading, we can still take advantage of the rebound in gold and give priority to shorting gold in the 3840-3850 area, first looking at the target 3820-3810 area.

gold selling from 3858.5#XAUUSD price have rejected following today drop below 3793, now price is trading at 3848, we await for breakout above 3858.5 to sell, target 3778, stop loss 3871.8 today high.
Any possibility of breakout above today high then we see a new high above 3876-3888 to sell.

XAUUSD NEXT POSSIBLE MOVEGold (XAU/USD) Sell Setup 📉
Gold is showing bearish momentum from resistance levels. Sellers are gaining control, and price is likely to move further down if the pressure continues.
📍 Entry: Sell from 3802
🎯 Target: 3740
🛡 Stop-loss: Above recent resistance
This setup provides a clear short opportunity with a favorable risk-to-reward ratio. If momentum sustains, Gold can hit the 3740 target zone.

Signal buyAs you can see, we have excellent price action on the chart along with a great take-profit level.

More Bullish On Gold (XAUUSD)Gold on the 4H timeframe is still showing strong bullish momentum. Since mid-September, price has been consistently forming higher highs and higher lows, which is the classic sign of an uptrend. Even though a recent “Sell” signal has appeared near the top, the overall structure has not broken down. What we’re seeing here is likely a short-term correction or profit-taking phase rather than a reversal. The important thing is that the price continues to hold above the $3,820–$3,830 area, which is acting as immediate support. If this zone holds, it gives the bulls a solid base to push higher.
The broader picture also favors the upside because gold has been trading well above the TDH bands, indicating momentum is intact. The reward-to-risk setup currently leans bullish, with the potential upside target near $4,100 compared to a stop level around $3,640. The recent candles suggest some hesitation, but as long as the market doesn’t fall below $3,640, the trend remains bullish. A decisive break above $3,900 would likely accelerate the move toward $4,100, while holding above $3,825 on dips will keep buyers confident.
Trade Setup (Bullish Bias)
• Entry: Around $3,825–$3,835 or on small dips
• Stop-Loss: Below $3,640 (swing low support)
• Take-Profit: $4,100 and beyond if momentum holds
• Risk/Reward: Approximately 1:1.5 (favorable for long positions)

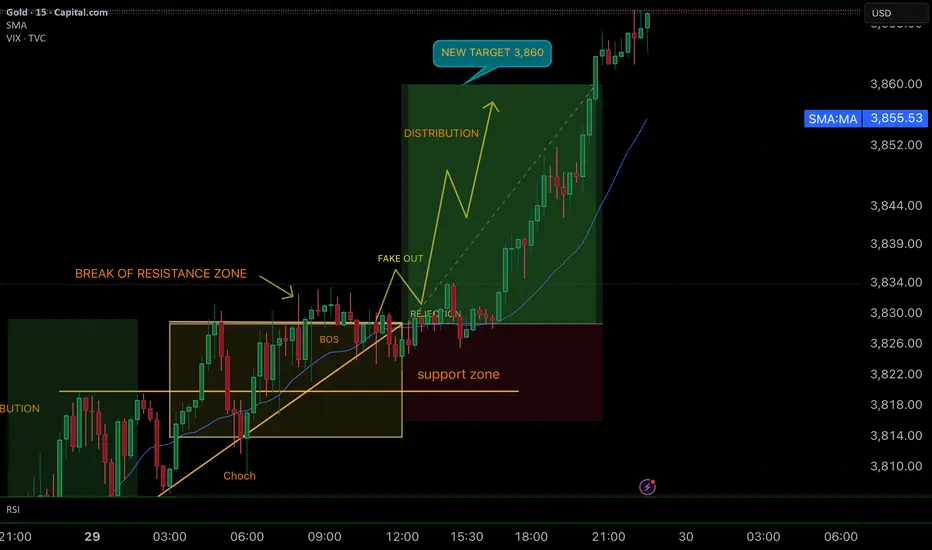
SMART MONEY CONCEPT (SMC)📊 GOLD 15M – Perfect Trade Execution
🔑 What Happened
1. ChoCh + BOS → Confirmed the change of character and break of structure.
2. Break of Resistance Zone → Price broke above the key resistance area with strong bullish pressure.
3. Fake Out + Rejection → Liquidity grab (fake out) followed by rejection validated the entry.
4. Bullish Impulse → Price launched directly toward the 3,860 target, surpassing the projection.
🎯 Result
• Entry: At the rejection after the fake out.
• TP (Take Profit): 3,860 → hit with strength 🚀.
• Momentum: Strong bullish continuation creating new Higher Highs (HH).
GOOD JOB TRADERS….. ;)
📌 SMC Lesson
Patience is key — waiting for confirmation at the rejection after manipulation (fake out) separates a forced trade from a clean institutional setup.
Gold smashes record high: Gov shutdown + EOM flows drive rallyGold hit fresh all-time highs above $3,875 as multiple catalysts converged on September 30th. Let's break down the perfect storm driving this bull run and critical technical levels ahead.
Key Market Drivers:
US Government Shutdown: Congress fails to agree on fiscal budget by tonight's deadline – no jobs data Friday, Fed flies blind into October meeting
Fed Rate Cut Odds: 89% probability of October cut, 65% chance of December follow-up as economic data blackout begins
China's Golden Week: 8-day market closure starting tomorrow removes world's largest gold consumer from active trading
End-of-Month Flows: Quarter-end portfolio rebalancing adding fuel to momentum
Technical Analysis:
Triangle Breakout : Confirmed breakout from major consolidation pattern
Fibonacci Targets : 200% extension at $3,885 (current area), next target $3,920
Elliott Wave Count : Approaching potential 5th wave completion near $4,000
RSI Setup: Flat momentum suggests another leg higher before divergence
Trading Levels:
Resistance: $3,885 (200% Fib), $3,920 (triangle target), $4,000 (psychological)
Support: $3,830, $3,790 (swing low), $3,750 (triangle support)
Channel: Ascending channel intact – trend bullish while above support
Strategy :
Bullish Bias : Continuation above $3,850, target $3,920-$4,000
Risk Scenario: IF (possible) government deal reached, watch for profit-taking to $3,790
Stop Loss: Above $3,910 for any short-term correction trades
A historic confluence of political dysfunction, monetary policy uncertainty, and technical breakout adds to bullish bias.
This content is not directed to residents of the EU or UK. Any opinions, news, research, analyses, prices or other information contained on this website is provided as general market commentary and does not constitute investment advice. ThinkMarkets will not accept liability for any loss or damage including, without limitation, to any loss of profit which may arise directly or indirectly from use of or reliance on such information.

GOLD XAUUSD GOLD ,XAUUSD potential sell zone 3876-3885 zone on the ascending trendline line , hope London GOLD market open in massive buy into that structure for sell.
while 3758-3760 remains a vital demand floor for buyers .
am watching a higher level demand floor at 3813 -3811-3809 for buy ,if this level fails i will be waiting at 3785-3782 a previous broken supply roof as our new demand floor .
GOODLUCK
#GOLD #XAUUSD #US10Y #DOLLAR

Gold forecast trading strategy for September 29th:
Core View: Short-term gold prices face technical correction pressure near record highs, but the overall fundamental backdrop remains optimistic. Expect initial consolidation to digest gains next week, with the key focus being whether a decisive break above the historical high can be achieved. Operationally, it is advised to look for selling opportunities near key resistance levels and consider buying on dips around important support levels.
I. Fundamental Analysis: Mixed Factors, but Safe-Haven Demand and Rate Cut Expectations Dominate
Bullish Factors:
Moderate Inflation and Fed Rate Cut Expectations: The latest PCE data did not exceed expectations, alleviating market concerns about rebounding inflation. Following the Fed's 25 basis point rate cut in September, the market expects two more cuts within the year. Expectations of a weaker USD and lower interest rates provide core support for gold prices.
Technical Breakout: Gold prices have broken through the recent consolidation range of $3720-$3760, attracting more technical buying momentum, indicating strong upward momentum.
Potential Risks and Bearish Factors:
U.S. Economic Resilience Exceeds Expectations: Q2 GDP grew at 3.8%, and the Atlanta Fed raised its Q3 GDP forecast to 3.9%. Strong economic data could reduce the urgency for the Fed to implement aggressive rate cuts.
Profit-Taking Pressure at Highs: After six consecutive weeks of gains and approaching the historical high, some longs may choose to take profits below the historical peak of $3791, leading to a technical pullback.
II. Technical Analysis: Facing a Key Decision at Highs, Beware of Double Top Risk
Trend Pattern: On the weekly chart, gold has posted six consecutive positive weeks, indicating the overall uptrend remains intact. On the daily chart, it has broken out of the consolidation range but has not yet decisively stabilized above the historical high of $3791.
Key Levels:
Resistance: The $3780-$3793 area. This is a strong resistance zone formed by recent highs and the historical peak, serving as a key test for whether the bulls can initiate a new upward leg.
Support:
Primary Support: $3750 (recently breached range top, near the 21-period moving average).
Core Support: $3720-$3700 (previous consolidation range low and key psychological level).
Patterns and Indicators:
4-Hour Chart: The moving average system is in a bullish alignment, but the price encountered selling pressure and retreated near $3783.
1-Hour Chart: Need to be cautious of the risk of forming a "Double Top" bearish pattern near $3780. If this level cannot be strongly breached early next week, the probability of a pullback increases.
Technical Summary: Technical indicators suggest gold is short-term overbought and faces clear profit-taking pressure below the historical high. If it fails to decisively break above $3791, a retest of lower support levels is likely. $3750 is the short-term bull-bear dividing line; a break below would signal a deeper adjustment.
III. Trading Strategy for Next Week
Operational Approach: Adopt a range-bound, slightly bearish mindset, prioritizing selling near key resistance levels and buying on dips at important support levels.
Short-term Short Opportunity (Selling High):
Entry Zone: $3775-$3785 range.
Target: Primary target $3750, further target $3720.
Stop Loss: Place above $3795 (exit if the historical high is decisively broken).
Rationale: Betting on a technical correction before the historical high, with a potential double top forming on the 1-hour chart.
Short-term Long Opportunity (Buying Low):
Entry Zone: $3740-$3730 support area.
Target: $3760-$3770.
Stop Loss: Place below $3720.
Rationale: This area represents a strong support level from the previous breakout. If the price corrects to this zone and fundamentals haven't deteriorated, it may find buying support for a rebound.
Breakout Strategy:
Upside Breakout: If the price strongly breaks and stabilizes above $3795, consider entering a light long position, targeting new highs around $3810-$3820.
Downside Breakout: If the price decisively breaks below the key support at $3720, the short-term uptrend might reverse, consider following through with a short position, targeting $3700 or even $3680.
Summary and Recommendations:
Early next week, before major data releases, market sentiment may turn cautious, and gold prices are more likely to fluctuate between $3750 and $3780. Traders should remain flexible, use light positions, set strict stop-losses, and adjust strategies promptly based on the actual data results. In the current environment, trading "pullbacks within the trend" is a relatively steady strategy.

H1 bullish momentum intact | Buy 3,792–3,765, target 3,821🟡 XAU/USD – 29/09/2025 | Captain Vincent ⚓
🔎 Captain’s Log – Structure & Trend
H1 continues to print consecutive BoS → bullish trend sustained.
Price broke the long-term downtrend line and surged to new highs.
EMA 34 & EMA 89 both pointing up and below price → confirming short-to-mid-term bullish momentum.
📈 Captain’s Chart – Key Zones
Storm Breaker (Sell Zone / ATH test) : 3,818 – 3,821
Golden Harbor (FVG – Buy Zone) : 3,792 – 3,779
OB Harbor 1 : 3,772 – 3,765
OB Harbor 2 (deeper) : 3,731 – 3,724
Core Idea: 3,792 – 3,765 is the main support “cushion” for trend-follow Buys; 3,818 – 3,821 is the wave edge where profit-taking may occur.
🎯 Captain’s Map – Trade Plan
✅ Golden Harbor (BUY – main priority)
Buy Zone 1 – FVG (3,792 – 3,779)
Entry: 3,792 – 3,779
SL: 3,765
TP: 3,805 – 3,818 – 3,821+
Buy Zone 2 – OB1 (3,772 – 3,765)
Entry: 3,772 – 3,765
SL: 3,758 (below 3,765)
TP: 3,792 – 3,805 – 3,818 – 3,821
Buy Zone 3 – OB2 deep (3,731 – 3,724)
Entry: 3,731 – 3,724
SL: 3,714
TP: 3,745 – 3,765 – 3,792 – 3,805
⚡ Quick Boarding (SELL – scalp only)
Sell Zone – Storm Breaker (3,818 – 3,821)
Entry: 3,818 – 3,821
SL: 3,828
TP: 3,805 – 3,796 – 3,792
Breakdown Short (conditional)
Only consider Short if H1 closes below 3,724
SL: 3,735
TP: 3,710 – 3,700 – 3,690
⚓ Captain’s Note
“The Golden sails remain filled after consecutive BoS . Golden Harbor 🏝️ (3,792 → 3,765) is the anchor dock to board in trend’s direction. Storm Breaker 🌊 (3,818 – 3,821) may trigger profit-taking waves – only go Quick Boarding 🚤 if clear signals appear. If the tide drags below 3,724, let the ship retreat to OB2 to gather strength before resuming the northbound voyage.”

It will continue to rise, the next target is 3840Today, during the Asian session, there was a short-term surge of $30 from 3758 to 3788, followed by a quick $20 dip to find the 3768 area. This back-and-forth showed a clear battle between bulls and bears.
Then, after the Asian stock markets opened, with silver breaking out to new highs, gold was forced to surge, breaking through the previous high of 3791 and then the 3800 mark. It wasn't until the European session that it reached the 3820 area, where it saw a slight correction.
Gold prices hit a new all-time high, demonstrating the continued strength of the market's buying pressure.

Gold Price Movement Analysis (XAU/USD)Based on the technical analysis of the XAU/USD (Gold Spot per US Dollar) chart image you provided, here are the key points and probable next movements for the gold price:
1. Trend Analysis
Long-Term Trend: The chart clearly shows a very strong uptrend (bullish) since early 2024 up to the present. The price is currently at a new high within this charted period.
Short-Term Trend: After consolidating around the $3,200−$3,525 area for several months, the price recently broke its previous high and is moving sharply higher toward ∼$3,800.
2. Fibonacci Retracement Analysis
The Fibonacci Retracement is drawn from the low (around $2,538) to the current high (around $3,815). Since the price is now above the 0 Fibonacci level ($3,815), it indicates that the upward trend remains dominant.
Potential Support Levels (If a correction occurs):
23.6%: ∼$3,525 (This was a previous resistance area that now acts as critical support).
38.2%: ∼$3,345
50.0%: ∼$3,200 (A strong psychological and historical support level).
3. RSI (Relative Strength Index) Analysis
The RSI is currently at 77.80, which is significantly above the 70 level. This places the asset firmly in the overbought zone.
An overbought condition increases the probability of a price correction (pullback) occurring in the near term, even if the primary trend remains bullish.
The chart shows previous instances of Bearish Divergence (indicated by the "Bear" labels), where price made higher highs but RSI made lower highs. Keep an eye out for a similar pattern forming now as the RSI is near its peak.
Gold Price Movement Prediction
Combining the analysis above, there are two main scenarios likely to occur:
Scenario 1: Continuation of the Uptrend (Strong Momentum)
Direction: The price will continue its ascent, leveraging the strong bullish momentum.
Potential Targets: Since the price is in All-Time or Multi-Year Highs territory, the next targets would be determined by Fibonacci Extension or major psychological levels (e.g., $4,000).
Trigger: Extremely positive fundamental news for gold (such as escalating geopolitical uncertainty or significant US Dollar weakness).
Scenario 2: Price Correction (High Probability)
Direction: The price will experience a downward correction after reaching the highly overbought condition (RSI>70).
Correction Targets: The price is likely to seek support at the mentioned Fibonacci levels:
Target 1: ∼$3,525 (The 23.6% Fibonacci level).
Target 2: ∼$3,345 (The 38.2% Fibonacci level).
Trigger: Profit-taking by traders, or a confirmed Bearish Divergence signal.
Conclusion
Currently, the gold price is showing explosive upward momentum, but the RSI indicator is signaling a very high potential for an overbought condition.
A cautious approach would be to:
Be wary of a potential short-term correction. The key support area to watch is ∼$3,525.
If the price manages to break new psychological highs (e.g., ∼$3,900) without a deep correction, the upward momentum could continue.
Disclaimer: This analysis is based purely on the technical data visible on the chart. Trading decisions should always consider fundamental analysis and personal risk management.

XAUUSD on swing upside XAUUSD is still intact on bullish trend towards 3930!!
In our previous commantary we are expecting 3830 with the next session.
My stance on XAUUSD?
I'm expecting bit retracement for again pump.
-First point of buying will be 3785-3795 area , just H4 candle should closes above it , my target will be 3830 then 3845. Although i took buy at 3800 and holding.
- Secondly if H4 candle closes below 3780 then our buying will be compromised.
Additional TIP: Buy the dips
