XAUUSD Analysis: Precarious Levels, Here's My Trade Plan📊 Looking at Gold (XAUUSD) on the 4-hour timeframe, price is sitting at a precarious level. Recently, we’ve seen a bearish break of structure, but some bullish momentum is beginning to show 📈.
🔎 That said, there’s still no confirmation of a bullish market structure break just yet. I’ll be watching two possible scenarios:
1️⃣ If price breaks the current high, then retests and fails, this could set up a potential long entry 🚀.
2️⃣ If price instead breaks the current low, then retests and fails, that would signal a possible short opportunity 📉.
⚠️ Disclaimer: This analysis is for educational purposes only and not financial advice. Always trade responsibly and manage your risk carefully.
GOLDCFD trade ideas

XAUUSD – The SELL trend has been confirmed
Technical Analysis
After a strong rise hitting the resistance zone of 3770–3780, gold (XAUUSD) couldn't maintain momentum and started forming consecutive declines. This signals that selling pressure is dominating in the short term.
The 3767–3769 zone coincides with local resistance, a place where the market has reacted multiple times → confirming its role as a distribution zone.
Fibonacci Retracement levels from the latest upward wave show the 0.618 zone around 3700–3705 acts as short-term support, where technical rebound reactions may occur.
The 3673–3675 zone confluences with Fib 2.618 and EMA200 → strong support, considered the main Buy zone for long-term buyers.
RSI (14) is currently below 50, momentum leans towards decline, confirming the adjustment trend is prevailing.
Trading Scenario
SELL Scenario (trend-following priority):
Entry: 3767–3769
SL: 3775
TP: 3755 – 3740 – 3733 – 3710 – 3694
Buy scalping scenario (short-term support reaction):
Entry: 3701–3704
SL: 3698
TP: 3710 – 3722 – 3736
Buy zone scenario (priority for medium-term rebound):
Entry: 3673–3675
SL: 3666
TP: 3688 – 3696 – 3705 – 3720 – 3736
Price zones to watch
3767–3769: important resistance, priority Sell zone.
3700–3705: short-term support, potential Buy scalping area.
3673–3675: main Buy zone, confluence of support + Fibonacci.
3694 and 3736: important intermediate levels, where partial profit-taking is recommended.
The main short-term trend is leaning towards SELL, however, important support zones may provide opportunities for counter-trend Buys or trend-following Buys after price adjustments.
This is a reference scenario based on resistance – support and Fibonacci. Follow me if you love trading gold and want to read the latest analyses in the community.

SEP 24, 2025 | XAUUSD | 1st Signal (SELL NOW)Selling at the 3765–3768 resistance zone offers a good risk–reward ratio:
- Stop Loss: above 3775 (to filter false breakouts).
- Take Profit: support zone 3740 → 3721 (POC).
1️⃣ Technical Resistance
- The 3765–3768 zone is located exactly at the SWING VAH – the upper boundary of the profile.
- This is a strong resistance zone, as the price has touched it multiple times and left upper wicks → showing clear selling pressure.
2️⃣ H1 Trendline
- On the chart, there is a descending H1 trendline formed after the price dropped from the recent high.
- Currently, the 3765–3768 zone coincides with this trendline → becoming a dynamic resistance, increasing the probability of price rejection.
3️⃣ Price Action
- Candles near the 3765–3768 area have shown long upper wicks, reflecting strong selling force as the price was pushed down.
- This is a clear signal that buyers are struggling to maintain bullish momentum.
4️⃣ Volume Profile
- The 3765–3768 area is close to a thick volume distribution cluster → the market often reacts strongly when retesting this level.
- This makes the zone a potential supply area.
👉 If you find this analysis useful, don’t forget to hit like 👍 and drop a comment 💬 to support us in delivering even better insights! Or join my channel to get free signal.

XAUUSD Analysis todayHello traders, this is a complete multiple timeframe analysis of this pair. We see could find significant trading opportunities as per analysis upon price action confirmation we may take this trade. Smash the like button if you find value in this analysis and drop a comment if you have any questions or let me know which pair to cover in my next analysis.

XAUUSD Scale In Trade Plan (ACTIVE)Had a nice retracement today following yesterday's comment from the Fed. Now just waiting for a key entry level to start scaling in longs at discount prices.

Is XAUUSD Setting for drop?there is reversal patter on GOLD with potenial previous daily support to break. Market may continue to drop to fill the dialy fair value gap followed by 4h fair value gap may lead the price to continue to drop to support level.

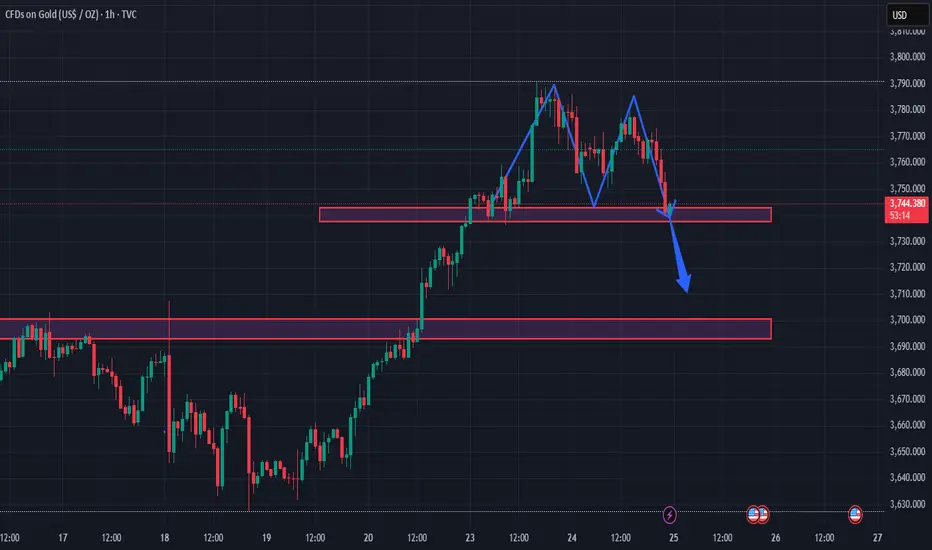
Price breaks the 3,740 OB → bearish BOS → liquidity target at 3,1. Overall Picture
After a strong bullish rally, price formed a double top → distribution phase signal.
The 3,740 zone is currently acting as a liquidity zone (area holding buy-side stop-losses from bottom pickers).
2. Order Block (OB)
Before the strong bullish move, there was a Bullish Order Block around 3,740 – 3,750.
Now price is retesting this OB → if it breaks, the bearish momentum will likely be confirmed.
3. Break of Structure (BOS) & Change of Character (ChoCh)
At the 3,790 high, the structure showed a ChoCh (shift from bullish → bearish).
If price breaks below the 3,740 zone → it will form a clear bearish BOS, confirming a medium-term downtrend.
4. Liquidity Hunt
The 3,740 support is packed with buy stop-loss orders.
A sharp break below this level could trigger a liquidity hunt, allowing “big players” to accumulate around 3,690 – 3,700 before a potential rebound.
5. SMC Scenarios
Bearish scenario (primary): Price breaks the 3,740 OB → bearish BOS → liquidity target at 3,690.
Bullish scenario (less likely): If price reacts strongly at the 3,740 OB with a bullish engulfing candle → price could retest the supply zone near 3,770 – 3,780 before resuming its decline.
👉 In summary: Under SMC, the downside target at 3,690 – 3,700 is the main scenario, after which we should watch if “big players” push the market back up to continue the broader uptrend.
XAU/USD 1H Trade Plan | 1OCT
Market Structure: BOS confirmed after breaking previous high. ✅
Bias: Bullish continuation 📈
POI: Price tapped into demand zone and is showing accumulation signs.
LQC Context: Liquidity grabbed below intraday lows before reacting upwards.
🔹 Expecting price to consolidate in the demand, then push higher toward 3,900+.
🔹 Entry: From demand zone retest (mitigation).
🔹 TP: 3,901 (supply imbalance fill).
🔹 SL: Below demand base (3,853).

3930 is still pending Our previous commantary sucessfully TP HIT As we took buy from 3855-3867 Both TP HITS at 3890
What will I do on NY SESSION?
I'm buying gold on every DIP
✅️ My First buying will be start from 3870 area - if the market drops for retest on H4 BOS I will took buy trade with very strict Stoploss.
✅️Secondly my buying area will be 3835-3845 zone where we have structurel support and liquidity meets the bottom trendine.
-My target will be 3930 In extension !!
Additional TIP: Buy the dips

XAU/USD Intraday Plan | Support & Resistance to WatchGold is recovering from yesterday’s sharp pullback and is currently trending just above the $3,861 level. A sustained break above this area could see price push toward the $3,883 resistance, with a possible extension to $3,903.
Failure to hold above $3,883 could trigger another pullback into lower support zones.
📌 Key levels to watch:
Resistance:
$3,883
$3,903
$3,920
Support:
$3,861
$3,842
$3,828
$3,796
$3,753
$3,734
🔎 Fundamental Focus – Wed, Oct 1
Key US data on deck today:
🚩ADP Non-Farm Employment
🚩ISM Manufacturing PMI
🔶ISM Manufacturing Prices
👉 Expect high volatility and swings.


XAU/USD 30 September 2025 Intraday AnalysisH4 Analysis:
-> Swing: Bullish.
-> Internal: Bullish.
Price printed as per yesterday's intraday analysis whereby I mentioned in alternative scenario that price could print higher.
Price is currently trading within an internal low and fractal high. CHoCH positioning is denoted with a blue horizontal dotted line.
Intraday Expectation:
Price to print bearish CHoCH to indicate bearish pullback phase initiation, price to then trade down to either discount of internal 50% EQ, or H4 supply zone before targeting weak internal high priced at 3,871.890.
Alternative scenario: Price could potentially print higher-highs.
Note:
The Federal Reserve’s sustained dovish stance, coupled with ongoing geopolitical uncertainties, is likely to prolong heightened volatility in the gold market. Given this elevated risk environment, traders should exercise caution and recalibrate risk management strategies to navigate potential price fluctuations effectively.
Additionally, gold pricing remains sensitive to broader macroeconomic developments, including policy decisions under President Trump. Shifts in geopolitical strategy and economic directives could further amplify uncertainty, contributing to market repricing dynamics.
H4 Chart:
M15 Analysis:
-> Swing: Bullish.
-> Internal: Bullish.
As per alternative scenario of yesterday's intraday analysis, price continued to push higher.
Price subsequently printed a bearish CHoCH before continuing with it's bullish momentum, however, I shall not classify this due to the very insignificant pullback. This has been marked in red.
Price is currently trading within an established internal range.
Intraday Expectation:
Price to trade down to either M15 supply zone, or discount of 50% EQ before targeting weak internal high priced at 3,871.890.
Alternative Scenario: Price could potentially target strong internal low as H4 TF enters it's bearish pullback phase.
Note:
Gold remains highly volatile amid the Federal Reserve's continued dovish stance, persistent and escalating geopolitical uncertainties. Traders should implement robust risk management strategies and remain vigilant, as price swings may become more pronounced in this elevated volatility environment.
Additionally, President Trump’s recent tariff announcements are expected to further amplify market turbulence, potentially triggering sharp price fluctuations and whipsaws.
M15 Chart:

XAU / USD 30 Min. ChartHello traders. Looking for a quick scalp trade in either direction. Home sales news, is coming out in a few minutes. With with the opening of the NY market, I am trying to see if I can grab a few pips. Let's see how things go. Big G gets a shout out. Be well and trade the trend. Happy Monday, I am not trying to force or rush a trade this early in the week. Thank you so much for checking out my chart.

XAUUSD. RiskyShort term bearish on this pair. Price have been so bullish.
Manage risk. Counter trend trade. OHLC Anticipation + OB Capitalisation.
Turn on notifications for trade updates!

Will Gold close October 2025 at $3900?Dear friends
Please avoid entering trades within the 3820-3809 range, This is a trap area, with limited reward potential relative to the risk. Scalping within this range is your choice, but make sure you set a stop loss if you do.
Bullish Scenario (Buy)
Entry: Above 3820
Targets:
3827 - 3840 - 3859 - 3872 - 3883 - 3900
🔹 Reminder: Always trade with caution. Place stop-loss orders and secure partial profits every $5–6 move higher. If gold turns bearish, the drop could be sharp — especially if it breaks below Tuesday’s low of 3717.
Bearish Scenario (Sell)
Entry: Below 3809
Targets:
3802 - 3792 - 3782-3777 - (3766 - 3762) - 3754 - 3744 - 3732 - (3725-3717)
🔹 Note: If you find this analysis helpful, thank you in advance for sharing it with your friends.
Wishing you all a profitable and safe Friday session.
Disclaimer:
This analysis reflects only my personal opinion and observations of the market. It is not financial advice or a buy/sell recommendation. Trading in financial markets carries high risk, and all decisions remain the sole responsibility of the trader.

Further Correction in SightWe can see Price making a reversal after sweeping the Wednesday daily high and shifting structure while leaving an Hourly and 15 minute Imbalance.
This is clear indication that price intends to make further correction before continuing to the upside. And the first target would be Wednesday low, before we can experience any significant upside movement.
As a result, there are trading opportunities clearly highlighted in the chart below.
Have a profitable week guys.

Gold next possible move Currently Gold is in the consolidation phase and may continue to re test 3730 area , but it will likely to continue it's long term bullish bias and may move to 3900 by the end of month

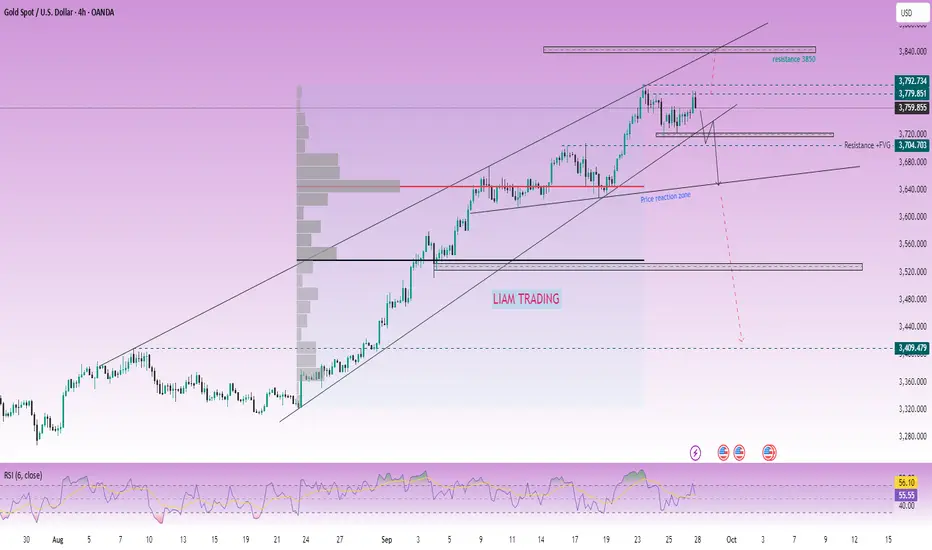
LiamTrading – Mid-term Gold Outlook H4Let's prepare the scenario for the new week, everyone!
In my opinion, gold next week might start to show a mid-term correction phase. However, it is important to note that nothing is absolutely certain on a larger time frame. If you're trading short-term within the day, closely follow price action to ensure higher accuracy.
Gold closed the weekly candle at 3759.85 – a price point clearly reflecting hesitation. The end-of-week session showed resistance to price increases, mainly due to profit-taking pressure, so it's too early to confirm that a downtrend will begin.
The upward price channel is strong, so it's still necessary to think in line with the market's upward trend to ensure the mindset of holding profits remains firm.
The upward structure is still stable, but the RSI has indicated a weakening in buying sentiment. To confirm a mid-term correction, gold needs to break 3720. At that point, a reasonable strategy would be to wait to sell around 3737–3740 (retracing to the trendline), with the target being the support area coinciding with the highest volume profile cluster at 3645.
Conversely, the buying scenario will occur when:
- Price touches the 3735 boundary and shows a candle rejection reaction.
- Or gold breaks above the minor resistance at 3780, then you can buy immediately, with the expectation of heading towards the 3850 area.
Next week, be patient and wait for market confirmation to increase the probability of winning. I will continue to share detailed scenarios in each trading session for everyone to stay updated.
Floating vs. Pegged Exchange Rate SystemsPart I: Understanding Exchange Rate Systems
1. Definition of Exchange Rate
An exchange rate is the price of one nation’s currency in terms of another. For example, if 1 US dollar equals 80 Indian rupees, then the exchange rate is USD/INR = 80. Exchange rates affect imports, exports, tourism, capital flows, and even domestic inflation.
2. Categories of Exchange Rate Systems
Broadly, exchange rate systems can be classified into:
Floating exchange rate systems – where market forces determine currency value.
Fixed or pegged exchange rate systems – where governments fix their currency to another.
Intermediate or managed systems – hybrids combining both features.
For the purposes of this discussion, the focus will be on the two extremes: floating vs. pegged.
Part II: Floating Exchange Rate System
1. Definition
A floating exchange rate system is one where the value of a currency is determined entirely by supply and demand in the foreign exchange market, with minimal or no direct government intervention.
For example, if demand for US exports rises, demand for the US dollar increases, leading to appreciation. Conversely, if imports exceed exports, the dollar may weaken.
2. Historical Evolution
Floating exchange rates gained global prominence after the collapse of the Bretton Woods system in 1971, when the US abandoned the gold standard. Since then, major economies like the United States, Japan, and the Eurozone have adopted floating rates.
3. Mechanism of Floating Exchange Rates
Supply and Demand Driven: Determined by trade flows, capital movements, speculation, and investor confidence.
Self-Correcting Nature: Trade imbalances may adjust automatically. For instance, if a country has a trade deficit, its currency depreciates, making exports cheaper and imports costlier, potentially correcting the imbalance.
4. Advantages of Floating Exchange Rates
Automatic Adjustment: Exchange rates adjust to reflect market conditions, reducing persistent imbalances.
Monetary Policy Independence: Central banks can use interest rates and money supply to focus on domestic goals like inflation or employment.
Shock Absorption: Floating rates act as a buffer against global shocks, such as commodity price changes or financial crises.
Reduced Speculative Pressure: Since currency values fluctuate naturally, speculators find fewer opportunities to exploit fixed-rate misalignments.
5. Disadvantages of Floating Exchange Rates
Volatility: Currencies may fluctuate excessively, creating uncertainty in trade and investment.
Imported Inflation: Currency depreciation can make imports expensive, fueling domestic inflation.
Speculative Attacks: Although less frequent than in fixed systems, excessive speculation can destabilize floating currencies.
Uncertainty in Planning: Exporters, importers, and multinational businesses face difficulty in long-term pricing strategies.
6. Examples of Floating Exchange Rate Economies
United States (USD)
Japan (JPY)
Eurozone (EUR)
United Kingdom (GBP)
India (managed float leaning toward floating)
Part III: Pegged Exchange Rate System
1. Definition
A pegged exchange rate system, also called a fixed exchange rate system, is one where a government or central bank ties the national currency’s value to another major currency (e.g., the US dollar or euro) or to a basket of currencies.
2. Historical Evolution
Fixed systems were prevalent under the Bretton Woods system (1944–1971), where currencies were pegged to the US dollar, which itself was pegged to gold. After its collapse, several nations continued pegging their currencies to promote stability.
3. Types of Pegs
Hard Pegs: Permanent fixation, e.g., currency boards (Hong Kong dollar pegged to USD).
Soft Pegs: Governments intervene to maintain a narrow band, allowing minor fluctuations.
Crawling Pegs: Gradual adjustments over time to reflect economic fundamentals.
4. Mechanism of Pegged Exchange Rates
Government Intervention: Central banks buy or sell foreign reserves to maintain the peg.
Currency Reserves: Requires large reserves of the anchor currency to defend against speculation.
Capital Controls: Sometimes necessary to prevent destabilizing flows.
5. Advantages of Pegged Exchange Rates
Stability and Predictability: Facilitates international trade and investment by reducing currency risk.
Inflation Control: Pegging to a stable currency (like USD) can import low inflation credibility.
Investor Confidence: Encourages foreign investment by offering exchange rate certainty.
Policy Discipline: Forces governments to maintain prudent fiscal and monetary policies to sustain the peg.
6. Disadvantages of Pegged Exchange Rates
Loss of Monetary Policy Independence: Domestic interest rates must align with the anchor currency.
Vulnerability to Speculative Attacks: Pegs can collapse if market participants doubt sustainability (e.g., Asian Financial Crisis 1997).
Need for Large Reserves: Maintaining a peg requires vast foreign currency reserves.
Economic Distortions: Artificially fixed rates may misalign with fundamentals, leading to trade imbalances.
7. Examples of Pegged Exchange Rate Economies
Hong Kong Dollar (HKD) pegged to USD
Saudi Riyal (SAR) pegged to USD
United Arab Emirates Dirham (AED) pegged to USD
Danish Krone (DKK) pegged to Euro
China (before 2005, tightly pegged to USD; now managed float)
Part IV: Comparative Analysis
1. Flexibility vs. Stability
Floating offers flexibility but at the cost of volatility.
Pegged provides stability but sacrifices policy freedom.
2. Suitability by Economic Stage
Developed Economies: Often prefer floating (e.g., US, EU) due to strong financial systems.
Developing Economies: Many prefer pegging for credibility and stability (e.g., Gulf States).
3. Crisis Response
Floating systems can adjust automatically to shocks.
Pegged systems may collapse during crises if reserves are insufficient.
4. Trade and Investment Impact
Floating rates create uncertainty in cross-border transactions.
Pegged rates encourage stable trade relations but may invite speculative pressures.
Part V: Hybrid and Managed Systems
Recognizing the limitations of both extremes, many countries adopt intermediate arrangements:
Managed Float: Central bank intervenes occasionally (e.g., India, China).
Dirty Float: Authorities intervene secretly to influence the market.
Target Zone Arrangement: Currency allowed to fluctuate within a predetermined band.
Part VI: Case Studies
1. The US Dollar (Floating Success Story)
The US dollar’s floating rate system since 1971 has allowed it to remain the world’s dominant reserve currency. Flexibility has helped the US absorb shocks like the oil crises and 2008 financial crisis.
2. Hong Kong (Successful Peg)
The Hong Kong Monetary Authority has successfully maintained a USD peg since 1983, building investor confidence, though it limits monetary flexibility.
3. Argentina (Peg Collapse)
Argentina’s currency board peg to the USD in the 1990s initially reduced hyperinflation but collapsed in 2001 due to misaligned fundamentals and lack of reserves.
4. China (From Peg to Managed Float)
China maintained a strict peg to the USD until 2005, fueling export growth. Now it uses a managed float against a basket of currencies, balancing stability with flexibility.
Part VII: Policy Implications
1. For Trade-Dependent Economies
Pegging may suit economies highly dependent on exports (e.g., Gulf oil exporters).
2. For Economies Facing Volatility
Floating helps absorb global shocks, making it preferable for large diversified economies.
3. For Emerging Markets
Hybrid models like managed floats often balance stability and flexibility, reducing risks of crises.
Conclusion
The debate between floating and pegged exchange rate systems is essentially a trade-off between flexibility and stability. Floating systems empower countries with monetary independence but expose them to volatility. Pegged systems provide stability, enhance trade confidence, and import credibility but often collapse under speculative pressure if fundamentals diverge.
In practice, most nations operate on a spectrum, blending features of both. The success of either system depends not only on the choice of exchange rate regime but also on complementary policies, institutional strength, and global economic conditions.
The future of exchange rate systems may see more managed arrangements, where countries adopt pragmatic strategies, neither fully floating nor rigidly fixed, reflecting the complexity of today’s globalized financial landscape.
XAUUSDI expect a strong drop in gold because it has hit a solid ceiling and cannot break through that easily.

Why Trading is NOT like Childhood Growing up is very different to trading.
We are brought up to walk and talk quickly – WIN
We are brought up to have the best grades – WIN
We are brought up to buy the best cars and houses – WIN
We are brought up to have the best jobs and make a lot of money – WIN
Everything requires WINNING.
Losing? That wasn’t even an option!
Then we get introduced to trading where we need to LOSE to WIN.
We need to take small losses to make medium profits.
And then it’s all about consistency and persistence.
That’s why adapting to the LOSING mentality with trading is paramount for your trading success.
We need to ACCEPT losing with trading
Yep, you read that right.
The trick isn’t about avoiding losses altogether; it’s about managing them.
Imagine you’re playing a board game, and every time you lose a turn, you get closer to winning the game.
It sounds counterintuitive, doesn’t it?
But that’s the magic of trading. It’s not about avoiding losses; it’s about taking small, calculated hits so you can stay in the game long enough to hit that big, rewarding win.
How do you do this?
Accept Losses: Understand that not every trade will be a winner.
Cut Losses Quickly: Have a strategy in place to limit your losses.
Learn from Your Losses: Each loss is a stepping stone towards a better strategy.
We Aren’t Brought Up to Take Risks
As kids, we were told, “Look before you leap!”
We were encouraged to play it safe, avoid risks, and stay in our comfort zones.
As traders, we need to embrace risk.
But here’s the secret sauce: it’s all about taking calculated risks.
How to Embrace Risk Wisely:
Know Your Risk Tolerance:
Understand how much risk you’re comfortable with.
Are you happy to risk 0.5% to 2% per trade? GOOD – You’re on the right path.
Diversify:
Don’t put all your eggs in one basket. You need to adapt to different pre-market movers markets when trading.
Adapt more markets to build different portfolios during different market environments.
Use Stop-Loss Orders:
These will limit your potential losses. And adjust your stop losses to breakeven or just above – to lock in small gains along the way.
Trading Requires a Whole New Mindset
Trading isn’t like your childhood.
And that’s okay!
It’s not supposed to be.
It’s a whole new ball game with different rules. In trading, the focus isn’t on avoiding losses but taking and integrating them.
It’s not about avoiding risks but managing them.
It’s not about physical effort but intellectual strategy.
FINAL WORDS
Trading is NOT like your childhood.
We are humbled by the markets.
We drop our ego a bit.
And we keep consistent.
We lose battles but win the wars.
That is how it has and will always be.
That’s how we will strive to thrive and triumph with trading.
Love and accept your small losses. They are one step closer to your BIG wins.
Disclosure: I am part of Trade Nation's Influencer program and receive a monthly fee for using their TradingView charts in my analysis.
XAUUSD - MARKET CONTEXT #2 I SEP/26/2025📈 Main Trend
Gold is showing signs of breaking out of the short-term downtrend line as price continues to form Higher Lows (3732 → 3739 → 3745). This indicates active buying pressure, with bulls gradually taking control.
🔎 Price Structure
Previously, price formed a Low at 3737, then maintained a sequence of Higer Low → Higer Low → Higer Low, confirming steady recovery momentum. If price holds above the H1 trendline, the likelihood of forming a new Higher High increases.
🛡 Key Zones
- Support: 3732–3739 (Higher Low zone). A successful retest and bounce here would confirm bullish continuation.
- Resistance: 3770–3780 (previous highs + rejection zone). A breakout above this range would strengthen the bullish trend further.
📊 Market Sentiment
Following key news (Powell’s speech + recent GDP/Unemployment Claims), the market reacted but failed to trigger a strong dump — showing weakening selling pressure. Currently, price is waiting for a clear breakout to confirm the next directional move.

XAU/USD 26 September 2025 Intraday AnalysisH4 Analysis:
-> Swing: Bullish.
-> Internal: Bullish.
Analysis and bias remains the same as analysis dated 24 September 2025.
As mentioned in analysis dated 04 September 2025, with respect to alternative scenario, price could potentially continue higher, is how price printed, price continued its bullish trajectory printing all-time-highs. This is continuing.
As per my analysis of yesterday, dated 22 September 2025, whereby I mentioned price could potentially continue to print higher-highs. This is how price printed, showing little to no signs of pullback phase initiation.
Price is currently trading within an internal low and fractal high. CHoCH positioning is denoted with a horizontal blue dotted line.
Intraday Expectation:
Price to print bearish CHoCH to indicate bearish pullback phase initiation, price to then trade down to either discount of internal 50% EQ, or H4 supply zone before targeting weak internal high priced at 3,791,255.
Alternative scenario: Price could potentially print higher-highs.
Note:
The Federal Reserve’s sustained dovish stance, coupled with ongoing geopolitical uncertainties, is likely to prolong heightened volatility in the gold market. Given this elevated risk environment, traders should exercise caution and recalibrate risk management strategies to navigate potential price fluctuations effectively.
Additionally, gold pricing remains sensitive to broader macroeconomic developments, including policy decisions under President Trump. Shifts in geopolitical strategy and economic directives could further amplify uncertainty, contributing to market repricing dynamics.
H4 Chart:
M15 Analysis:
-> Swing: Bullish.
-> Internal: Bullish.
Analysis and bias remains the same as analysis dated 24 September 2025.
As per analysis and intraday expectation of previous analysis, price has printed a bearish CHoCH, which is the first indication, but not confirmation, of bearish pullback phase initiation
Price is currently trading within an internal low and internal high.
Intraday Expectation:
Price to trade down to either M15 supply zone, or discount of 50% EQ before targeting weak internal high priced at 3,791.255.
Alternative Scenario: Price could potentially continue to print higher.
Note:
Gold remains highly volatile amid the Federal Reserve's continued dovish stance, persistent and escalating geopolitical uncertainties. Traders should implement robust risk management strategies and remain vigilant, as price swings may become more pronounced in this elevated volatility environment.
Additionally, President Trump’s recent tariff announcements are expected to further amplify market turbulence, potentially triggering sharp price fluctuations and whipsaws.
M15 Chart:
