Gold Shines Bright - Bulls Targeting 3877Hello Followers, I am going to share you my opinion on gold next move..
Gold is strong bullish and now it is reaching the All Time High (ATH). Currently it is now at 3816 and according to me gold will rise more cause it is properly respecting the parallel channel and now gold is at a support area and it is respecting it superbly.. So now next move is possible around 3877.
KEYPOINTS:
Entry-level 3816
Target 3877
Stop loss 3795
Pivot 3802/3807
GOLDCFD trade ideas

It's a shame that gold is going to crashAs I explained a few days back, GBPUSD reversed from resistance and confirmed the bearish case by breaking under the confluence support zone.
The market reached as low as 1.3450, before recovering part of the losses, with price currently hovering near the 1.3500 handle.
The key question now: is this just a corrective bounce, or the start of a deeper reversal?
From my perspective, the broader structure still favors the downside:
• The recent recovery looks corrective in nature, lacking strong bullish momentum.
• The previous confluence support is now acting as resistance.
• Macro factors and USD strength remain supportive of further GBP weakness.
As soon as this correction completes, I expect the bearish leg to resume, with 1.3200 remaining my downside target.
For traders, this means opportunities will likely appear on short setups after spikes into resistance, as long as 1.36 is not decisively reclaimed.

XAUUSD--LONG--Bullish momentum is high
--it seems next target is 4000 USD
--for detailed lower timeframe chart check below

Short-term Bullish with Key Resistance Ahead📊 Market Overview
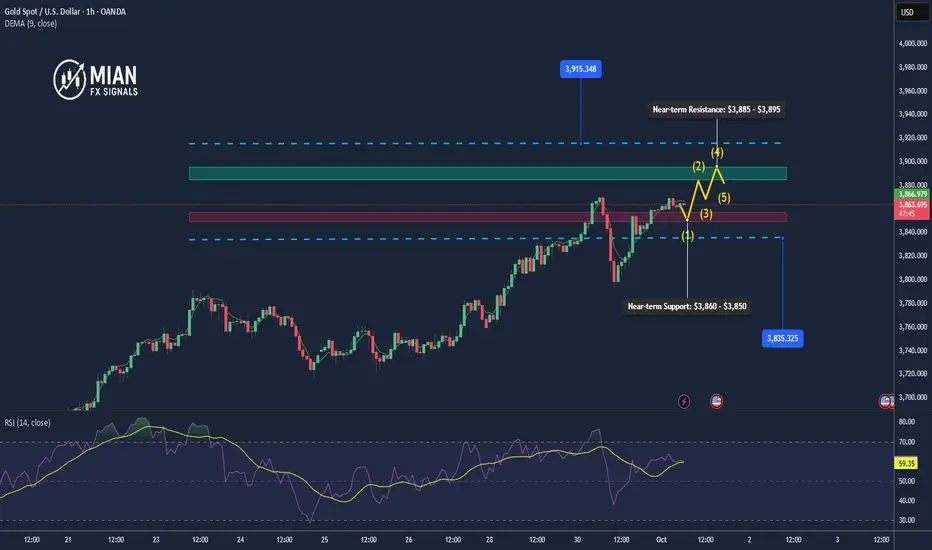
Gold is currently trading around $3,876.80/oz, after a strong rally in the previous session. Buying pressure remains stable as the USD shows signs of weakness, while safe-haven demand stays elevated. However, the market is cautious ahead of upcoming U.S. economic data releases.
📈 Technical Analysis
• Near-term Resistance: $3,885 – $3,895
• Strong Resistance: $3,915
• Near-term Support: $3,860 – $3,850
• Strong Support: $3,835
• EMA20 (H1): Price is holding above EMA20, indicating that the short-term uptrend remains intact.
• H1 Candlestick: Small-bodied candles suggest slowing bullish momentum, with potential for a technical pullback before resuming the trend.
📌 Outlook
Gold maintains a short-term bullish trend, but the $3,885–$3,895 zone will be a key challenge. A breakout above this level could drive price toward the psychological $3,900 mark and further to $3,915. Conversely, if profit-taking increases, price may retest the $3,860–$3,850 support zone.
🎯 Trading Strategy
🔺 BUY XAU/USD: $3,845 – $3,850
• 🎯 TP: 40 / 80 / 200 pips
• 🛑 SL: $3,840
🔻 SELL XAU/USD: $3,885 – $3,895
• 🎯 TP: 40 / 80 / 200 pips
• 🛑 SL: $3,900
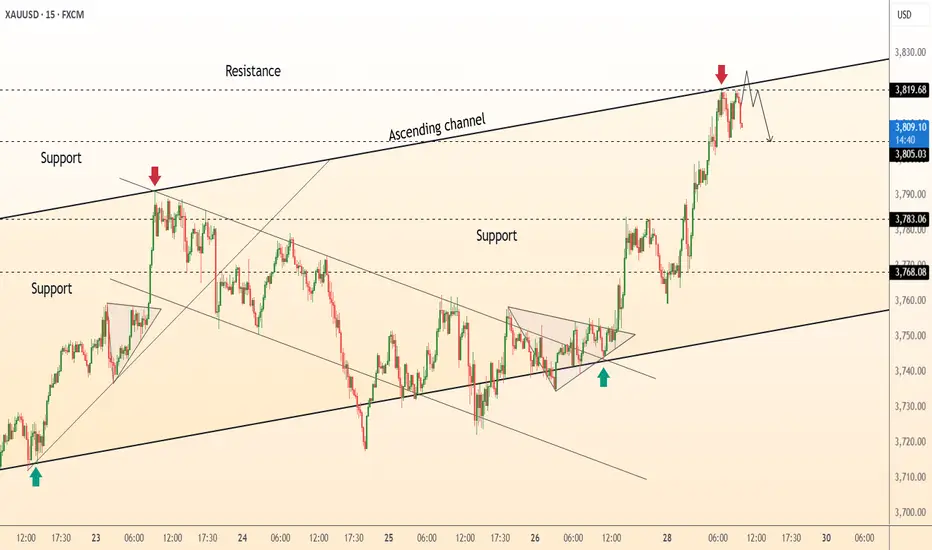
DeGRAM | GOLD reached the upper boundary of the channel📊 Technical Analysis
● XAU/USD hit resistance at 3819 within the ascending channel, showing rejection signals and forming a possible reversal pattern.
● The setup points to a short-term pullback toward 3805 and possibly 3768, while failure to reclaim highs strengthens the bearish case.
💡 Fundamental Analysis
● Rising U.S. yields and a stronger dollar weigh on gold, as recent Fed commentary signals a cautious stance on rate cuts.
✨ Summary
Gold faces rejection at 3819 resistance, with downside risk toward 3805–3768. Bearish momentum dominates unless price reclaims the highs.
-------------------
Share your opinion in the comments and support the idea with a like. Thanks for your support!
Any dip is a buying opportunity!Affected by the shutdown of the US economy, the gold bulls are approaching the 3895 line, and are only one step away from 3900. At present, gold is under pressure and is adjusting. We should not chase too much at high levels, but wait for a retracement before buying more.
From the 30-minute view, gold has seen consecutive rising positive lines, and the upward trend is still fierce. You can still continue to chase the long position, and the pressure level is 3390.

XAUUSD Gold (XAU/USD) reached a fresh all-time high of $3833 per troy ounce today, marking a +1.95% increase. This rally has pushed gold above the $3,800 level for the first time. The yellow metal is experiencing its best yearly performance since 1979, with year-to-date gains of +45.75%.

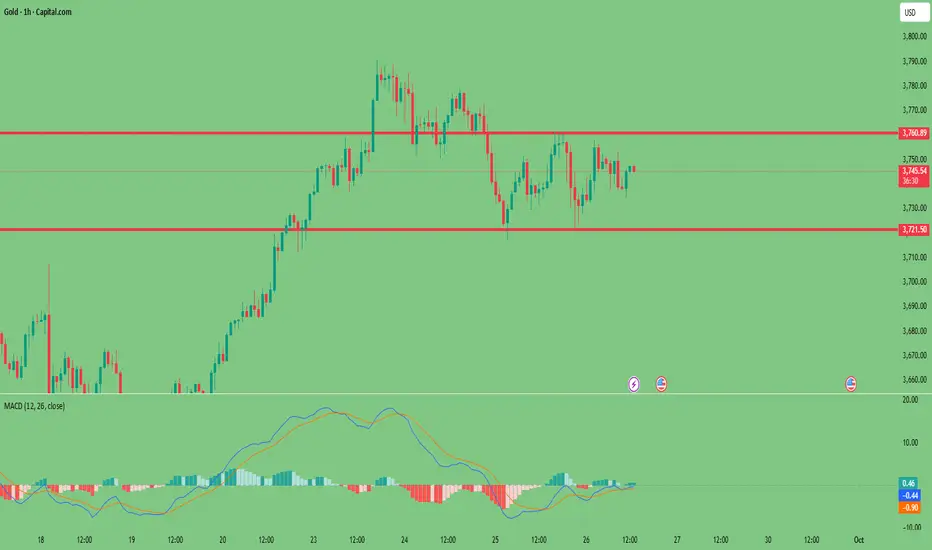
Should I go long or short at this time? Please read this articleToday's market trend is basically consistent with previous analysis views. The gold price stabilized and rebounded after hitting a second bottom at around 3720. Investors who previously established long positions near this level have realized substantial profits, successfully reaching their pre-set profit target of 3750 a few hours ago. I have already re-established a long position near 3730.
Since Tuesday's breakout, the market has been fluctuating and consolidating between 3760 and 3720, reflecting the ongoing tug-of-war between bulls and bears in this area. For traders, this type of range-bound market has more operational advantages than a unilateral trend. It not only provides opportunities for long orders, but also creates space for short orders, which is conducive to obtaining stable trading profits.
From a short-term technical perspective, we need to focus on the key resistance levels of 3750 and 3760. If the price effectively breaks through the above positions, it may open up further upside space. If gold prices pull back to the 3735-3725 range without a clear breakout, traders who are not already holding positions should consider establishing long positions in this area in batches.
Trading Strategy:
Buy Range: 3725-3735
We welcome your insights or questions regarding market trends or specific trading strategies. Leave a comment in the comments section to discuss future market trends and strategies.
xauusd50% retrace likey target 3956 with top blow upto 4200 who knows .. we should see a nice correction. possibly 3100 area minimum. depending on pa 5k target in next year/s

SIGNAL TYPE: BUY SIGNAL GOLD(XAUUSD)Market shows strength with bullish momentum building across key sessions.
Price is holding above important structural levels, with buyers stepping in to defend demand zones. If momentum continues, higher levels remain open for testing as the trend unfolds. Patience and confirmation are key, but the bias favors continuation to the upside while structure remains intact.
These are all done by my strategy based of price action

XAUUSD-Setting for drop?there is reversal patter on GOLD with potenial previous daily support to break. Market may continue to drop to fill the dialy fair value gap followed by 4h fair value gap may lead the price to continue to drop to support level.

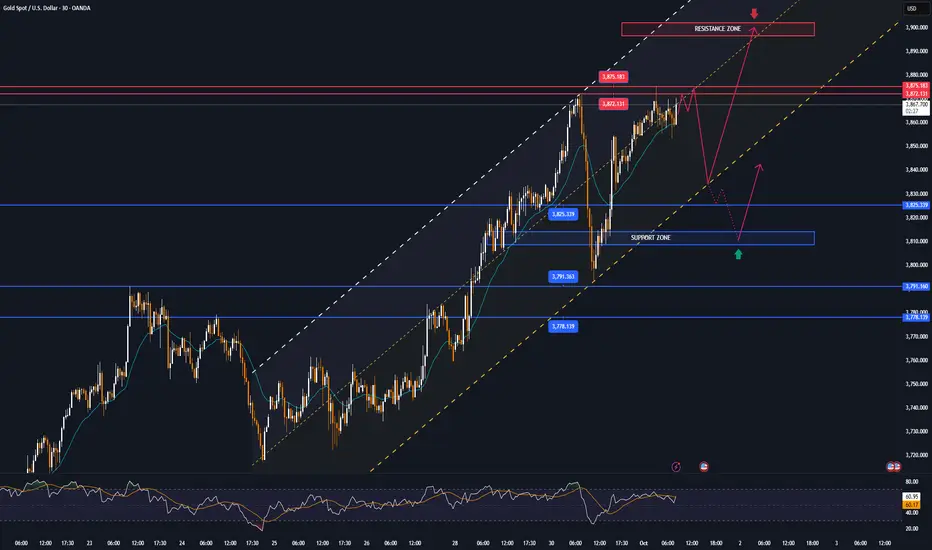
US budget deadlock causes GOLD to break peak, USD to plummetOn September 30, spot OANDA:XAUUSD prices jumped $24.7 to close at $3,858.23 an ounce, after hitting a new record high of $3,871.73 an ounce.
The main reasons came from two factors: concerns about a possible US government shutdown and weak employment data, which raised expectations that the Federal Reserve (Fed) would continue to cut interest rates. This put pressure on the US dollar and boosted demand for safe-haven gold.
According to the US Department of Labor, the number of jobs increased only slightly in August, while the demand for recruitment decreased sharply. Consumer confidence also fell to a five-month low. The US dollar index (DXY) therefore fell 0.17% to 97.78 - the lowest level in a week.
Experts say gold benefits from the weaker dollar and the prospect of the Fed cutting interest rates in October, with the probability of up to 97% according to the CME FedWatch tool.
Meanwhile, the stalemate between the two parties in Congress has put the US government at risk of running out of budget by midnight on September 30. If no agreement is reached, the shutdown will disrupt the release of many important economic data, including the non-farm payroll report.
If the US government shutdown lasts longer, the negative impact on the economy could force the Fed to loosen policy more strongly, thereby further boosting the gold price rally.
Technical outlook analysis of OANDA:XAUUSD
Main trend:
• Gold is still in a narrow uptrend channel (parallel uptrend channel).
• Candlesticks are sticking close to the upper edge of the uptrend channel ⇒ buying power is quite strong but also showing signs of “overextending”.
• RSI above 70 ⇒ Gold is in the overbought zone, risk of short-term correction.
Important levels (Fib + Resistance/Support):
• Strong resistance: 3,872 – 3,875 USD/oz (Fib 0.618 + psychological block).
• If broken, the next target is 3,938 – 4,022 USD/oz.
• Nearby support: 3,825 USD (Fib 0.5) and 3,778 – 3,791 USD (confluence of Fib 0.382 + horizontal support).
SELL XAUUSD PRICE 3901 - 3899⚡️
↠↠ Stop Loss 3905
→Take Profit 1 3893
↨
→Take Profit 2 3887
BUY XAUUSD PRICE 3810 - 3812⚡️
↠↠ Stop Loss 3806
→Take Profit 1 3818
↨
→Take Profit 2 3824
XAUUSD NEXT MOVE POSSIBLE Gold (XAU/USD) Buy Setup 📈
Gold is showing strong bullish momentum and holding above support levels. Buyers are in control, and the price has potential to extend higher.
📍 Entry: Buy from 3850
🎯 Target: 3900+
🛡 Stop-loss: Below nearest support
If momentum sustains, Gold is likely to push beyond the 3900 mark, offering a solid buying opportunity.

XAUUSD BUY SETUP Price action trading from a 4Hour Decisional Level and creating a PD Array as well, price showing its willingness to respecting bullish pd arrays, like fair value gaps and disrespecting the bearish ones. Expecting price to trade higher from the entry.

XAUUSD - Bullish Bias🔹 Pair: Gold (XAUUSD)
🔹 HTF Overview: Market structure remains bullish, with strong upside intent still intact.
🔹 MTF Outlook: Waiting for price to sweep short-term sell-side liquidity and mitigate the deeper OB below—this will refine the continuation play.
🔹 LTF Setup: Once MTF objectives are cleared, I’ll align with CHoCH and fresh OB prints on the lower timeframe to position long.
🔹 Targets: Eyes remain on higher liquidity pools in line with bullish market rhythm.
🔹 Mindset Note: Timing is everything—patience until MTF and LTF structure align.

Gold: Long from 3814 in ProfitAs highlighted in the weekly analysis, gold rebounded after testing the 3717–3791 range and successfully broke above the key 61.8% Fibonacci retracement level at 3762. The daily chart continues to reflect consolidation near recent highs, with expectations of a retest of the previous peak ahead of this week's Non-Farm Payrolls (NFP) data. While the medium-term outlook remains open to potential pullbacks on signs of exhaustion, short-term momentum stays constructive.
During today's session, gold broke above 3791 and extended gains to 3831, currently trading near 3825. The 4-hour chart confirms a bullish structure, with prices likely to continue grinding higher into the night session. The pre-NFP high may form around mid-week.
Key Levels:
Immediate Support: 3820–3816
Strong Support: 3810–3806
Immediate Resistance: 3831 (with stronger resistance yet to be established)
Trading Plan:
Our long entry from 3814 has already secured profits. For the upcoming session, focus remains on buying dips toward support.
📈 Strategy:
Look to buy near 3810
Stop loss: below 3800
Target: 3830 – with a break higher opening further upside
About me: With years of experience specializing in gold market analysis, I focus on combining technical precision with macroeconomic insights to help traders navigate volatility. My strategies emphasize risk-aware positioning and clear, actionable levels—whether you're new to trading or seeking more structured guidance.

The Golden Run Continues: XAUUSD Eyes $3800? The Golden Run Continues: XAUUSD Eyes $3800?
Prior Bullish Momentum & Consolidation : XAUUSD entered a period of consolidation following a robust bullish rally earlier in the year. This initial surge established a strong underlying demand.
Symmetrical Triangle Formation : This consolidation phase manifested as a well-defined symmetrical triangle pattern on the 4-hour chart. This pattern typically represents a period of indecision, or accumulation/distribution, before a continuation of the prior trend.
Decisive Bullish Breakout: Gold has now executed a powerful and decisive upward breakout from the upper trendline of this symmetrical triangle. This action confirms the prevailing bullish sentiment and signals the likely resumption of the uptrend.
Key Support Level Established: The former upper trendline of the triangle, now residing around the $3500 mark, has effectively transformed into a critical immediate support level. A successful retest and hold of this level would further validate the breakout.
Strong Upward Trajectory: Post-breakout, the price action has been emphatically bullish, currently exhibiting a steep ascent within the marked green channel, indicating significant buying pressure.
Primary Price Target at Based on the measured move principle, often applied to symmetrical triangle breakouts (projecting the height of the pattern from the breakout point), our primary upside target for XAUUSD is 3800. This implies significant rally potential from current levels.
Disclaimer:
The information provided in this chart is for educational and informational purposes only and should not be considered as investment advice. Trading and investing involve substantial risk and are not suitable for every investor. You should carefully consider your financial situation and consult with a financial advisor before making any investment decisions. The creator of this chart does not guarantee any specific outcome or profit and is not responsible for any losses incurred as a result of using this information. Past performance is not indicative of future results. Use this information at your own risk. This chart has been created for my own improvement in Trading and Investment Analysis. Please do your own analysis before any investments.

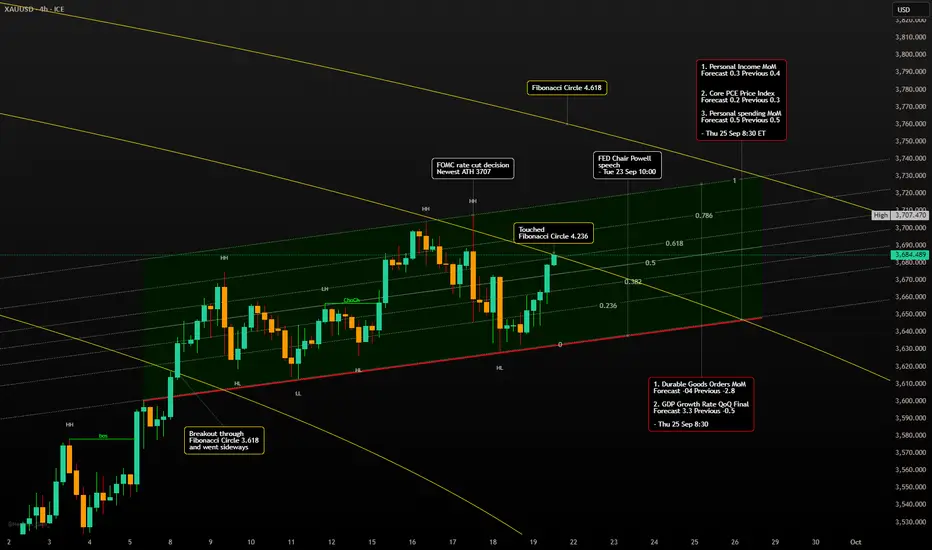
Gold Week Sep 22 - Sep 26 - Fibonacci Circles Breakout?🎢 Last Friday was a rollercoaster, and not the fun kind for me. 😅 My trading plan went completely haywire, and I'm pretty sure everyone reading was like, "What is this noob doing? 😂" But hey, we learn from our mistakes, right? So let's break down what happened.
FX_IDC:XAUUSD Crazy Friday 💥
I usually trade during the European session, and everything was going smoothly. Gold was behaving just as I expected, dropping to $3643. Then, chaos! 😱
First, it shot up to $3659, and just when I thought it was done, it decided to fall back down to $3643. But wait, there's more! At the start of the US session 🇺🇸, it went on a bullish rampage, soaring to $3685, the high of the day. 🚀 I was totally caught off guard! My bias was short because of the recent highs after the FOMC and rate cut news. That was a big lesson learned. 😩
What's Up Next? A Big Week Ahead! 🔮
Get ready, because this week is going to be HUGE! 🎉 My analysis shows that Gold is in a **super important spot** right now. It's in the perfect position to try and make a big move higher! 📈
You might not believe me, but my Fibonacci circle analysis is screaming "breakout!" 📢 If you draw a Fibonacci circle on the daily chart from **$3500.200 (April 21, 2025)** to **$3246.550 (June 29, 2025)**, you'll see a pattern of breakouts. And guess what? We're on one of those circles right now! It's no joke, you should totally try it yourself. 🤯
As long as Gold holds this level, it's primed for a surge. 🌊 I even drew an image showing that Gold is sitting right on the 4.236 Fibonacci circle level from Friday's close. This is serious stuff! 🧐
I'm expecting a sideways "ping pong" 🏓 kind of week until Thursday, bouncing around the 0.382 and 1 Fibonacci levels. The ascending parallel channel gives us a clue on where it might go in the short term.
Heads Up: This Week's Economic Events 📅
Keep an eye on these key events, as they can really shake things up! 🔔
Thursday, September 25th, 8:30 AM EST
- Durable Goods Orders MoM: Forecast -0.4% (Previous -2.8%)
- GDP Growth Rate QoQ Final: Forecast 3.3% (Previous -0.5%)
Friday, September 26th, 8:30 AM EST
- Personal Income MoM - Forecast 0.3 Previous 0.4
- Core PCE Price Index - Forecast 0.2 Previous 0.3
- Personal spending MoM - Forecast 0.5 Previous 0.5
My Two Cents: A Word of Caution 🙏
Things can change in the blink of an eye, so be careful! I don't know what the next Asian and EU session will bring, but I have a feeling the US session is gearing up to buy Gold again. 💰
Remember, different trading sessions (Asia 🌏, Europe, and the US) have different biases. Don't make the same mistake I did last Friday! 😔 Stay sharp and happy trading! 🚀
-------------------------------------------------------------------------
This is just my personal market idea and not financial advice! 📢 Trading gold and other financial instruments carries risks – only invest what you can afford to lose. Always do your own analysis, use solid risk management, and trade responsibly.
Good luck and safe trading! 🚀📊
GOLD PLAN UPDATE TODAY !Hello, traders!
During the Asian session, Gold dropped to the demand zone (DZ) that I had forecasted in the previous New York session. The price then showed a V-shaped rejection from the H4 order block. While this rally covered a large distance, the price action lacks the clear structure needed for an entry in my system. This type of move often indicates unusual buying and selling activity or market manipulation.
On the M15 timeframe, the price has already formed a Change of Character (CHOCH) and has rejected the nearest order block in the short term.
I anticipate seeing retail traders enter the market here, and I'm waiting for a liquidity grab at the lowest marked point, the 'X.' For this plan to remain valid, the demand zone must not be violated. If this scenario plays out, I will initiate a buy order according to my system.
My target is the high of the recent downward move. While the price has a high probability of reaching the supply zone (SZ) I've identified, the overall swing on the larger timeframe has turned bearish. Therefore, I will not be aiming for the full target. My risk-to-reward ratio for this trade will be 1:3, which is well within my trading rules.
My long-term outlook for this major swing is for the price to move toward the discount zone around 3700$/oz . I will re-evaluate the price action when it reaches that level.
Thank you for your support. Feel free to ask any questions in the comments below, and I will do my best to answer them.
Good luck, traders!

ANFIBO | XAUUSD Analysis – Daily Trading Plan (09.30.2025)Hello traders, Anfibo's here!
OANDA:XAUUSD Analysis – Daily Trading Plan
Overall Picture:
As anticipated, OANDA:XAUUSD has surged strongly above the $3,865/oz resistance level, delivering more than 600 PIPS of profit from the previously executed trading plan. This once again confirms the strength of the dominant bullish trend and the market’s confidence in gold as a safe-haven asset.
Heading into this week, I remain bullish, with gold likely to test the $3,880/oz level and potentially push further toward $4,000/oz, provided no negative news emerges. The $4,000 mark is not only a key psychological round number resistance but also aligns with the projected target of wave 5 in Elliott Wave structure on the Monthly timeframe – an area where strong profit-taking pressure often occurs. Traders should pay close attention to this zone.
Technical Outlook:
Short-term trend: Strong increase, momentum remains stable on H4 and Daily frames.
> SUPPORT KEY / BUY ZONES : 3790 - 3770 - 3750 - 3723 - 3713
> RESISTANCE KEY / SELL ZONES : 3825 - 3845 - 3860 - 3870 - 3882
Here's my Trading Plan today:
>>> SELL ZONE:
ENTRY: 3860 - 3870
SL: 3873
TP: 3835 - 3800
>>> BUY ZONE:
ENTRY: 3785 - 3795
SL: 3780
TP: 3835 - 3860 - 3870 - 3880
Risk Management:
- Prioritize buy trades in line with the dominant trend, limit countertrend shorts.
- Maintain a R:R ratio of at least 1:2 on all setups.
- Manage capital strictly, avoid overtrading during sideways phases before breakout.
GOODLUCK GUYS!!!

GOLD XAUUSD .GOLD ,the London correction was bought back by NEWYORK gold buyers, the strength of the buy back will be tested on the supply roof and our current all time high at 3870-3872.4 ,if buyers are not rejected at this level and they force there way above this zone on 1HR,2HR close ,look for retest and buy with 3890-3892 as targe , if the break 3870-3872.4.
the structure is giving an ascending trendline with multiple rejection like the current 3872.4 in London rejection sell ,the next touch into that ascending trendline will be 3954-4000$
ON flip side ,any bearish drop on a confirmed candle close below 3758-3760 will be a sell confirmation .
the dxy and us10y on a bearish drop today faces daily resistance to upswing
#xauusd #gold #dxy #us10y #dollar

Sept 30, 2025 - XAUUSD GOLD Analysis and Potential Opportunity📊 Analysis:
The overall plan remains buying dips into support.
Watch the 3800 level closely — if it breaks, a downside channel could open.
🔍 Key Levels to Watch:
• 3860 – Bullish target
• 3850 – Bullish target
• 3840 – Bullish target
• 3834 – Historical high
• 3828 – Support
• 3820–3823 – Support zone
• 3810 – Support
• 3800 – Key bull–bear pivot
• 3791 – Support
• 3785 – Support
📈 Intraday Strategy:
SELL: If price breaks below 3823 → target 3820, with further downside toward 3815, 3810, 3805
BUY: If price holds above 3831 → target 3834, with further upside toward 3840, 3845, 3850
👉 If you find this helpful or traded using this plan, a like 👍 would mean a lot and keep me motivated. Thanks for the support!
⚠️ Disclaimer: This is my personal view, not financial advice. Always use proper risk control.

GOLD-SELL strategy Mon thly chart Reg. ChannelGOLD is remaining extremely overbought since $ 3,600 upwards. It's a longer term viewpoint, hence the movements short-term are not relevant when managing long term positions, and one should expect not being able to fish for the top :). anyway, the RSI is in uncharted waters, but history tells us that this correction will be imminent. I remain in the believe and holding onto shorts adding slowly, i.e. careful adding to shorts with low leverage for the awaited correction.
Strategy SELL between $ 3,700-3,900 (and even lower before) and take profit near $ 2,950.
