XAU/USD | Gold Holds Strong and Targets Higher Levels!By analyzing the 4 hour chart for TVC:GOLD , we can see that after the bullish move earlier today, price dipped to $4040 but immediately bounced as demand stepped in. Gold is now trading around $4091.
If this momentum continues, I expect a push toward $4100, $4110, and $4130. After that, we’ll monitor the reaction around the levels mentioned in the previous analysis. The overall structure remains bullish as long as demand stays active.
Please support me with your likes and comments to motivate me to share more analysis with you and share your opinion about the possible trend of this chart with me !
Best Regards , Arman Shaban
Trade ideas

SMT secret smart money signal - All you need to knowHey whats up guys, in this post I want to show you how I use SMT divergence in my own trading to filter fake breaks and catch precise reversals. This is one of those things most traders never really dig into. Once you see it properly, you will not be able to unsee it.
It was popularized by ICT, but it is essentially Dow theory through a bit different perspective.
📌 What is SMT (Smart Money Tool )
It's a crack in correlation between two markets that normally move together.
One market takes the high or low. The correlated market does not. That difference is SMT divergence. And that why sometimes it's enough if only one instrument from those two highly correlated takes low and other doesn't.
Before SMT we need correlation.
Some markets like to move together. They will never be perfectly identical, especially on the lower timeframes, but the general swing structure is similar.
- EURUSD & GBPUSD
- AUDUSD $ NZDUSD
- XAUUSD & XAGUSD
- BTCUSD & ETHUSD
- NQ & ES & YM
You can find some more variations like EURJPY & GBPJPY etc.. But if you want to focus on precision your watchlist should contain just a few instruments. Not 20 unless you are position trader and your entry timeframe is Daily.
📌 Bearish SMT on positively correlated instrument's
One market makes a higher high. The other prints a lower high or equal highs.
📌 Bullish SMT. on positively correlated instrument's
One market makes a lower low. The other makes a higher low or equal low. 📌 Negative SMT Correlation
Its same only one pair is inverted which is DXY. We could say that in the Forex it would basically every currency with DXY. But No !!
‼️ Dont use DXY for correlation with AUDUSD and NZDUSD. Yes obviously they are affected by the DXY (Dollar) movement, but as these two are not included in the DXY. They are lagging. Yes at some point DXY affects them too, but just don't use them for the SMT. as SMT is like a quiet signal from smart money. One market shows the truth. The other is used as a trap. After this trap mostly sharp expansion happens. Its a signal for a timing that its ready.
📌 EURUSD and GBPUSD Example
GU - just shallow manipulation but creates clean OB
EU - Deeper manipulation but OB created later. ‼️ SMT is not a strategy
On its own that does not give you an edge. The key is what it says about the willingness of big players to push price. If DXY runs above a previous highs and EUR and GBP refuses to take out its opposite lows , that is lack of commitment to continue that move. Someone is offside. Dumb money sells late or buys late, smart money quietly positions on the other side.
📌 EURUSD and DXY Example
DXY makes higher high above monthly highs, EUR fails to take lows. Correlation disconnected. EUR is stronger and if its within CLS range reversal can occur. what does GBP at the same moment? also failed to make a lower low hence is stronger than USD. If it aligns with the strategy reversal is confirmed.
📌 This is how I traded this setup below.👇 Click to the chart to see how it played out 📌 SMT is a way to read who is actually in control. It helps me see if a break of structure is real continuation or just a liquidity raid dressed as a breakout.
📌 Where to use it for efficiency
You can find small SMT differences all day on lower timeframes. Try to trade every one and you will bleed slowly. I care about SMT only at important areas.
- CLS ranges - Weekly , Monthly , Daily
- Previous week low, previous week high, clear swing extremes.
- Key levels from my higher timeframe analysis
- HTF Fair value gaps and order blocks that fit my narrative.
📌 XAU & XAG Example
Both in the uptrend and created nice CLS range. Gold made a just shallow manipulation but is it enough ? Let's have a look to the silver we can see that silver made much deeper manipulation so it can confirm our Gold trade. Also notice that how exactly after the temporary correlation disconnection the expansion move started. These disconnections are trap and mostly followed by strong expansion move. 📌 Here is the setup I posted here and traded 👇 📌 Which pair I choose to trade
When I see SMT between two correlated markets, I decide which one I want to use.
The weaker market is the one that takes the high or low and disrespects the level. That is where late traders are stuck. This market has advantage for tight stop just beyond the stop hunt.
⁉️So which one would you chose on the SMT signal bellow the range ?https://www.tradingview.com/x/8pWYJbLP/ let me know in the comments.
The stronger market is the one that respects the level and refuses to sweep the extreme and you need to have conviction in the HTF trend so you can confidently place SL below un-manipulated lows. This one usually respects fair value gaps and order blocks better and often gives cleaner candles and stronger pushes.
📌 SMT Fills
Two correlated markets are moving together. One fills its fair value gap, the other leaves a part of it open. That difference can give you an extra reason for a reaction. It is like one chart did the work of cleaning up inefficiency, the other did not, and price tends to respect the one that is cleaner.
📌 BTC & ETH Timing and Gap fills
We can see SMT on the top where BTC made higher highs but ETH failed to do so = crack in correlation. Now focus on ETH it has created on Order block which signaled reversal, while BTC didnt had it yet = Your advantage seeing what is not seen yet.
📌 GAP fills
Look at the FVG on the BTC it was not filled fully and BTC made higher high, while ETH filled gap full and made lower low. Also BTC gave you Order block while ETH not yet again you have
📌 The SMT trap and how I avoid it
A lot of traders get hurt by SMT because they treat it like a magic reversal button.
They see euro taking a low and dollar failing to take a high, or Bitcoin taking a high and Ethereum failing to match it, and they jump in without any extra confirmation. Sometimes it works. Many times price just keeps pushing, prints another leg, and wipes them out.
Use it only at specific levels to confirm your strategy and give you extra edge in seeing confirmation on highly corelated pairs before it plays out.
SMT alone never gives me permission to trade. I want at least one strong confirmation candle at my level and, for bigger trades, a clear Change in order flow.
Adapt useful, reject useless.
David Perk - Aka Dave FX Hunter

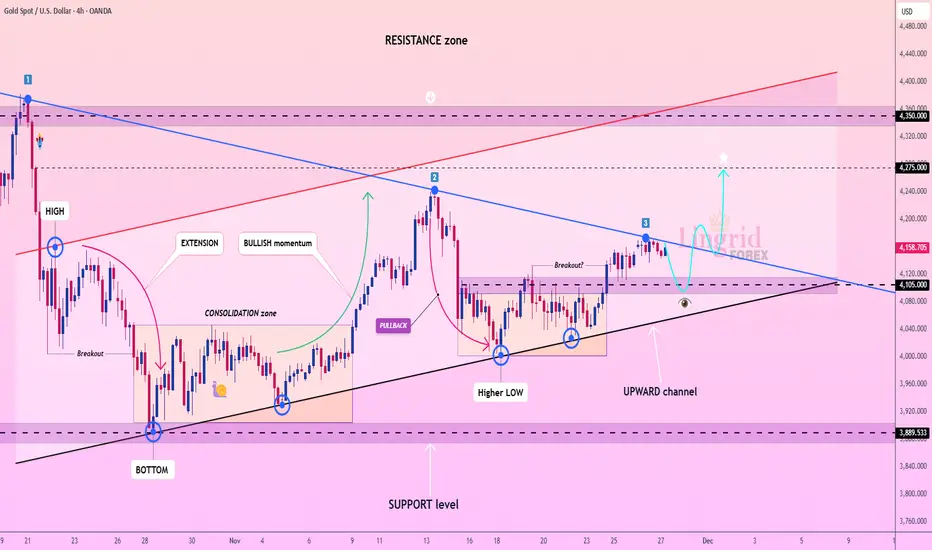
Lingrid | GOLD Trendline Break - Price AccelerationOANDA:XAUUSD is testing the downward trendline for the third touch, a historically significant point where price often attempts a breakout. The market structure has been steadily building higher lows from the 3,900 support level, while buyers continue to defend the bottom of the upward channel. Current consolidation just above 4,100 suggests accumulation rather than exhaustion, especially after price already produced a clean rebound from the channel floor.
If TVC:GOLD breaks and holds above major trendline, momentum may accelerate quickly toward 4,275, the mid-resistance barrier inside the broader supply zone. A successful continuation above this mark opens the way for a deeper squeeze, where major liquidity sits. With USD volatility cooling and safe-haven demand stabilizing, the bullish scenario remains favorable as long as price maintains bullish structure.
➡️ Primary scenario: breakout above trendline → continuation toward 4,275.
⚠️ Risk scenario: failure at trendline → drop back toward 4,000 support.
If this idea resonates with you or you have your own opinion, traders, hit the comments. I’m excited to read your thoughts!
Gold 30-Min — Volume Sell Reversal Triggered⚡Base : Hanzo Trading Alpha Algorithm
The algorithm calculates volatility displacement vs liquidity recovery, identifying where probability meets imbalance.
It trades only where precision, volume, and manipulation intersect —only logic.
✈️ Technical Reasons
/ Direction — SHORT / Reversal 4191 Area
☄️Bearish rejection confirmed through sharp candle body.
☄️Lower-high forming beneath resistance supply region.
☄️Volume decreasing confirms exhaustion in price rally.
☄️Sellers regained imbalance with heavy top rejection.
☄️Algorithm detects fading demand and shift to control.
⚙️ Hanzo Alpha Trading Protocol
The Alpha Candle defines the day’s real control zone — the first battle of momentum.
From this origin, the Volume Window reveals where the next precision strike begins.
⚙️ Hanzo Volume Window / Map
Window tracked from 10:30 — mapping true market behavior.
POC alignment exposes institutional bias and breakout potential zones.
⚙️ Hanzo Delta Window / Pulse
Delta window monitors real buying vs. selling power behind each move.
Tracks volume aggression to expose who controls the candle — buyers or sellers.
When Delta aligns with Volume Map, momentum becomes undeniable.

Lingrid | GOLD Complex Correction Short SetupOANDA:XAUUSD is testing the 4,150 resistance zone, where price might form a potential fake break. The move stalled right at confluence between the red long-term resistance trendline and the ceiling of the range, signaling possible buyer exhaustion. Price is now slipping back beneath the broken breakout level, suggesting that momentum is shifting back in favor of sellers as intraday structure loses strength.
If bearish pressure continues, TVC:GOLD is positioned to rotate toward 4,095, with the broader correction where the next liquidity cluster sits. As long as price remains capped under 4,160, the downside scenario remains dominant, especially with markets awaiting key USD-driven macro catalysts (PPI) that could strengthen the dollar and weigh further on gold.
➡️ Primary scenario: rejection holds → drop toward 4,095.
⚠️ Risk scenario: a clean breakout above channel flips momentum and opens room toward higher levels.
If this idea resonates with you or you have your own opinion, traders, hit the comments. I’m excited to read your thoughts!

Gold Buyers Regain Momentum — Aiming for 4,240 RetestHello traders! Let’s break down the current XAUUSD structure. Gold is trading within a broad ascending structure after forming a strong local bottom around the Support Line, where buyers entered the market and started to push the price higher. This upward movement follows a long corrective phase, during which the price respected the diagonal Support Line multiple times — confirming the presence of a stable bullish trend. Earlier, XAUUSD broke out of the Buyer Zone (4,110–4,120), retested it, and successfully held above it. This zone now acts as a key demand area and the primary level where buyers continue defending the trend. A previous bearish attempt failed here, forming a fake breakout and leading to a new bullish impulse. The price is now approaching the descending Resistance Line, which has repeatedly pushed gold lower during the recent correction. A clean breakout above this trendline may open the way for the price to move toward the major Resistance Level at 4,240.00, which also aligns with the first take-profit area (TP1). This Resistance Level has acted as a strong reaction zone multiple times, causing sharp pullbacks and marking the boundaries of the Seller Zone. Buyers will likely face significant opposition here once again. If gold respects the Buyer Zone and maintains trading above 4,110, the bullish scenario remains intact, and the price may push toward TP1 → 4,240. A confirmed breakout above this level would signal continuation toward higher targets within the broader bullish structure. However, if XAUUSD fails to hold the Buyer Zone and breaks below 4,110, the bullish outlook becomes invalid. In this case, the price may revisit the lower trendline or enter a deeper correction toward previous support areas. For now, the structure remains moderately bullish, with buyers dominating as long as the price stays above demand and respects the ascending Support Line. Please share this idea with your friends and click "Boost" 🚀

Lingrid | GOLD Weekly Analysis: Coiled Spring at Key CrossroadsOANDA:XAUUSD price action has settled into a tense, range-bound struggle, repeatedly testing the ascending trendline that has defined its path since late October. This persistent retest is a double-edged sword: while it demonstrates underlying buying interest, it also signals exhaustion and a growing risk of failure. The market is now at a critical juncture where the next decisive move will determine the immediate direction. A close below this trendline would be a significant bearish signal, such a break often triggers a deeper corrective pullback to complete an ABC pattern. Conversely, a strong breakout above the recent lower high near $4,130 could reignite the bullish momentum and target the $4,200 resistance zone.
The broader structure on the 4-hour chart reveals a clear downward channel forming from the peak in mid-October, with price currently trapped between the channel’s upper boundary and the ascending trendline support. This creates a tightening triangle pattern, a classic consolidation formation that typically precedes a sharp, directional move. Key levels to watch are the immediate support around $4,020 and the more substantial monthly low near $3,930. The current corrective move phase suggests the market is digesting prior gains, and the upcoming catalyst—whether it’s a fundamental driver or pure technical exhaustion—will likely force a resolution. The repeated tests of resistance near $4,230 have so far been unsuccessful, reinforcing the view that bulls lack the conviction to push higher without a catalyst.
For us the strategy is simple: wait for the breakout. The neutral stance is warranted as long as price remains within the converging trendlines. A close below the ascending trendline would be a clear sell signal, targeting the $3,930 support area. On the flip side, a sustained move above $4,150, especially with increasing volume, would be a buy signal, opening the path toward $4,200 and potentially $4,300. Until then, the market is in a holding pattern, with the balance of power shifting with every candle. The key takeaway is that the longer price trades in this narrow range, the more explosive the eventual breakout is likely to be, making patience the most valuable tool for navigating the coming week.
If this idea resonates with you or you have your own opinion, traders, hit the comments. I’m excited to read your thoughts!

GOLD → Neutral price channel... Waiting for news FX:XAUUSD is testing the lower boundary of the 4060 channel and rebounding, maintaining moderate fluctuations in anticipation of key US data. Focus on 4040 - 4100...
The probability of a Fed rate cut in December has risen to 74% following comments by J. Williams
The unusual situation surrounding the Russia-Ukraine conflict means that any hints of de-escalation could trigger a correction in the metal...
The trading week will be relatively short, as Thursday and Friday are public holidays in the US, and the market may see reduced volatility.
Focus on the following news:
- PPI (forecast +0.3%) and US retail sales
- Q3 GDP and PCE index (inflation)
Gold remains sensitive to Fed comments and geopolitics. Strong data could lower expectations for policy easing. A breakout is likely after the release of inflation data and GDP. Rising odds of a rate cut in December limit downside potential.
Resistance levels: 4100, 4111
Support levels: 4040, 4024
Gold is being held within its current trading range. The last four trading sessions indicate uncertainty about the future direction. In this case, it is worth considering trading within the current boundaries first. I expect a retest of resistance and a subsequent downward rebound.
Best regards, R. Linda!

XAUUSDHello Traders! 👋
What are your thoughts on GOLD?
Gold continues to trade in a range-bound and choppy structure, showing back-and-forth movement with no clear directional bias in the short term.
In the current zone, price is trapped between channel resistance and key support, and a breakout from either side will determine the next strong move.
We expect gold to form a short-term upward correction toward the upper boundary of the descending channel and the resistance zone.
Once price reaches this area, a bearish rejection is likely, leading to a continuation of the downward trend toward lower support levels.
If gold breaks below the 4050 support zone and the daily candle closes below this zone,
this will confirm further downward continuation without any bullish pullback, signaling a stronger bearish wave.
As long as gold remains below the resistance zone and channel top, the short-term bias stays bearish.
Any upward movement is likely to be corrective, providing a potential setup for continuation to the downside.
Don’t forget to like and share your thoughts in the comments! ❤️

Gold 30-Min — Volume Sell Reversal Triggered⚡Base : Hanzo Trading Alpha Algorithm
The algorithm calculates volatility displacement vs liquidity recovery, identifying where probability meets imbalance.
It trades only where precision, volume, and manipulation intersect —only logic.
✈️ Technical Reasons
/ Direction — SHORT / Reversal 4134 Area
☄️Bearish rejection confirmed through sharp candle body.
☄️Lower-high forming beneath resistance supply region.
☄️Volume decreasing confirms exhaustion in price rally.
☄️Sellers regained imbalance with heavy top rejection.
☄️Algorithm detects fading demand and shift to control.
⚙️ Hanzo Alpha Trading Protocol
The Alpha Candle defines the day’s real control zone — the first battle of momentum.
From this origin, the Volume Window reveals where the next precision strike begins.
⚙️ Hanzo Volume Window / Map
Window tracked from 10:30 — mapping true market behavior.
POC alignment exposes institutional bias and breakout potential zones.
⚙️ Hanzo Delta Window / Pulse
Delta window monitors real buying vs. selling power behind each move.
Tracks volume aggression to expose who controls the candle — buyers or sellers.
When Delta aligns with Volume Map, momentum becomes undeniable.

XAUUSDHello Traders! 👋
What are your thoughts on GOLD?
Gold corrected upward as expected, reaching the top of the descending channel and the resistance zone, where it showed a clear price rejection.
In this region, gold is expected to show some consolidation and liquidity buildup, followed by a renewed bearish move toward the lower marked levels.
Political and geopolitical developments — especially talks and the possibility of a peace agreement between Ukraine and Russia — may accelerate this bearish movement.
As long as price fails to break above the resistance zone and the channel top, the short-term outlook remains bearish, and any upward correction should be viewed only as a pullback.
Don’t forget to like and share your thoughts in the comments! ❤️

Gold - This is the bullrun top!⚰️Gold ( OANDA:XAUUSD ) is slowly reversing now:
🔎Analysis summary:
Starting back in the end of 2015, Gold established another major bullish cycle. Ever since the rounding bottom breakout, Gold has been rallying higher and higher. But at this exact moment, Gold retests major resistance and is slowly starting to create a reversal.
📝Levels to watch:
$4,000
SwingTraderPhil
SwingTrading.Simplified. | Investing.Simplified. | #LONGTERMVISION

GOLD → Distribution phase. Focus on 4150...FX:XAUUSD is trading at a one-and-a-half-week high, supported by a weaker dollar and growing expectations of Fed policy easing. More news ahead...
US PPI inflation showed signs of slowing (2.7% y/y). Retail sales and consumer confidence were weaker than expected. The probability of a Fed rate cut in December rose to 85%. Fed members (Williams, Waller, Miran) supported the possibility of easing
However, progress in Russia-Ukraine negotiations is limiting growth
Today, attention is focused on data on jobless claims and durable goods orders
The combination of soft monetary policy, geopolitical risks, and structural demand from the Central Bank creates a favorable backdrop.
Resistance levels: 4156, 4211
Support levels: 4146, 4111
Gold continues to recover after breaking out of consolidation and holding above 4110. Focus on the next trading range (consolidation) of 4156 - 4111. If the bulls keep the price above 4146 - 4156, the next target could be 4211 - 4245.
Best regards, R. Linda!

XAUUSD: Buyers Aiming for a Rebound Toward $4,170 ResistanceHello everyone, here is my breakdown of the current Gold setup.
Market Analysis
XAUUSD continues to trade within a corrective structure, forming a broad Triangle Pattern defined by the Triangle Resistance Line above and the Triangle Support Line below. After a strong impulsive rally earlier, gold entered a prolonged consolidation phase, highlighted by a clear Range Zone where price repeatedly tested both the upper and lower boundaries without establishing a directional breakout. Several Breakouts occurred during this period, but each bullish attempt failed to secure continuation, leading to pullbacks that kept the market inside the broader consolidation. This showed clear indecision and a balanced battle between buyers and sellers.
Currently, gold retested the Support Zone around $4,040–$4,060, which coincides with the Triangle Support Line. A fake breakdown occurred below this level, but the market quickly bounced back, confirming strong demand and rejecting the bearish attempt. This rebound signals that buyers are actively defending the structure. Price is now stabilizing above support and showing early signs of bullish pressure. If buyers maintain control, the next logical target becomes the major Resistance Level at $4,170, which has acted as a key cap on previous bullish attempts. As long as XAUUSD stays above the Support Zone and trades within the rising trendline structure, the overall market bias remains moderately bullish.
Scenario & Strategy
I expect gold to gradually move upward from the current support area and retest the $4,170 Resistance Level. Minor corrections may occur along the way, but as long as price holds above $4,040, the bullish scenario remains valid. A clean breakout above $4,170 could trigger a stronger bullish continuation toward the next supply zone.
However, a breakdown below the Support Zone and Triangle Support Line would invalidate the bullish scenario and open the way for deeper correction. For now, buying the dips remains the more favorable approach as long as gold respects demand and stays within the triangle structure.
That's the setup I'm tracking. Thank you for your attention, and always manage your risk.

XAUUSD: Stuck Above 4,000, Just Waiting for the Next DropThe current context shows gold being “squeezed” between two forces : on one side, improving risk appetite as markets expect the Fed to cut rates; on the other, ongoing geopolitical and global financial concerns . As a result, price is holding above 4,000 but finding it hard to break higher.
On the H1 chart, XAUUSD is moving sideways with a slight downside tilt, spending most of the time inside or below the Ichimoku cloud . The latest bounce only reached the 4,100 area before being sold off again, showing that the cloud and the top of the channel are still acting as a lid on the downtrend. In the middle of the range, price is hovering around the temporary support at 4,050 – which is also the level highlighted on the chart as a potential breakdown point.
Trading idea: if price fails to hold 4,100 and we get a clear H1 close confirming weakness, the intraday bearish trend could resume and drag gold back toward the 4,050 zone.
Good luck and trade safe!

XAUUSD: Gold Continues to Rise on Rate Cut ExpectationsGold continues its upward trend from yesterday, with the current price at 4,159.455 USD. The chart shows that gold is moving within a stable upward channel, and if it maintains above this support level, there is a high likelihood that the price will continue towards the 4,190,000 USD level.
Why is gold continuing to rise?
Weaker-than-expected U.S. retail sales data has reinforced the forecast that the U.S. Federal Reserve (Fed) will cut interest rates in December 2025. This has weakened the USD, which in turn reduces yields and increases gold's appeal as a safe-haven asset. These factors, combined with expectations of rate cuts, suggest that gold has the potential to continue rising sharply.
Next Scenario:
If the price of gold stays above the 4,120,000 USD support zone, there is a high probability it will break through the 4,190,000 USD resistance level. The potential for continued upward movement could push gold to 4,230,000 USD in the near future.
With strong support and a favorable market backdrop, XAUUSD is likely to continue this upward trend, especially as labor market data from the U.S. is released.

XAUUSD Ascending Channel Strengthens: Bulls Target $4,130 TP1Hello traders! I want to share my view on the current XAUUSD setup. After a deep corrective move, gold has formed a local bottom around the Support Level at $4,000–$4,030, where strong buying pressure has re-entered the market. As shown on the chart, price is gradually climbing within a well-defined ascending channel, supported by the rising trendline and a parallel upper boundary. Inside this structure, the Buyer Zone has played a crucial role, providing the base for previous impulsive breakouts. Several fake breakdowns below the channel support confirmed the presence of significant demand. After these rebounds, XAUUSD twice reached the Seller Zone and the Resistance Level near $4,130, where it faced clear rejection and rotated back toward the Buyer Zone. Currently, gold is holding above the ascending channel support. If buyers continue to defend the $4,030 level and price remains stable within the Buyer Zone, I expect a move toward TP1 → $4,130, which is the nearest resistance. A clean breakout above this level would open the door for further bullish continuation toward the upper supply area around $4,200–$4,230. However, if the price breaks below the Buyer Zone and drops out of the channel, the bullish scenario becomes invalid, and the market may revisit the $4,000 support area. For now, the structure remains moderately bullish as long as price holds above demand and stays inside the ascending channel. Please share this idea with your friends and click Boost 🚀

XAUUSD (Gold) Next Buying Move Analysis XAUUSD Analysis (1H Chart)
Price is moving inside a clear range, reacting between the marked support and resistance zones. After forming a strong low at the support area, the market is showing signs of a potential pullback toward the resistance zone above. If price retests this resistance and fails to break higher, a clean short opportunity can form, targeting the support zone again.
Overall structure shows BOS/CHOCH confirming internal shifts, so wait for bearish confirmation at resistance before entering shorts. Perfect setup for range-to-range trading.
❤️ please support with Boost and Comments Really i need your support please give feedback thankyou ❤️

GOLD → Psychological level retest before growth FX:XAUUSD breaks through consolidation resistance and renews its high to 4155. As part of a minor correction, a retest of 4100 may form and a battle for key support...
The probability of a Fed rate cut in December has risen to 81%. Fed members (Williams, Waller, Daly) supported the possibility of easing this year.
Progress in negotiations between the West and Ukraine with Russia reduces demand for defensive assets.
Gold remains sensitive to inflation and retail sales data. Strong figures could adjust rate expectations and limit growth, while weak data would support the bulls.
Technically, a retest of the 4110-4100 zone is forming. If the bulls hold their ground above this level, a new trading range of 4100-4150 could form.
Resistance levels: 4155, 4211
Support levels: 4111, 4100
The importance of the 4100 zone is that it is an area of imbalance and breakeven, a consolidation boundary, as well as a psychological level. Accordingly, the reaction to this area should be aggressive. If the reaction is weak, the price may be dragged below 4100. Otherwise, I expect consolidation above 4111 and further growth to 4155 (possibly to 4200).
Best regards, R. Linda!

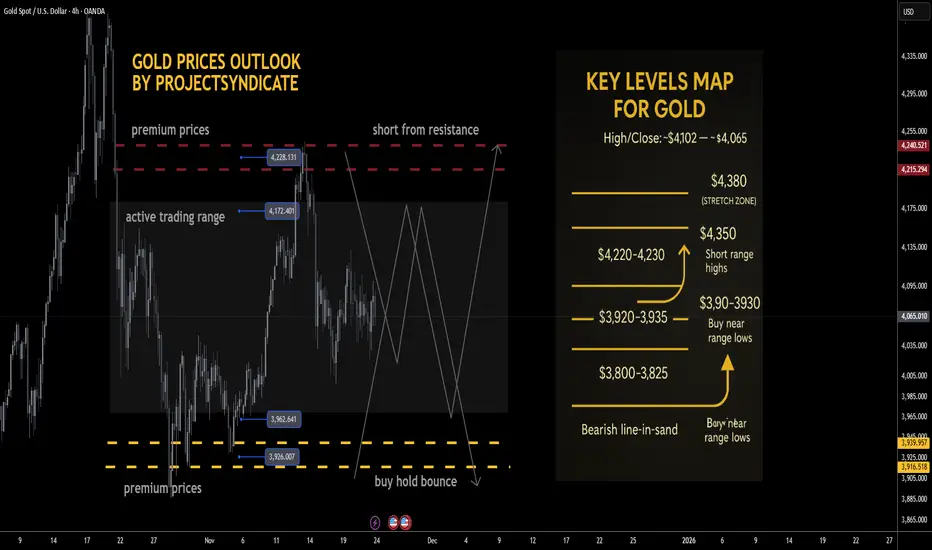
Gold next week: Key S/R Levels and Outlook for Traders🔥 GOLD WEEKLY SNAPSHOT — BY PROJECTSYNDICATE 🏆
High/Close: ~$4,102 → ~$4,065 — tight, inside-feel week with price holding comfortably above the $4,000 handle. Flows look balanced: steady two-way interest, but no strong directional conviction as the market oscillates within a well-defined range.
________________________________________
📈 Trend:
Still bullish on the higher timeframe, but very clearly in range / two-way mode. As long as we’re capped below the $4,350–4,375 ATH supply block and holding above the $3,900s, the playbook remains “range-trade the extremes” rather than chase breakouts.
________________________________________
🛡 Supports Buy Zones
• $3,920–3,930 — key range lows / primary dip zone:
o Your preferred “buy low” area; recent reactions show responsive buyers defending this shelf.
o This is the first major liquidity pocket for range longs and a natural first target for shorts from resistance.
• $3,800–3,825 — deeper demand pocket / fail-safe shelf:
o Secondary, more extreme downside area where higher-timeframe dip-buyers are likely to step in.
o A clean break and daily close below here would suggest the range is failing and a deeper mean reversion is in play, not just a normal pullback.
________________________________________
🚧 Resistances Short Zones
• $4,220–4,230 — immediate range resistance / short-sell zone:
o Your core “short from resistance” idea; this band remains a logical area to fade strength.
o First tests into this region are attractive for tactical shorts, especially if intraday momentum is stalling.
• $4,350–4,375 — ATH heavy resistance block:
o Still the major supply area above.
o Any spike here is a fade candidate unless price starts accepting above it with strong volume and multiple daily closes.
________________________________________
🧭 Bias – Coming Weeks
Base expectation is continued range-bounce price action between roughly $3,920–$4,220, with the broader structure still nested inside the larger $3,800–$4,350 range:
• Preference to fade strength into $4,220–4,230, targeting rotations back toward $3,920–3,930.
• Conversely, buy dips into $3,920–3,930 for moves back toward $4,220–4,230, as long as we hold the $3,800 shelf on a closing basis.
• Invalidation of the “range grind” idea comes on:
o Sustained acceptance above $4,350–4,375 (turns it back into trend-up).
o Or a decisive loss of $3,800–3,825 (opens a deeper corrective leg).
________________________________________
🔝 Key Resistance Zones
• $4,220–4,230 — front-line ceiling; aligns with your tactical short-sell band. Strong candidate to initiate shorts on first, clean tests.
• $4,350–4,375 — prior ATH / macro supply block. Only flips from “sell zone” to “bullish continuation base” if reclaimed and held as support.
🛡 Support Zones
• $3,920–3,930 — primary range low and first major liquidity shelf; ideal first take-profit for shorts and main dip-buy area.
• $3,800–3,825 — deeper support; loss of this level changes the narrative from “sideways digestion” to “larger corrective structure.”
________________________________________
⚖️ Base Case Scenario – Range / Consolidation
Core view: Market continues to oscillate between $3,920–$4,220, within the broader $3,800–$4,350 band.
• Pushes into $4,220–4,230 are sellable for rotations back toward $3,920–3,930.
• Dips into $3,920–3,930 are buyable for rotations back toward $4,220–4,230, as long as structure and flows remain balanced.
• While weekly closes keep rejecting the $4,350–4,375 ATH block, the default remains “sell strength, buy clean range lows.”
________________________________________
🚀 Breakout / Breakdown Triggers
• Bull trigger:
o Sustained acceptance above $4,350–$4,375, with multiple daily closes holding above and that band starting to act as support.
o That would shift tone from “range trading” back to full-on bullish trend, reopening path toward and beyond prior extremes (~$4,400+ in your framework).
• Bear trigger:
o A decisive daily close below $3,800 converts the current “healthy sideways correction” into a deeper, more directional liquidation phase, likely targeting prior lower shelves and expanding volatility.
________________________________________
💡 Market Drivers to Watch
Even in a range, macro and flow catalysts dictate which side of the range gets tested first:
• Real yields & Fed path: Any hawkish repricing or upside surprise in data tends to cap rallies near resistance; dovish shifts / easing fears support the lower end of the range.
• U.S. fiscal / political noise: Episodes of stress typically underpin gold; temporary relief or “risk-on” swings can blunt upside and push price back toward range lows.
• Flows & positioning: After a massive secular run, fast money continues to fade extremes, locking in profits into strength and reloading near range lows.
• Cross-asset behavior: If risk-off hits and gold fails to catch a bid (selling alongside equities), expect deeper probes into the lower end of the range before strategic buyers step back in size.
________________________________________
🔓 Bull / Bear Trigger Lines
• Bullish above: $4,350–$4,375 (sustained acceptance; ATH block reclaimed and used as support).
• Bearish below: $3,800 (shifts from contained range to deeper correction regime).
________________________________________
🧭 Strategy – Focus on Trading the Range
Primary plan – short from resistance (core idea):
• Entry zone:
o Scale into shorts around $4,220–$4,230 (front edge of resistance).
• TP #1:
o $3,920–$3,930 — key range lows; logical place to close majority of the short.
• Runner / extension:
o Leave a runner targeting $3,800–$3,825 if momentum and macro tone turn heavier.
• Risk / invalidation:
o Hard invalidation if price accepts above $4,350–$4,375 (multiple daily closes and successful retests from above).
________________________________________
Alternative plan – buy low from key range lows:
• Entry zone:
o Stagger bids in $3,920–$3,930; add more aggressive size only if we see responsive buying and positive reaction there.
o Optional deeper add zone at $3,800–$3,825 for higher conviction swing longs if structure still looks constructive.
• Exit zone / targets:
o First target back into $4,220–$4,230; heavily de-risk or fully exit as we approach that band.
• Risk management:
o Cut or significantly reduce longs on a daily close below $3,800 or if price accelerates through that shelf on high volume.
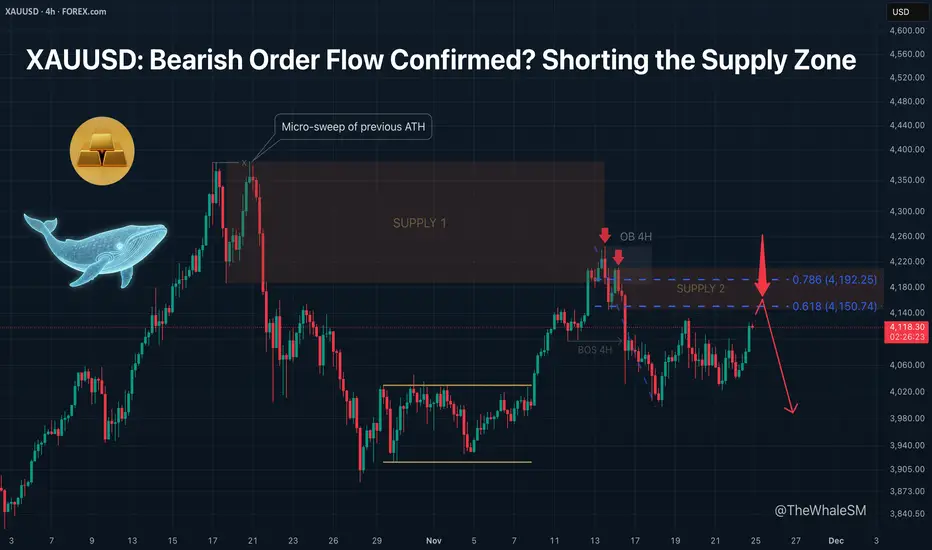
XAUUSD: Bearish Order Flow Confirmed? Shorting the Supply Zone.After updating the All-Time High (ATH), Gold performed a micro-sweep of liquidity from the previous ATH. This move was engineered via a Supply Zone . Following the sweep, this zone was mitigated, initiating a bearish order flow that broke the 4H structure to the downside (BOS 4H).
After the structural break, the price began approaching a second Supply Zone . A reversal is possible from this area to continue the bearish order flow, targeting an update of the structural low at $4000 . A full break of this low would indicate a high probability of a deeper correction on the higher timeframe.
✅ Short Setup Conditions:
Aside from the mitigation of the Supply Zone, I am looking for a reversal reaction from the 61.8% Fibonacci retracement level . The price must find acceptance below this level upon reaching it.
❌ Invalidation:
The short scenario is invalidated if the 61.8% level is broken. In that case, Gold will face further resistance at the 78.6% Fib level , but forming a short setup there is less probable than from the 61.8%.
~~~~~~~~~~~~~~~~~~~~~~~~~~~~~~~~~~~~~~~~~~~~~~~~~~~~~~~~~~~~~~~~~
The principles and conditions for forming the manipulation zones I show in this trade idea are detailed in my educational publication, which was chosen by TradingView for the "Editor's Picks" category and received a huge amount of positive feedback from this insightful trading community. To better understand the logic I've used here and the general principles of price movement in most markets from the perspective of institutional capital, I highly recommend checking out this guide if you haven't already. 👇
P.S. This is not a prediction of the exact price direction. It is a description of high-probability setups that become valid only if specific conditions are met when the price reaches the marked POI. If the conditions are not met, the setups are invalid. No setup has a 100% success rate, so if you decide to use this trade idea, always apply a stop-loss and proper risk management. Trade smart.
~~~~~~~~~~~~~~~~~~~~~~~~~~~~~~~~~~~~~~~~~~~~~~~~~~~~~~~~~~~~~~~~~
If you found this analysis helpful, support it with a Boost! 🚀
Have a question or your own view on this idea? Share it in the comments. 💬
► Follow me on TradingView for timely updates on THIS idea (entry, targets & live trade management) and not to miss my next detailed breakdown.
~~~~~~~~~~~~~~~~~~~~~~~~~~~~~~~~~~~~~~~~~~~~~~~~~~~~~~~~~~~~~~~~~
GOLD (XAU/USD) : Strong Bullish ConfirmationGOLD is going to continue rising in an uptrend
that the pair established.
A completion of a consolidation and the formation of a new local Higher High
indicate a highly probable bullish continuation soon.
Next resistance - 4180 - 4200

GOLD 1H CHART ROUTE MAP UPDATE & TRADING PLAN FOR THE WEEKHey Everyone,
Please see our updated 1h chart levels and targets for the coming week.
We are seeing price play between two weighted levels with a gap above at 4100 and a gap below at 4057. We will need to see ema5 cross and lock on either weighted level to determine the next range.
We will see levels tested side by side until one of the weighted levels break and lock to confirm direction for the next range.
We will keep the above in mind when taking buys from dips. Our updated levels and weighted levels will allow us to track the movement down and then catch bounces up.
We will continue to buy dips using our support levels taking 20 to 40 pips. As stated before each of our level structures give 20 to 40 pip bounces, which is enough for a nice entry and exit. If you back test the levels we shared every week for the past 24 months, you can see how effectively they were used to trade with or against short/mid term swings and trends.
The swing range give bigger bounces then our weighted levels that's the difference between weighted levels and swing ranges.
BULLISH TARGET
4100
EMA5 CROSS AND LOCK ABOVE 4100 WILL OPEN THE FOLLOWING BULLISH TARGETS
4140
EMA5 CROSS AND LOCK ABOVE 4140 WILL OPEN THE FOLLOWING BULLISH TARGET
4193
EMA5 CROSS AND LOCK ABOVE 4193 WILL OPEN THE FOLLOWING BULLISH TARGET
4233
EMA5 CROSS AND LOCK ABOVE 4233 WILL OPEN THE FOLLOWING BULLISH TARGET
4275
BEARISH TARGETS
4057
EMA5 CROSS AND LOCK BELOW 4057 WILL OPEN THE FOLLOWING BEARISH TARGET
4016
EMA5 CROSS AND LOCK BELOW 4016 WILL OPEN THE FOLLOWING BEARISH TARGET
3965
EMA5 CROSS AND LOCK BELOW 3965 WILL OPEN THE SWING RANGE
3923
3861
As always, we will keep you all updated with regular updates throughout the week and how we manage the active ideas and setups. Thank you all for your likes, comments and follows, we really appreciate it!
Mr Gold
GoldViewFX
