Gold bulls are strong; is 4100 still far away?
News:
Gold rallied after testing the 3915 area again, breaking through resistance levels at 3975-80 and 4030 throughout the day, closing with a large bullish candlestick and forming a bullish engulfing pattern.
This morning, it rose to around 4046 before falling back and breaking below the key support/resistance level of 4005-10.
Technology manifestation:
From the 1-hour chart, the current short-term resistance level to watch is 4035-4030, with a key resistance level at 4060-4055. If this area is broken, the gold price may reach 4100. The short-term support level to watch is 3960. The recommended strategy is to buy on dips, and to observe more and trade less in the middle, avoiding chasing the market and patiently waiting for key entry points.
I will provide specific operational strategies in the channel, so please pay attention.
Trading strategy:
Buy:3989-3986, SL: 3975, TP: 4010-4020-4030
Trade ideas

GOLD LONDONGOLD LONDON TIME layer by layer on 15 min is a sniper strategy developed by shavyfxhub .
we combine EMA+SMA+TIME + STRUCTURE
on intraday hourly candle dont give sniper entry,our aim is sniper or nothing.
4000-3990-3985 will be watched
#gold

Gold failed breakout and rejected zone $4030 - $4050🧭 Chart Analysis (XAUUSD – 1H with structure context) Market Structure
That means momentum continues downward as long as price stays below 4030–4050.
🔑 Key Levels
Level Type Expectation
4050 Resistance / SL zone If broken, bears invalidated
4000 Minor resistance Retest zone after rejection
3920 Target 1 Previous swing low liquidity
3880–3850 Target 2 Measured move of the channel / full extension
3820 Extreme Final downside sweep before reversal possible
📉 Projection
If price closes below 3920 (cleanly on 4H or D1),
next leg likely extends to 3850 — the lower boundary of your yellow trend channel.
That level aligns with:
Previous liquidity grab zone from October 22 low.
Channel bottom support.
Fibonacci extension 1.272 from the 4050 swing high.
⚙️ Trading Setup Idea
Bias: Short (continue existing sell bias)
Sell zone: 4000–4020 (retests possible)
SL: 4060
TP1: 3920
TP2: 3886
TP3: 3850
TP4: 3820 (extended)
Risk–Reward ≈ 1:3.8
✅ Structure = Bearish
✅ Rejection = Confirmed
✅ Target = 3850 realistic if 3920 breaks
Gold weekly chart with both buy and sell entriesLast week both buy and sell levels hit for over 1000 pips each.
This will probably be my last chart for awhile as i dont think theres much intrest in this
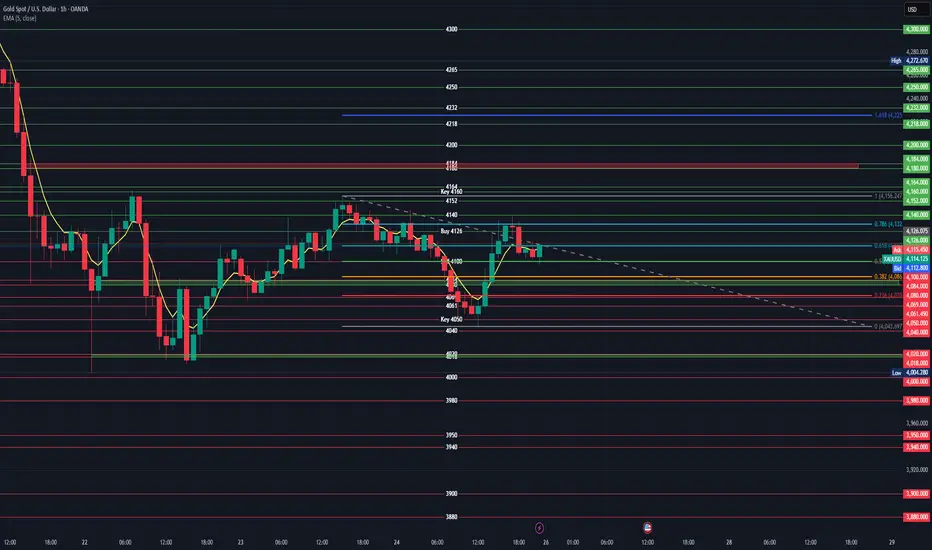
### XAUUSD 4-Hour Chart Analysis
#### **Key Levels Identified**
The chart shows critical **support/resistance zones** based on Fibonacci retracements, historical price action, and labeled key levels. Below is a breakdown of actionable buy/sell levels:
---
### **1. Buy Levels (Long Entry)**
These levels represent potential support where price may reverse upward:
- **Primary Buy Zone**: `4,126` (labeled "Buy 4126" on the chart)
- **Why?** This level aligns with the **0.236 Fibonacci retracement** of the recent swing high (4,164) to swing low (4,004). Historically, price has bounced here.
- **Entry Trigger**: Wait for bullish reversal signals (e.g., bullish engulfing candle, RSI divergence, or price closing above the 5-period EMA).
- **Stop Loss**: `4,095` (below the "Sell 4100" resistance level).
- **Take Profit**: Target `4,160` (Key 4160 resistance), then `4,180` and `4,184`.
- **Secondary Buy Zone**: `4,110–4,115` (near the 0.618 Fibonacci retracement at `4,113.253`)
- **Why?** The price is consolidating here after a dip. A hold above `4,100` (Sell 4100 level) suggests bullish momentum.
- **Stop Loss**: `4,095` (as above).
- **Take Profit**: Same as primary zone (`4,160` and beyond).
---
### **2. Sell Levels (Short Entry)**
These levels represent potential resistance where price may reverse downward:
- **Primary Sell Zone**: `4,132` (0.786 Fibonacci retracement of the swing high/low)
- **Why?** This level is a strong resistance zone where the price often reverses after a rally.
- **Entry Trigger**: Wait for bearish reversal signals (e.g., bearish pin bar, RSI divergence, or price rejecting the level).
- **Stop Loss**: `4,135` (above the resistance level).
- **Take Profit**: Target `4,099` (0.5 Fib), then `4,086` (0.382 Fib), and `4,050` (Key 4050 support).
- **Secondary Sell Zone**: `4,160` (labeled "Key 4160")
- **Why?** This is the **major swing high** (4,164) and a key psychological resistance level. A rejection here confirms a bearish trend.
- **Entry Trigger**: Price must break above `4,160` and then fail to hold (e.g., a bearish candlestick pattern at the level).
- **Stop Loss**: `4,165` (above the resistance level).
- **Take Profit**: Same as primary sell zone (`4,099` and below).
---
### **Critical Context**
- **Current Price**: `4,111.797` (EMA 5 close). This is **above support (`4,100`)** and **below resistance (`4,132`)**.
- **Trend**: Short-term downward momentum after the 4,164 high, but price is recovering from a low. Wait for confirmation of reversal.
- **Fibonacci Retracement**:
- `0.786` (4,132) and `0.618` (4,113) act as key resistance/support.
- `0.5` (4,099) and `0.382` (4,086) are stronger support levels.
- **Risk Management**:
- Always use a stop loss to limit downside risk.
- Target levels should align with the broader trend (e.g., if the trend is bearish, prioritize sell setups).
---
### **Summary of Actionable Levels**
| **Trade Type** | **Entry Level** | **Stop Loss** | **Take Profit** | **Confirmation Signal** |
|----------------|-----------------|---------------|-----------------|-------------------------|
| **Buy** | 4,126 (primary)4,110–4,115 (secondary) | 4,095 | 4,160 → 4,180 → 4,184 | Bullish reversal candle, RSI divergence |
| **Sell** | 4,132 (primary)4,160 (secondary) | 4,135 → 4,165 | 4,099 → 4,086 → 4,050 | Bearish reversal candle, RSI divergence |
> **Note**: Always validate entries with additional indicators (e.g., RSI, volume) and avoid trading during low-volume periods. The 4-hour timeframe favors medium-term trades (1–3 days), so patience is key.
Gold 30Min Engaged ( Bearish Entry Detected )Status: Active Reversal Protocol
Symbol: Gold
Session: London–New York Overlap (Smart Exit Window)
Confidence Level: ★★★★★ ( Hanzo Volume Detected )
☄️ Bearish Reversal 4004
Reasons
☄️ Volume Surge Confirmed — Sellers dominate exhausted highs
☄️ Session Aligned — Smart money exit window open
☄️ Cluster Shield Active — Supply imbalance verified
☄️ Delta Shift Negative — Buyers trapped above
☄️ POC Retest Completed — Liquidity absorbed at resistance
☄️ Structure Break Pending — Bearish bias confirmed
🚀 Logic: This is engineered reversal, not prediction.
🚀 Objective: Controlled execution with minimal drawdown.

If You're Not Just Hearing About Options —But Actually Diving InYou’ve moved beyond indicators and noise.
You’re stepping into the world where smart money operates.
Because options are not just tools for betting.
They’re a mirror of institutional intent — of hedges, positioning, and hidden signals.
And if you learn to listen to this market, you gain a real edge — even if you never trade an option yourself.
You’ll see what’s coming on spot Forex, gold, or indices — before the crowd notices anything.
This isn’t theory from a textbook.
It’s a practical guide forged from over 5 years of daily analysis of CME reports, exchange data, and real-world observation.
Let’s break it down — step by step.
🔍 Step 1: Can You Identify the Player by Option Delta?
Yes — and it starts with understanding delta.
Delta = Sensitivity of an option’s price to changes in the underlying asset.
0.05–0.10 (5–10%) → Deep out-of-the-money (far OTM)
0.15–0.30 (15–30%) → Moderately OTM
~0.50 (50%) → At-the-money (ATM)
>0.50 → In-the-money (ITM)
Now — who trades what, and why?
0.05–0.10 ->Tail-risk hedgers, "lottery" traders
Protection against black swans or cheap speculative bets
0.10–0.20 ->Aggressive speculators, potential insiders
Betting on explosive moves — possibly with inside conviction
0.20–0.35 -> Regular speculators, funds
Expecting moderate rallies — balanced risk/reward
0.40–0.60 - >
Institutions, hedge funds
Portfolio hedging, delta-neutral strategies
>0.60
Arbitrageurs, hedgers
Deep ITM options as synthetic positions
⚠️ Important Nuance:
Delta is not absolute.
Large players may use deep OTM options — but not for speculation.
These could be tail-risk hedges (e.g., protection against crash scenarios).
🔮 Predictive Power Isn’t Just About the Trade — It’s About the Timing
The forecast value of an individual option increases dramatically when you ask:
When did this position appear — relative to price action?
✅ Before a move? → High predictive power
❌ After a big rally? → Likely FOMO or profit-taking
✅ On a pullback? → Could signal support/resistance
IMPORTANT! Timing turns noise into signal.
📌 To be continued in the next update…

Gold 1H - Intraday Trading Plan
🌐 MARKET CONTEXT
Price of gold (XAUUSD) recently reached multi-year highs above $4,000/oz, driven by safe-haven flows, weak U.S. dollar and expectations of monetary easing.
However, near-term headwinds are visible: optimism on U.S.–China trade negotiations, and some pull-back from record highs have switched sentiment from pure “buy the rally” to “buy the dip or maybe sell the bounce”.
There’s also focus on upcoming macro releases (e.g., U.S. Producer Price Index, Fed commentary) which could trigger swings in yields/dollar and thus gold.
Sentiment currently: Slightly risk-off supportive for safe-havens like gold, but with caution creeping in given profit-taking and potential dollar/rate reversal.
Session expectation: With London session opening soon and NY later, expect increased volatility around U.S. data and Fed-related news.
Macro bias: Mildly bullish, as long as the key support zones hold; but neutral/bearish risk increases if support breaks and dollar/yields strengthen.
📉 TECHNICAL ANALYSIS (SMC + LIQUIDITY STRUCTURE)
Structure: After the strong impulse up, price is in a corrective phase (range/flag) rather than clean uptrend. The prior strong high now acts as potential liquidity trap (smart money exhaustion).
Key zones to monitor:
Support zones where demand may appear: look for sweep of liquidity at previous lows or structural support.
Supply zones above where untested liquidity resides – places big players may unload.
Confirmation of SMC: Watch for signs of liquidity sweep (WSB/SSL), false breakout (fake BOS), or trap (smart money manipulating stop-hunts) in M15/H1.
For example: if price revisits a support zone and shows a wick below then closes back above → potential mitigation → buy scenario. Conversely, if price rallies to a supply zone then reverses sharply → possible trap → sell scenario.
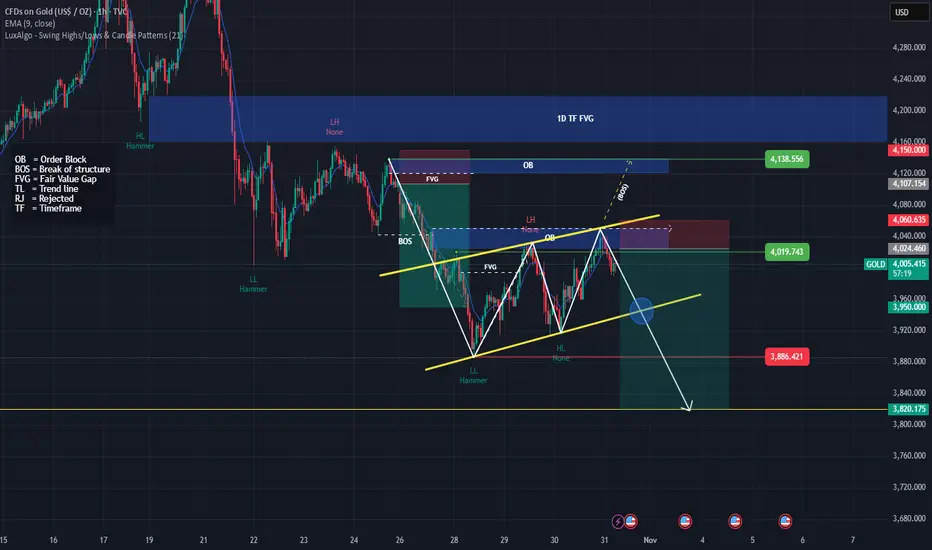
🔑 KEY PRICE ZONES
$4,120–4,140 ▶️ Supply zone – near recent highs; potential profit-taking and stop-hunts above.
$4,000–3,980 ▶️ Important Support – psychological $4k level + prior swing area.
$3,935–3,905 ▶️ Strong Support – deeper structural demand zone + previous channel base.
$3,860–3,840 ▶️ Lower Support / liquidity sweep zone – if the major supports fail, this is next.
$4,200–4,230 ▶️ Extended Resistance – higher untested supply if momentum returns.
⚙️ TRADE SETUPS
✅ BUY SCENARIO – Demand Bounce
Entry: ~$4,020–4,018 zone
Stop-loss: ~$4,013
TP1: ~$4,120
TP2: ~$4,200
Logic: Price holds above key support, shows mitigation (wick below then back), CHoCH from bear-correction to bullish bias.
✅ BUY SCENARIO 2 – Deeper Support Entry
Entry: ~$3,920–3,918 zone
Stop-loss: ~$3,911
TP1: ~$4,020
TP2: ~$4,120 (trail)
Logic: If first support fails, look for deeper structural support and sweep of liquidity before large players ramp.
✅ SELL SCENARIO – Supply Rejection
Entry: ~$4,140–4,138 zone
Stop-loss: ~$4,147
TP1: ~$4,000
TP2: ~$3,920
Logic: Price rallies into supply, shows reversal (e.g., bullish candle followed by strong bearish candle) during NY session — high-risk, high-reward trap.
⚠️ SCALPING SELL – If sees quick spike above ~$4,140 (into ~$4,160) then rapid rejection → short-term sell targeting ~$4,060.
🧠 NOTES / SESSION PLAN
Focus trade entries during London ↔ early NY session, especially around macro events.
Be ready for spikes/whipsaws given current macro uncertainty.
Wait for confirmation on M5/M15 before entering: don’t jump purely on zone touches.
Avoid entering just before major data or Fed release; be cautious of fakeouts.
Risk-management: Use tight stop losses, keep trade size moderate given higher volatility.
🏁 CONCLUSION
The bias for XAUUSD remains mildly bullish, conditional on key support holding. The market is treading a line between safe-haven demand and profit-taking exhaustion. Primary focus is on the support band ~$4,000-$3,980 for long entries; conversely, the supply zone ~$4,120-$4,140 serves as a potential reversal/trap area. Enter with confirmation, manage risk tightly, and beprepared for sharp moves from macro triggers.
FOLLOW KHANG_TRADER for precision market insights ⚡

Title: Gold Pullback to Key Fibonacci Zone — Is $3900 the BottomAfter a 10% correction, gold is now pulling back toward the $4150–$4200 Fibonacci retracement zone.
If the price extends to around $4300, it could signal that the recent low near $3900 was the true bottom and that the bullish structure is recovering.
The next few candles will confirm whether this move is just a technical pullback or the start of a new uptrend.
As long as the daily RSI stays above 50, the bullish trend remains valid.
(This post is for educational purposes only and not financial advice.)
#Gold #XAUUSD #Trading #Markets #Investing

GOLD: Bearish Continuation & Short Signal
GOLD
- Classic bearish pattern
- Our team expects retracement
SUGGESTED TRADE:
Swing Trade
Sell GOLD
Entry - 4001.7
Stop - 4011.35
Take - 3985.2
Our Risk - 1%
Start protection of your profits from lower levels
Disclosure: I am part of Trade Nation's Influencer program and receive a monthly fee for using their TradingView charts in my analysis.
❤️ Please, support our work with like & comment! ❤️

XAUUSD – Gold Eyes a Breakout Above $4,030: Momentum Still Build🟢 XAUUSD | Gold Breakout Setup – Educational Analysis
Gold continues to show constructive price action following sustained bullish momentum across intraday timeframes. After a healthy consolidation phase, the market is now testing a critical resistance zone around $4,030.
A clean breakout and confirmed 1H close above $4,030 would signal renewed strength, aligning with the broader bullish structure observed on higher timeframes (4H & Daily).
🔹 Technical Outlook
The current structure suggests the potential for continuation toward higher liquidity zones if the breakout holds.
Sustained trading above $4,030 would confirm buyer control, invalidating the short-term correction phase.
📈 Trade Plan (Educational Setup)
Entry (Buy Stop): $4,030
Stop Loss (SL): $4,000
Take Profit Targets (TP):
TP1 → $4,060
TP2 → $4,090
TP3 → $4,120
TP4 → $4,150
TP5 → $4,180
TP6 → $4,210
💡 Analyst’s Commentary
This setup aims to capture the potential breakout continuation, with risk contained below the $4,000 psychological support.
Momentum confirmation on H1 and H4 closes will be key for trade validation.
Traders may consider partial profit-taking along the way and trailing stops to secure gains.
⚖️ Risk/Reward: ≈ 1 : 3.5
🕓 Timeframe: H1 – Short-Term Swing
⚠️ Disclaimer:
This analysis is shared for educational and research purposes only as part of Middle East Trading Academy’s ongoing market study.
It does not constitute financial advice or an investment recommendation.

$GOLD is COOKED! Rotation into $BTC Soon!!MARKETS ARE SIGNALING RISK-ON 🔥
TVC:GOLD is so unbelievably COOKED 👨🍳
3 Black Crowes printed on the Daily, with a decisive close below the 20MA 🗡️
Waiting on the final nail in the coffin to close below the DANGER ZONE ~$3,900 where we will then see GOLD retest the 50MA along with the 50% Gann retrace $~3,750 ⚠️
I very much expect the rotation into CRYPTOCAP:BTC soon 👑

LiamTrading - XAUUSD: SCENARIO BEFORE FOMC LiamTrading - XAUUSD: SCENARIO BEFORE FOMC - $3840 Level Awaits Bottom Fishing Reaction Wave
Hello traders community,
The Gold market is showing a strong and sustainable downtrend. We are witnessing a crash after prices broke through key support zones. With the upcoming FOMC event, our strategy is to seek Buy opportunities at deep liquidity zones and continue Selling when prices recover to retest the broken trend.
📰 MACRO ANALYSIS & CASH FLOW CONTEXT
Gold is currently under dual pressure:
Downward Pressure 🔴: Optimism about the US-China trade progress has significantly weakened the demand for Gold, a safe-haven commodity. Spot Gold prices have fallen below $3950, hitting a three-week low, down about 0.78% on the day (28/10).
Short-term Support 🟢: Bets on the possibility of a Fed rate cut continue to weaken the US Dollar (USD), which is the only factor that could potentially support this precious metal.
Conclusion: This tug-of-war makes it difficult to determine the bottom. The bearish scenario remains the top priority.
📊 TECHNICAL ANALYSIS: THE DOWNWAVE CONTINUES
Based on the H4 chart (image_5fa7fa.png):
Current Trend: The price has successfully broken through the key liquidity support zone near $3950 and is continuing its downtrend.
Current Fibonacci Level: The price is touching and reacting at the 1.618 Fibonacci zone (around $3950).
Next Level: The next level Gold is targeting will be the 2.618 Fibonacci zone (around $3840), which is a large liquidity area expected to see a strong reaction.
Main Strategy: We focus on two scenarios: Bottom fishing reaction at 3840 and continuing to Sell when the price recovers.
🎯 DETAILED TRADING PLAN (ACTION PLAN)
We have two detailed scenarios based on the current price level:
🟢 BUY Reversal Scenario
We wait for the price to hit the deep liquidity bottom zone of 3840 to execute a buy order with the expectation of a technical recovery.
Entry Zone: 3840
Stop Loss (SL): 3832 (tight SL)
Take Profit Targets (TP): TP1: $3872 | TP2: $3898 | TP3: $3925 | TP4: $3950
🔴 SELL Retest Scenario
If Gold recovers without breaking the downtrend structure:
Entry Zone: Watch for a Sell retest at $4091
Stop Loss (SL): $4099
Take Profit Targets (TP): TP1: $4065 | TP2: $4033 | TP3: $4004 | TP4: $3965
SUMMARY & DISCIPLINE (Steven's Note)
Gold is in a strong fall ahead of the FOMC, with significant volatility expected. Capturing deep Fibonacci and Liquidity zones is key.
Note: Always adhere to the set Stop Loss. Capital management is the number one priority, risking only 1-2% of the account per trade.
Wishing traders a successful and disciplined new trading week!

How about a big profit short trade in gold?
Hello everyone
The gold correction is still ongoing and we should wait for a good and beautiful correction.
If you want to make good profits from the market, just follow my page.
Don't forget to support me, friend!!!

Gold Intraday Trading Plan 10/28/2025Gold being very naughty yesterday has just broken 4000, which is a very strong support. I am expecting it continue to drop today. I will look to sell from 4000. My first target is 3950 and ultimate target for today is 3850.

GOLD HIGH PROBABILITY SETUPS SOON!!!🚨 XAUUSD HIGH PROBABILITY BUY SETUP 🚨
* Here We Can See Clearly The Next Potential Moves For GOLD Coming Hours/Days.
* Keep Your Eyes Close On Your Trading Positions.
* Happy PIP Hunting Traders.
FXKILLA.

Why Is Gold Called the King of Assets?👋Hello everyone!
If you are an investor, you have probably heard the saying: “Gold is the king of assets.” But why gold? Why does gold always hold a special place in the financial markets and is considered a safe haven in all circumstances? Let’s explore why gold deserves this title and why it remains a favorite choice among millions of people around the world!
1.Gold Is the Guarantee of Safety
When the stock market plunges, when economies face crises, or when inflation erodes the value of currencies, gold is always the first choice of smart investors. While other assets can lose value quickly, gold tends to hold its worth — and can even rise. This is why gold is regarded as a “safe haven” in times of uncertainty.
Gold is not only favored by individual investors but also by governments and central banks around the world. They accumulate gold as a way to protect their nations’ economies from global financial shocks.
2.Gold: An Asset That Cannot Be Printed Like Money
There’s one thing we must understand clearly: gold has a limited supply. Unlike money, which can be printed at the discretion of central banks, the supply of gold is fixed and can only increase through mining — a costly and time-consuming process. This natural scarcity makes gold a sustainably valuable asset.
3.Gold Is a Symbol of History
Gold is not a new type of asset. It has been intertwined with human history for thousands of years. Since the dawn of civilization, gold has been used as a medium of exchange, a precious possession, and even as the foundation of global monetary systems. From ancient Egypt to the modern day, gold has always held a special place in society.
This gives gold a level of longevity that few other assets can match. When you own gold, you don’t just own a valuable physical item — you own a piece of history.
4.Gold Is Easily Convertible and Highly Liquid
Wherever you are in the world, gold can easily be converted into cash. Unlike most other assets, you can sell gold in almost any country and in nearly any circumstance without major restrictions. Therefore, gold is not only valuable but also highly liquid, allowing you to turn it into cash whenever you need it.
5.Gold Is a Tool to Diversify Risk
While stocks or bonds can fluctuate wildly and cause anxiety, gold can serve as a perfect diversification tool. Suppose you have investments in stocks or real estate — allocating a small portion of your portfolio to gold can help reduce risk during times of market turbulence. Gold helps you protect your wealth and maintain stability in an unpredictable world.
6.Gold: An Asset Anyone Can Own
Gold isn’t just for billionaires or big institutions. You don’t need a million-dollar account to own gold. With the rise of online gold trading and products such as small gold bars, jewelry, and even digital gold, anyone can own it conveniently and affordably.
7.Gold Never Goes Out of Style
One unique thing about gold is that its appeal never fades. Every time the price rises, more people rush to buy it. Gold isn’t just valued for its stability and ability to preserve wealth — it’s also a symbol of prosperity and success. A gold ring or a small bar of gold always carries a sense of pride for its owner.
With all these reasons, it’s no surprise that gold is called the “King of Assets.” It can protect you during tough times, provide opportunities for profit in uncertain markets, and remain timeless through generations. Whether you’re a seasoned investor or a beginner, gold will always be a valuable and worthy investment choice.
Would you like to become a billionaire — a true gold trading expert?
💬Share your thoughts about gold below, and don’t forget to hit that like button — it means a lot to me!

XAUUSD: Will Gold Continue to Rise or Fall?👋Hello everyone, what do you think about OANDA:XAUUSD ?
As of writing, gold is trading around $4115, partially recovering from the sharp decline of the past few days. To explain the steep drop in gold prices on Tuesday, there’s no need for any conspiracy theories — the previous meteoric rise was already a big enough reason.
Earlier, gold reached extremely high levels, and the rally had matured; any irrational market could fall without a clear reason.
Despite this, while gold remains under technical selling pressure after the shock, the market is holding the initial support level above $4,000. After this volatility, it may take longer than expected for precious metals to regain stability. However, it’s still too early to conclude whether this is a "market crash" or just a short-term correction.
From a technical perspective, gold is reacting well to the $4000 support I had previously anticipated . If it can hold, the next challenge to watch will be the first resistance zone around $4200 - $4230. As long as the support holds, I’m still betting on an upward trend.
What about you? What do you think about gold prices? Will it continue to rise or fall? 💬Leave your thoughts in the comments below!

Gold 1979 vs 2025 — When History Whispers and Markets Listen
🌕 1. The Echo of 1979
In 1979, the world watched Gold do the impossible. The metal surged from $226 to over $850 per ounce in less than a year, a 275% explosion that turned fear into fortune.
The triggers were seismic.
🇮🇷 The Iranian Revolution disrupted global oil flows.
🏛️ The U.S. Embassy hostage crisis fueled geopolitical panic.
⚔️ The Soviet invasion of Afghanistan reignited Cold War fears.
💸 And double-digit inflation in the U.S. shredded faith in the dollar.
By early 1980, panic replaced logic. Every newspaper screamed, “Buy Gold before it’s too late!” Then came Paul Volcker’s shock therapy as interest rates jumped above 15% and COMEX doubled margin requirements. Within eight weeks, Gold fell more than 40%, marking the end of one of the most dramatic speculative manias in modern history.
🔁 2. Fast-Forward to 2025: The Parallels Are Uncanny
The world of 2025 looks hauntingly similar.
🕰️ 1979 🔮 2025
Iranian Revolution and Cold War tensions Gaza war, U.S.–China decoupling, and regional instability
Oil shock and inflation Energy disruptions and persistent post-pandemic inflation
Dollar under pressure Record U.S. debt and fiscal erosion
Panic buying of Gold Central bank accumulation and retail FOMO
Fed under Volcker turns hawkish Fed under Powell trapped between cuts and control
By late August 2025, gold sat quietly near $3,415, then erupted into a seven-week vertical rally above $4,300, a mirror image of 1979’s euphoric climb. But just like back then, euphoria was the prelude to exhaustion.
⚠️ 3. The Anatomy of the Current Crash
On October 17, 2025, Gold plunged $250 in one day, a shocking 5–6% drop that broke its parabolic structure and sent fear rippling across markets.
What triggered it?
🏦 A hawkish shift in the Federal Reserve’s language as officials hinted rate cuts might be delayed.
💰 Real yields surged, breaking the inverse correlation that had fueled gold’s climb.
🏛️ Institutional profit-taking hit record levels, confirmed by rising COMEX open interest and volume.
🗞️ Sentiment flipped overnight as headlines shifted from “Gold to $5000” to “Gold crashes $250.”
The move marked the first true break of structure (CHoCH) since the rally began, historically the signal that smart money is quietly exiting.
🔍 4. Lessons from 1980 — The Signs of a Top
Before gold crashed in 1980, five clear warning signs appeared.
⚙️ 1979–1980 Signal 💡 2025 Equivalent 🧭 Status
Fed turns hawkish Powell signals “pause / higher for longer” ⚠️ Emerging
Rising bond yields vs. flat Gold Real yield divergence ✅ Confirmed
Parabolic candles Daily range above $100 ✅ Seen
Media frenzy “Gold to $5000” hype ✅ Seen
Margin hikes and record OI Record COMEX participation ⚠️ Rising
Four out of five signals are already flashing. History teaches that when everyone believes Gold can only rise, it’s often about to fall.
🧭 5. What Smart Traders Should Do Now
🟡 Phase 1 – Immediate Protection (Next 24 Hours)
If you’re long, secure 50–75% of gains and protect above $3,950.
If you’re short, trail stops to $4,200 and look for targets at $3,950 → $3,800 → $3,600.
If you’re flat, stay patient and wait for at least two daily candles of stabilization before acting.
🟠 Phase 2 – Stabilization (Next 3–5 Days)
Watch for:
🕯️ Long lower wicks on daily candles show buyer absorption.
📉 Shrinking COMEX volume indicates exhaustion of sellers.
📊 Flat or falling real yields confirming support.
🔵 Phase 3 – Re-evaluation (Next 1–2 Weeks)
If gold reclaims $4,000+ with strength and Fed tone softens, a controlled re-rally may begin. If Gold stays below $3,800, the correction likely extends toward $3,500, the same 30–40% retracement seen in 1980.
🧘♀️ 6. Beyond the Chart — Discipline Over Drama
When a $250 candle appears, instincts scream, “Do something!” But professionals know the truth: reaction destroys capital, observation preserves it. The coming days are not about prediction but about posture. Stay liquid, track sentiment, watch real yields, and remember that even in 1980, Gold’s crash didn’t end its story — it simply reset the cycle for the next era of accumulation.
✨ History doesn’t repeat, but it rhymes. In 1979, Gold taught us that fear creates bubbles. In 2025, it’s reminding us that even truth needs a pullback before it shines again.
If this article helped you today and brought you more clarity:
Drop a 🚀 and follow us✅ for more trading ideas and trading psychology. Thank you.

Does gold correct?
Hi my dears
After a good bullish rally in gold, we should probably see a decline and correction in gold, which of course is consistent with the fundamental news we hear about the balanced relationship between the US and China. Therefore, we should look for more sales entries.
Whenever the price of gold closes below the blue line, there is a possibility of reaching the specified prices, so we should keep an eye on the chart and open a sell trade after the specified condition is activated.

Don't rush into gold; it's still going to fall!Although current market news is generally bullish for gold, the recent decline in gold prices is primarily driven by large-scale profit-taking and a technical correction that has been stronger than expected. Gold is currently at a critical turning point. Tuesday's sharp drop has indeed weakened the short-term trend, but Wednesday's rebound and the bullish engulfing pattern formed on the 4-hour chart clearly indicate solid buying support below. Overall, gold prices are likely to fluctuate and consolidate in the short term between 3980 and 4145-4155, awaiting new directional catalysts. Gold is currently in a correction cycle, with overall momentum weak. Therefore, the recommended trading strategy is to short on rallies. Sell on rallies!!!

( Gold Protocol ) Bullish & Bearish Reversal Detected➕ Bearish Reversal " 4115 Zone
➕ Bullish Reversal : 3990
🩸 Volume Surge Confirmed — Institutional buyers active
🩸 Session Aligned — Timing matches liquidity expansion window
🩸 Cluster Shield Formed — Demand imbalance verified
🩸 Delta Shift Positive — Accumulation phase confirmed
🩸 POC Retest Completed — Weak shorts absorbed
🩸 Structure Break Pending — Bullish intention verified
Logic: This is engineered reversal, not prediction.
💯 Objective: Controlled execution with minimal drawdown.
How Smart Money Moves Gold (XAUUSD)🟡 Gold never moves randomly — it moves with intention.
Every spike, every fake breakout, every sharp reversal… it’s all part of a bigger plan by smart money (institutions) to trap emotional traders and collect liquidity.
Let’s break it down 👇
⚡ 1️⃣ Liquidity Grab (The Trap Phase)
Before any real move, gold sweeps stop-losses above highs or below lows.
Retail traders think it’s a breakout — but it’s actually a liquidity hunt.
Smart money fills large positions here while emotions run high.
⚡ 2️⃣ Market Structure Shift (The Clue)
After collecting liquidity, watch for a BOS (Break of Structure) or CHoCH (Change of Character) — these reveal when the real move is starting.
⚡ 3️⃣ Smart Money Entry (The Real Move)
Once the trap is set, gold often makes a strong impulsive push.
This is where institutions enter — and where smart traders follow with confirmation, not emotion.
⚡ 4️⃣ Emotional Traders Lose, Logical Traders Win
The market doesn’t hate you — it simply feeds on emotional reactions.
Be patient, wait for liquidity sweep ➜ structure shift ➜ confirmation entry.
🧭 Pro Tip:
👉 Stop chasing candles.
👉 Study liquidity and market structure.
👉 Let the chart show who’s trapped — and then trade against them.
💬 Remember:
“The market rewards patience, not panic.”
💎 Gold (XAUUSD) moves on liquidity — not luck.
#TradeSmart #ThinkLikeInstitutions #XAUUSD

Lingrid | GOLD Weekly Support Hold Long OpportunityOANDA:XAUUSD pulled back sharply from the resistance and printed a higher low right at the confluence of the uptrend and above previous week low 4,050. Structurally, the broader upward channel remains intact while price retested the downward trendline from above, keeping the higher-low sequence alive. If 4,000–4,050 support continues to hold, it favor a rebound toward 4,245 and, if momentum extends, a run at 4,400; a daily close back below 4,043 would defer the bounce. Broader momentum still skews bullish with successive higher lows, suggesting the recent drop is a corrective pullback within the trend rather than a top.
⚠️ Risks:
A decisive break below 4,000 that invalidates the uptrend confluence could extend losses toward 3,950–3,900.
Strong USD and higher real yields on hawkish Fed rhetoric/data may cap upside or accelerate downside.
Diminishing geopolitical risk or risk-on equity strength could sap haven demand for gold.
If this idea resonates with you or you have your own opinion, traders, hit the comments. I’m excited to read your thoughts!
