XAUUSD BEARISHThe last trade was in loss. Now we are in the sell trade. SR SL TP are given in the chart. Updates will be given soon.
Trade ideas

XAU-USDThe first target I gave yesterday was touched and
+600 PIP profit 🚀🚀
For today, when the price goes above the 4040 level, it is really risky and not logical below this level.

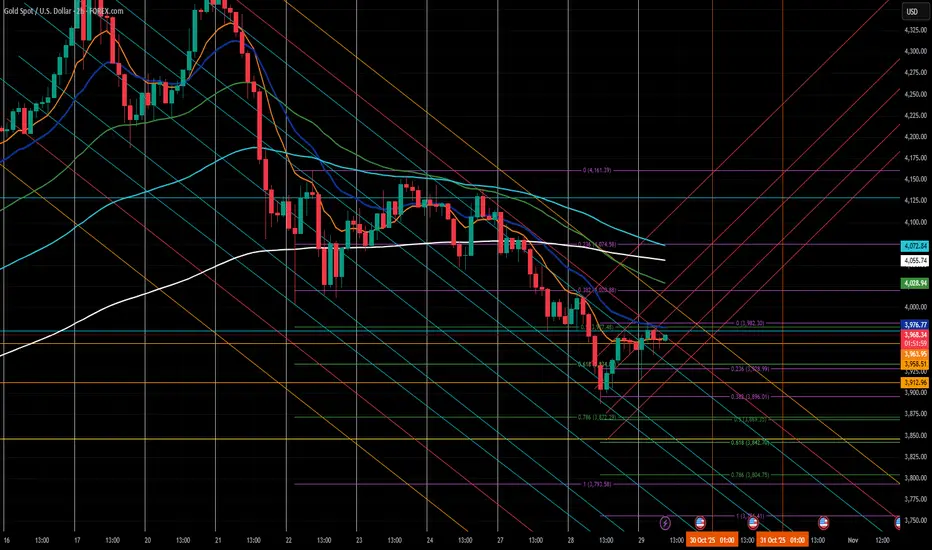
Elliott Wave Analysis – XAUUSD | October 30, 2025
1️⃣ Momentum
• D1 Timeframe:
D1 momentum remains entangled. Yesterday’s daily candle closed at its lowest point, rejecting all intraday bullish attempts. However, it has not yet broken the previous candle’s low — this suggests that the bearish trend is still intact, though weakening, and a potential reversal could occur within the next 1–2 days.
• H4 Timeframe:
H4 momentum is approaching the oversold zone, indicating a possible short-term recovery lasting around 4–5 H4 candles.
• H1 Timeframe:
The price is currently either consolidating or continuing its short-term decline.
If it continues to cling to the 3927 liquidity zone, a further breakdown is likely.
________________________________________
2️⃣ Wave Structure
• D1 Timeframe:
Price is now sitting near the 0.382 Fibonacci retracement of wave (3) in yellow — a typical correction level for wave (4).
Therefore, if the decline continues or the correction extends, it’s highly probable that we are in wave (4) of the yellow count, and the current drop is only the first sub-wave of this corrective phase.
• H4 Timeframe:
Currently, price is around the 0.872 extension of wave (3) in purple, which is not ideal for a completed wave (4).
When combining the D1 and H4 structures, both indicate that the market is likely forming a corrective wave (4) in yellow, and a recovery move may soon appear as D1 momentum begins to turn upward.
👉 If this scenario is confirmed:
o If price breaks above the previous wave (3) high (around 4400), it would confirm the start of a new impulsive wave upward.
o If price rises slowly and the highest target only reaches around 4400 before turning down again → this move is likely part of the corrective wave (4) before another bearish leg resumes.
• H1 Timeframe:
The current formation suggests a potential double zigzag structure.
To confirm this setup, price needs to break below 3892. This is a strong liquidity zone, so if price reaches it, a temporary bounce could occur.
Key liquidity zones above to watch: 3927 – 3953 – 3995.
If price fails to break above the previous red wave X, these zones may act as strong resistance levels, pushing the market lower again.
Target areas for the red wave Y are:
o 3814
o 3786
________________________________________
3️⃣ Trade Plan
Scenario 1:
• Buy Zone: 3815 – 3813
• SL: 3804
• TP1: 3892
Scenario 2:
• Buy Zone: 3787 – 3785
• SL: 3776
• TP1: 3892
________________________________________
📌 Summary:
D1 momentum is weakening and nearing the oversold zone → a potential bullish rebound could develop in the coming sessions.
The 3815 – 3785 area remains a key buy zone, while 3927 – 3995 should be closely monitored as resistance levels to confirm the next directional move.

GOLD XAUUSD GOLD ,the Sydney/asian market opens ,on 4hr the supply roof is broken and i hope that buying will approach 4062.19 and extend purchase into 4100 zone .
if price pulls back for liquidity on 4hr i will always watch the 3962 demand floor for buy.
KEY FUNDAMENTAL REPORT for the week..
The Federal Reserve announced a 25 basis point cut to its benchmark federal funds rate on October 29, 2025, lowering the target range to 3.75% - 4.00%. This marks the second consecutive rate reduction this year. The decision was made amid moderate economic expansion, a slowing job market, slightly elevated inflation, and uncertainty caused by limited economic data due to a government shutdown.
The Fed also stated it will end the reduction of its balance sheet assets (quantitative tightening) on December 1, 2025. The committee emphasized attentiveness to the evolving economic outlook, risks to employment and inflation, and readiness to adjust policy accordingly. The vote was 10-2, with some dissent for either deeper cuts or no cuts at all.
This rate cut supports easing financial conditions to aid maximum employment and returning inflation to the 2% long-run goal.
Federal Reserve Chair Jerome Powell delivered speech.
Key points from his speech:
The Fed remains focused on achieving maximum employment and stable prices.
Despite some disruption from a partial government shutdown delaying some economic data, available information indicates little change in employment and inflation outlooks since the September meeting.
Labor market conditions appear to be gradually cooling, with inflation still somewhat elevated.
The rate cut was aimed at supporting these goals given the balance of risks to employment and inflation.
The Fed will end the reduction of its asset holdings (quantitative tightening) on December 1.
Powell emphasized a balanced approach between supporting growth and controlling inflation, noting the policy is not on a preset course.
Future rate moves remain data-dependent; a December rate cut is not guaranteed.
He acknowledged the challenges and trade-offs in monetary policy decision-making, especially under uncertainty from recent disruptions.
Overall, Powell’s speech conveyed cautious optimism combined with a pragmatic acknowledgement of incoming risks and uncertainty, signaling readiness to adjust policy to evolving economic conditions.
NOTE ;TRADING IS 100% PROBABILITY.
RISK MANAGEMENT IS KEY
ANY KEY LEVEL CAN FAIL.
#GOLD #US10Y #DOLLAR

Gold on side Swings on Fed aftermathAs discussed throughout yesterday's session: 'My position: I am Buying Gold aggressively throughout yesterday's session all along especially when #3,952.80 benchmark got invalidated to the upside. Gap to the downside on Asian market opening delivered excellent chances to Buy more as I closed all orders with #4,000.80 Take Profit. Keep in mind that I might Sell #4,024.80 now (aggressive Scalp to the downside) only to Buy more. #4,052.80 benchmark and #4,100.80 extension are my Targets.'
If you followed Trading plan I announced above, you would be in excellent Intra-day Profits. I have Sold Gold from #4,027.80 High's multiple times and re-Bought Gold from #4,004.80 especially delivering excellent results and altered all my Trading activity (no need to gamble on Fed Rate decision aftermath). My Profit is excellent and will sit out today's session as it will be full of side-Swings where I will continue comfortable Trading throughout tomorrow's session.

GOLD: Short Trade Explained
GOLD
- Classic bearish formation
- Our team expects fall
SUGGESTED TRADE:
Swing Trade
Sell GOLD
Entry Level - 3972.9
Sl - 3987.4
Tp - 3944.7
Our Risk - 1%
Start protection of your profits from lower levels
Disclosure: I am part of Trade Nation's Influencer program and receive a monthly fee for using their TradingView charts in my analysis.
❤️ Please, support our work with like & comment! ❤️

XAUUSD 15-Minute Small-Scale Swing Trade - Short Position XAUUSD 15-Minute Small-Scale Swing Trade - Short Position
- Enter short position directly around the current price of 4122 USD, with stop-loss set at 4160USD.
- First target: Take profit around 4060 USD; close half of the position and trail the stop-loss to lock in gains.
- Second target: Take profit around 4000 USD; close all remaining short positions and exit with full profits.

Gold 30 Mints Resistance Rejection SetupGold is showing signs of weakness after retesting the 30-minute resistance area, following a clear break of structure. The market currently respects the lower high formation, suggesting a potential short-term correction toward the support zone as sellers regain control.
Key Levels:
Sell Entry: 3980
Take Profit: 3950
Stop Loss: 4000
Reasoning:
Technically, the price has completed a structure break and is now retesting previous resistance, turning it into a new supply zone. Candlestick behavior shows bearish pressure, supporting a short setup.
Fundamentally, stronger U.S. dollar sentiment and cautious risk tone before upcoming U.S. data keep gold under pressure.
Disclaimer:
This analysis is for educational purposes only and not financial advice. Always manage risk and follow your own trading plan before executing any trade.

Gold (XAU/USD) Short-Term Buy Setup on 1H ChartThis TradingView chart shows the Gold Spot (XAU/USD) price on the 1-hour timeframe. The current price is $3,950.31, with a recent gain of +0.50%. The chart indicates a potential bullish setup, highlighted by the blue arrow pointing upward. The entry zone appears around the current price, with a target near $3,975.58 (take profit) and a stop-loss around $3,940.15, suggesting a short-term long (buy) trade idea.

GOLD XAUUSD LONDON PERSPECTIVE THE LAST POSTED CAME COMPLETED, this will help give insight into sniper entry on sell and next sell position based on the sentiment of the sentiment of the market structure
the rejection 4007-4011 will be watched as it has the tendency to challenge 4030-4035 .
4030-4035 has strong rejection structure with a technical sell probability.
if we break out of 4030-4035 go long and target 4098-4125 sell zone .
on a flip side watch the retest of the current low at 3885-3889 floor should we fail to hold support.
the new rate remain 3.75%-4.0%
gold and silver price action is reacting to the rate cut and expect volatility soon.
trading GOLD during newyork/london brings alot of liquidity and volatility.
risk management is key.
trading is 100% probability and any key level can fail.

Gold price analysis on October 30Fundamental Analysis
Gold prices remained confined within a familiar range, despite the volatility caused by the US Federal Reserve's key monetary policy decision on Wednesday.
Powell noted that policymakers may be more cautious if this prevents them from releasing further reports on jobs and inflation.
Markets are now pricing in a 67.8% chance of the Fed keeping rates unchanged at its December 10 meeting, compared with a 9.1% chance before the Fed's announcement.
President Trump said he hoped to reduce US tariffs on Chinese goods in exchange for Beijing's commitment to curbing fentanyl precursor exports.
Technical Analysis
Gold gained ground in Asia and is eyeing a return to the 4000 handle, which could happen early today as more supportive news comes in. The weekly peak around 4025 will act as a stop for the price increase and act as a correction to find more buying momentum towards 4100. The BUY zone around 4025 is still good, buying power is still accumulating around here. If the trendline around 4025 is broken, Gold will fall deeply to 3865.
Trading signals
BUY GOLD 3925-3923 SL 3920
SELL GOLD 4025-4027 SL 4030
SELL GOLD 4095-4097 SL 4100

It’s Not Just a Chart, It’s a Mind Game — Stay Calm, GoldRiders.First of all — congratulations to everyone who followed yesterday’s setups!
We sold in the morning and made profits, then bought during the U.S. session — and won again.
Even though the technical analysis was pointing opposite to the news direction, price movement proved once more that the chart often leads before headlines.
Some followers were confused when I mentioned the news was positive for the dollar — which normally means gold should fall — yet buyers secured safe profits above 3938. That was a wise move reflecting good risk control.
Despite the positive Richmond Manufacturing Index and Consumer Confidence data (both supportive for USD), gold respected the technical levels more than fundamentals.
This is normal, as low to medium-impact data rarely outweigh technical setups, unlike major events such as interest rate decisions, which can override technical signals completely.
From the chart:
After dropping from 4019 early yesterday to 3886 around noon, gold reversed and started forming a higher high.
Currently, any dip below 3945 signals minor weakness, below 3928 indicates stronger bearish pressure,
and a confirmed breakdown happens only under 3898–3883.
On the upside, strong resistance persists between 3970–3983, tested since last evening.
A breakout above it could open the way to 4017–4020.
Important Warning:
Today is high-risk.
Expect volatility not only during the FOMC rate decision at 9:00 PM and Jerome Powell’s speech at 9:30 PM,
but possibly much earlier — the “volatility show” can start anytime.
So please trade cautiously.
If you’re new, still learning, or your emotions or account size can’t handle sharp swings —
sit out today and observe.
For learners, use a demo account as if it’s real — that’s one of the best lessons you’ll ever get.
Also note: Meta, Microsoft, and Alphabet (Google) will release earnings today — adding even more volatility.
Bullish Scenario (Buy)
Entry: Safe entry above 3983 (aggressive from 3967)
Targets: (3972–3976) – 3982 – 3994 – 4000 – (4007–4012) – 4021 – 4031 – 4046 – 4055 – 4064 – (4072–4077) – 4084 – 4097 – 4103 – 4117
Don’t feel safe with any buy before breaking 3983. The next key resistance is 4020.
Bearish Scenario (Sell)
Entry: Safe entry below 3928 (aggressive from 3938)
Targets: (3932–3930) – 3922 – 3913 – 3906 – 3901 – 3895 – 3887 – 3873 – (3860–3856) – 3842 – 3821 – 3813 – (3804–3800) – 3793
Notes:
1- This page doesn’t engage with sarcastic or disrespectful comments — if you don’t like the post, just scroll.
Professional discussions are always welcome.
2- If you found this analysis useful, share it — your support makes a real difference!
✍️ We appreciate it, if you drop a comment if you received the analysis clearly.
Disclaimer:
This analysis reflects my personal opinion and market observation only.
It is not investment advice or a buy/sell recommendation.
Trading in financial markets involves high risk, and all decisions remain the trader’s responsibility.
Smart Money Concept (SMC)📊 XAU/USD Analysis (15M)
🔑 Key Points
1. Change of Character (CHoCH):
The price stopped creating lower lows and showed bullish intent after two CHoCH confirmations.
2. Support Zone & Order Block (OB-15M):
The area between 3,892 – 3,930 acted as support, with an Order Block (15M) that served as the key point for institutional mitigation and rejection.
3. Fake Out & Accumulation:
Before moving higher, the market created a Fake Out, sweeping liquidity and trapping sellers. This confirmed accumulation before the bullish move.
4. Entry & Risk Management:
• Buy: 3,930
• SL: 3,892 (below the OB/support)
• TP: 4,018 (Buy-Side Liquidity target)
• Risk/Reward (R/R): 1:2.32
5. Target Hit:
Price reached 4,018, validating the liquidity-based strategy with OB confirmation and rejection.
📈 Conclusion
This trade was built on three SMC pillars:
• Identifying liquidity zones (Buy-Side).
• Using Order Blocks for precise entries.
• Confirmation through Fake Out and rejection.
Result: A clean winning trade with optimal RR and target achieved ✅
💡 Motivational Note
“In trading, patience and discipline always outperform rushing. Liquidity reveals the path — you just need to wait for it.” GOOD JOB TRADERS.. 🤗

GOLDPreferably suitable for scalping and accurate as long as you watch carefully the price action with the drawn areas.
With your likes and comments, you give me enough energy to provide the best analysis on an ongoing basis.
And if you needed any analysis that was not on the page, you can ask me with a comment or a personal message.
Enjoy Trading ;)

GOLD XAUUSD NEWYORK BACKUP CHART 2HR+EMA LONDON /NEWYORK GOLD MARKET SESSION SHOWING ME SOME STRONG BULLISH DISPOSITION but the bullish confirmation hinges on break and close 4030 line chart close of my 4hr candle chart my preferred intraday time frame for deep analysis and trade directional bias in real time
if they break 4030, i will watch 15 min chart of the 4070-4055 zone for possible sell reaction price action, like I did in the yesterday sniper buy at 3885-3890 for reference which was posted for free.
the 4HR structure is my litmus test and guide in bullish continuation or bearish take profit.
if 4030 on timing 12;00 drops then i will hope that 4003-4006 demand keeps the bullish impetus so we can ride into 4150 wave ..
the FOMC RATE AND MEETING WILL BE VOLATILE .
GOLD IS 100% BULLISH AND IN THE HANDS OF CENTRAL BANKS.
GOODLUCK

XAUUSD: How Will Gold Prices Move Next?Fundamental approach:
- Trade Talks and Gold Sentiment:
Gold experienced a sharp correction after reaching record highs, primarily due to improving risk sentiment as optimism grew around US-China trade negotiations. Reports indicate that both nations have reached a preliminary framework agreement on export controls and tariffs, which is expected to ease geopolitical tensions and reduce demand for safe-haven assets, such as gold.
- Other Pressures: Fed Policy and the US Dollar:
The gold market is also reacting to expectations of a Fed rate cut. While a rate cut typically supports gold, the move is largely priced into the market. Recent steadiness in the US dollar, as well as the possibility of a less dovish stance from the Fed, has added further pressure. With traders focusing on upcoming policy signals and macroeconomic data, a "cut and pause" approach from the Fed could prompt continued profit-taking in gold.
- Outlook:
As long as US-China relations remain stable and central banks, especially the Fed, avoid surprising markets with additional dovish measures, XAUUSD may remain under pressure.
Technical approach:
- XAUUSD significantly declined to the support area of 3890-3950. The price is between both EMAs, indicating a shift to sideways movement.
- If XAUUSD breaches the support area, the price may decline to the next support level at 3720, which is confluenced with the 61.8% Fibonacci Extension.
- Conversely, remaining above the support area may prompt a retest of the next resistance at 4054.
Analysis by: Dat Tong, Senior Financial Markets Strategist at Exness

Correction over - new Annual High's in sightTechnical analysis: The Price-action hit the Daily chart’s Support belt and got rejected as expected near #3,888.80 - #3,892.80 and is currently pulling back on full-bodied Daily chart's candle. In my personal belief, decline was only be temporary as it was delivered in previous Bull runs however caution is required as the Weekly catalysts are still about to be reported (Fed or not, I continue Buying preserving my Bullish stance). Technically the newly formed Ascending Channel on Hourly 1 chart still has a Lower High’s to give around #4,027.80 mark before I re-evaluate the trend and continue soaring regarding the Short-term. As I mentioned throughout my remarks, Gold is Neutral now, turning Bullish as long as Gold closes the week above the #3,888.80 configuration which is far away currently. Selling sequence is limited or near exhaustion, however Gold not only succeeded in breaking the Resistance (#3,952.80 mark) with ease and almost tested second Resistance belt, but was also comfortably Trading above it. Needless to mention on the other side, Ascending Channel is intact due to the sharp Intra-day recovery on DX and uncertainty on all market classes. This outweighs the decline on Bond Yields market.
My position: I am Buying Gold aggressively throughout yesterday's session all along especially when #3,952.80 benchmark got invalidated to the upside. Gap to the downside on Asian market opening delivered excellent chances to Buy more as I closed all orders with #4,000.80 Take Profit. Keep in mind that I might Sell #4,024.80 now (aggressive Scalp to the downside) only to Buy more. #4,052.80 benchmark and #4,100.80 extension are my Targets.

Gold longGold made a steep pullback from that all time high, time to take some profits and aggregate more liquidity. Currently we're seeing a strong rejection, invalidating the latest bearish impulse.
With the FEDs interests rates coming up I have no doubt that the price of gold will be going up again heading towards a new ATH.

XAUUSD Short: Selling the Bounce Within the Descending ChannelHello, traders! The price action for Gold (XAUUSD) has been dominated by a bearish structure since the breakout below the ascending channel and rejection from the SUPPLY ZONE 2 near 4250. This move initiated a clear downtrend, forming a descending channel that has guided the market lower through a sequence of impulsive declines and short corrective rebounds.
Currently, the price is testing the Demand Line of this descending channel, located just above the Demand Zone around 3867. This zone represents a key area of potential buying interest that previously acted as a reaction point during earlier phases of the uptrend. In my view, the market is now entering a critical stage. A temporary corrective rally towards the upper boundary of the channel (near the Supply Zone 1 at 3950–4100) is likely before sellers may step in again to resume the broader downtrend.
My scenario anticipates that this corrective bounce will be limited, with sellers defending the Supply Zone 1, leading to another move downward toward the Demand Zone and potentially lower levels. A confirmed reversal signal in this area, however, could offer a long opportunity for a larger bullish impulse later on. Manage your risk!

"Gold (XAU/USD) Rebound from Support: Short-Term Bullish Setup"This TradingView chart shows the Gold Spot (XAU/USD) on the 1-hour timeframe. The current price is around $3,993.99, up +1.04%. The chart highlights a potential bullish setup, with a support zone marked in purple around $3,985, and a target zone near $4,015. The blue arrow indicates an expected upward move from the support area toward the resistance zone, suggesting a possible buy opportunity within this range.

XAU/USD – Gold Faces Key RejectionXAU/USD – Gold Faces Key Rejection Zone Near 4,050 Ahead of Month-End
Gold prices (XAU/USD) are attempting a short-term rebound from the 3,900 support area after an extended bearish leg last week. However, the recovery momentum is now testing a critical resistance zone around 4,020–4,050, which previously acted as a major breakdown point.
From a technical standpoint, the overall structure remains bearish as long as price stays below 4,050. The recent move appears to be a retracement toward the 38.2% Fibonacci zone, aligning with the EMA dynamic resistance and prior supply area. A clear rejection from this region could trigger renewed selling pressure toward 3,908–3,880, while a confirmed breakout above 4,050 would open the door for a corrective push toward 4,180 and 4,390.
Key Levels:
Resistance: 4,050 / 4,180 / 4,390
Support: 3,908 / 3,880 / 3,792
Trading Strategy:
Scenario 1 (Bearish bias): Watch for bearish reversal signals at 4,020–4,050. A rejection candle or RSI divergence could validate short entries toward 3,908.
Scenario 2 (Bullish breakout): If gold closes firmly above 4,050 on H1–H4 timeframe, short-term buyers may target 4,180 before reassessing momentum.
Overall, sellers still hold control unless bulls reclaim 4,050 convincingly. Traders should monitor today’s U.S. data releases and Fed commentary for volatility triggers.
Remember to follow for more daily trading setups and technical insights.

GOLD at breakout level? What's next ??#GOLD.. market just reached at his current breakout area that is around 3945 .
If market sustain below than we can expect further drop...
Good luck
Trade wisely

Gold 1H Trend Reversal Setup | 4000 | 4100Market Outlook
Gold has recently shown signs of a potential bullish reversal after breaking above a descending trendline.
The market has shifted from a short-term bearish trend into a possible accumulation phase, with buyers stepping in near 3896–3940 support.
🧭 Technical Breakdown
1️⃣ Structure Break:
Price broke the descending trendline, showing momentum shifting from bearish to bullish control.
2️⃣ Retest Zone:
Retest area 3939–3960 aligns with a previous short-term supply zone, now turning into potential demand.
3️⃣ Target Zone:
If bullish momentum holds, the next major upside target lies between 4120–4160, where higher-timeframe resistance and liquidity exist.
4️⃣ Invalidation Level:
A clean 1H close below 3939 would invalidate this bullish setup and suggest further downside toward 3896.
Trade Idea (Educational Purpose Only)
Parameter Price Level Explanation
Buy Zone 3940–3960 Retest of broken structure
Targets 4040 → 4120 → 4160 Major resistance & liquidity area
Invalidation Below 3939 Break below support invalidates setup
💬 Summary
Gold is setting up for a possible reversal rally, but confirmation is key — wait for a strong bullish candle on retest before considering continuation.
⚠️ This analysis is for educational and discussion purposes only — not financial advice.
